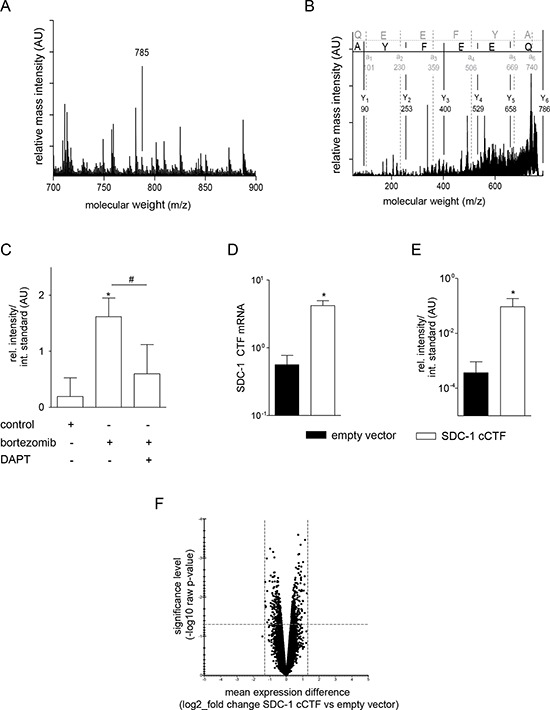
Figure 2. The syndecan-1 cCTF does not affect gene transcription.

A, B. Lysates of A549 cells were subjected to SDS-PAGE. The protein band with the expected size of syndecan-1 cCTF was digested with trypsin and analyzed by MALDI-TOF/TOF. A) Characteristic MALDI-TOF/TOF mass-fingerprint-spectrum: The arrows indicate characteristic mass-signals of peptides corresponding to the tryptic digested syndecan-1 cCTF with a molecular mass of 785 Da. B) Verification of amino acid sequences of the 785 Da peptide by mass spectrometry. C. A549 cells were incubated for 16 h in the presence or absence of the proteasome inhibitor bortezomib (5 μM) or γ-secretase inhibitor DAPT (5 μM) and investigated for the presence of endogenous syndecan-1 cCTF by MALDI-TOF/TOF. Quantified mass-signal intensities of the 785 Da peptide were compared to the mass-signal intensities of diinosine pentaphosphate, which was used as internal standard. D–F. A549 cells were transduced with lentivirus encoding empty vector or SDC-1 cCTF. D) Efficiency of overexpression was controlled by quantitative PCR with primers annealing to the C-terminus of SDC-1 allowing to detect both endogenous SDC-1 and overexpressed cCTF mRNAs expressed in relation to GAPDH mRNA. E) Mass-signal intensities of syndecan-1 cCTF expressing cells or empty vector control were analyzed by quantitative MALDI-TOF/TOF. F) A549 cells transduced with syndecan-1 cCTF or empty control virus were subjected to microarray gene expression analysis. Results are shown as volcano plot in which each tested gene is indicated as a dot. The x-axis represents the log2 value of fold change in gene expression between the two groups and the y-axis indicates the negative log10 raw p-value for this difference. Areas top left and top right represent the genes which are up-/down-regulated more or equal to log2 1.3 with a p-value lower than 0.05. Data are shown as representative plots and means + SD calculated from three independent experiments. Statistically significant differences compared to the respective control are indicated by asterisks (p < 0.05).
