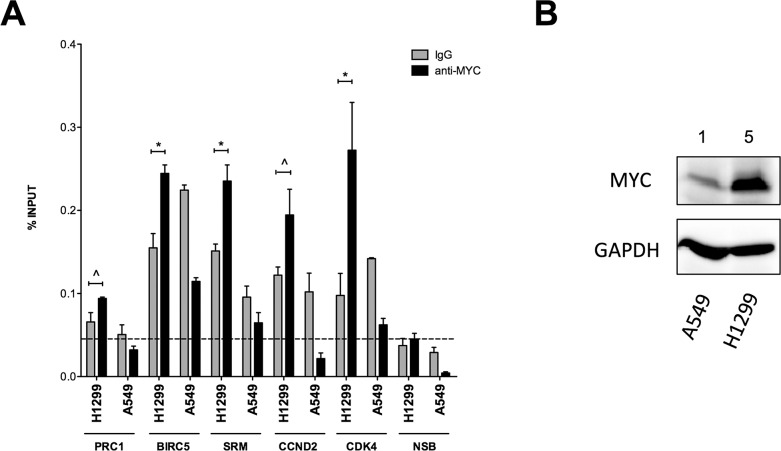
Figure 8. Occupancy analysis of newly established MYC target genes.
A. qPCR quantification of immuno-precipitated DNA fragments from H1299 and A549 Non-Small Cell Lung Cancer (NSCLC)-derived cell lines. Chromatin sheared sections samples were subjected to overnight incubation with anti-MYC monoclonal antibody (black bars) or mouse normal IgG (grey bars). Enriched DNA fragments were analyzed by qPCR using primers specifically located in the promoter regions of putative MYC target genes. CCND2 and CDK4 served as positive control and two loci within CCNB2 and ACTB were used as negative controls. Results were pooled and averaged and are denoted as NSB (NSB = non-specific binding). The level of non-specific occupancy for the H1299 samples is marked as indicated by the dashed line. Plotted are the average occupancy levels expressed as percentage of total input signals. Error bars represent the standard errors of three technical replicates. ^ = p < 0.05; * = p < 0.01. B. Western blotting of endogenous MYC in H1299 and A549 cells. Immuno-reactive bands are representative for one of two independent biological replicates. GAPDH protein detection was used as loading control. Numbers above the panels indicate the relative amount of MYC protein in the two NSCLC-derived cell lines.

