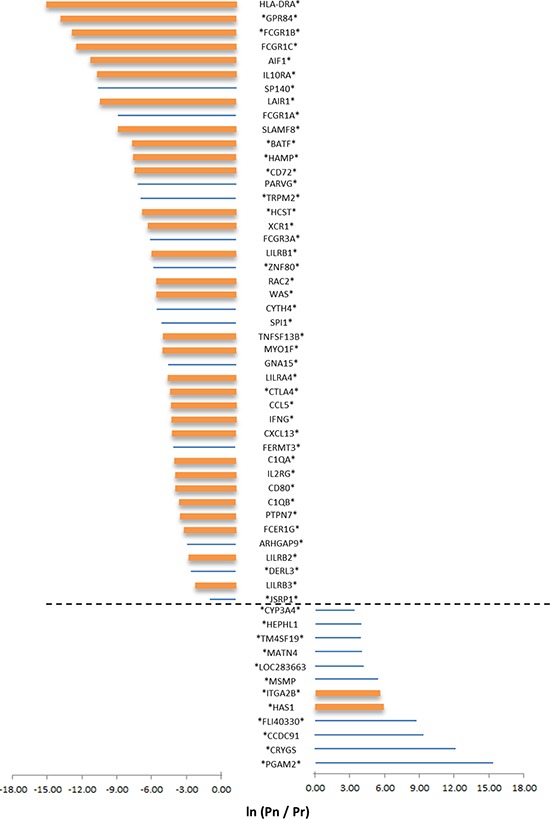
Figure 4. The impact of normalization on the prognostic power of gene expression.

Selected results are shown for genes from the CVRlow group for which a statistical difference in survival curves between patients with low or high expression value of the genes are observed, either in the normalized or in the raw expression data. Genes were further selected by choosing only genes with a large difference in survival (as reflected in the p-value of the log-rank test for difference in survival curves). Only genes for which the LOD is ≥ 2 or ≤ −2 were selected. Pn = the p-value of the log-rank test with normalized data; Pr = the p-value of the log-rank test for the raw dataset. Significant differences in survival, after multiple testing corrections, using the normalized or non-normalized expression values, is indicated by an asterisk (on the left for normalized data and on the right for raw data). Bar size represents the LOD value; bar color represents immune annotation of the gene (orange = annotated as immune related).
