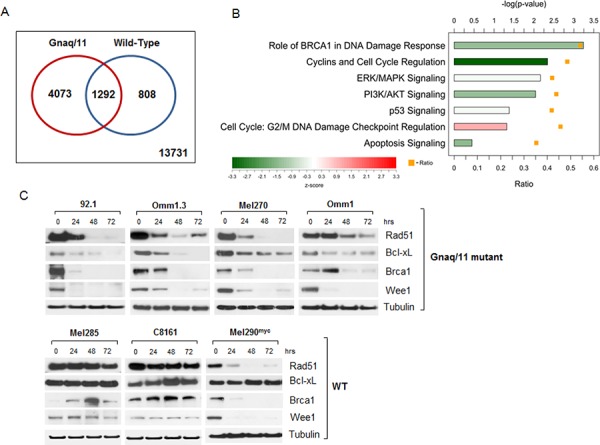
Figure 3. Microarray analysis of JQ1-treated cells reveals expression changes of numerous genes involved in signaling pathways, apoptosis and DNA repair.

A. Venn-diagram summarizing differentially expressed genes in JQ1-treated Gnaq/11-mutant cell lines (red circle), and WT cells (blue circle), with corresponding overlapping genes as indicated. Data is deposited at GEO accession no. GSE66048. B. Ingenuity Pathway Analysis for genes differentially expressed in Gnaq/11-mutant cells in response to treatment. The bars show the −log(p-value) from a Fisher's Exact Test for enrichment, and the color indicates the z-score for the pathway. The orange squares indicate the ratio of differentially expressed genes in the pathway that were differentially expressed in the mutant cell lines. C. Immunoblot analysis of UM cells with Gnaq/11 mutations (top panel) or without the mutations (WT, lower panel) treated with 500 nM JQ1 over time, using antibodies against the indicated proteins. Each blot is representative of at least 2 experiments showing same results.
