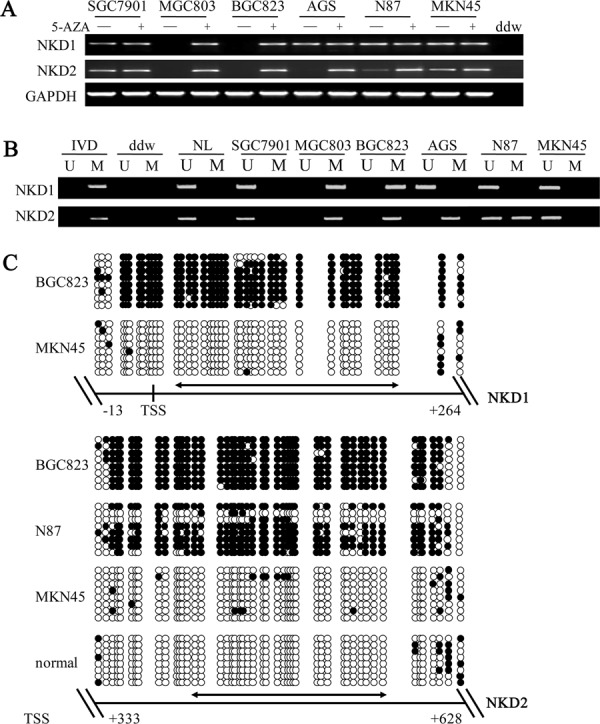
Figure 1. The expression of NKD1 and NKD2 and their methylation status in human gastric cancer cells.

A. Semi-quantitative RT-PCR shows NKD1 and NKD2 expression levels in gastric cancer cell lines. SGC7901, MGC803, BGC823, AGS, N87 and MKN45 are gastric cancer cell lines. 5-AZA: 5-aza-2′-deoxycytidine; GAPDH: internal control of RT-PCR; ddw: double distilled water. (−): absence of 5-AZA; (+): presence of 5-AZA. B. MSP results of NKD1 and NKD2 in gastric cancer cell lines. U: unmethylated alleles; M: methylated alleles; IVD: in vitro methylated DNA, serves as methylation control; NL: normal peripheral lymphocytes DNA, serves as unmethylation control; ddw: double distilled water. C. BSSQ results of NKD1 in BGC823 and MKN45 cells and NKD2 in BGC823, N87, MKN45 cells and normal gastric mucosa. Upper portion of double-headed arrow: MSP PCR product size was 194 bp in NKD1 and bisulfite sequencing focused on a 277 bp region of the CpG island (from −13 to +264) around the NKD1 transcription start site. Lower portion of double-headed arrow: MSP PCR product spanned 166 bp in NKD2. Bisulfite sequencing focused on a 295 bp region of the CpG island (+333 bp to +628 bp) downstream of the NKD2 transcription start site. Filled circles: methylated CpG sites, open circles: unmethylated CpG sites. TSS: transcription start site; normal: normal gastric mucosa.
