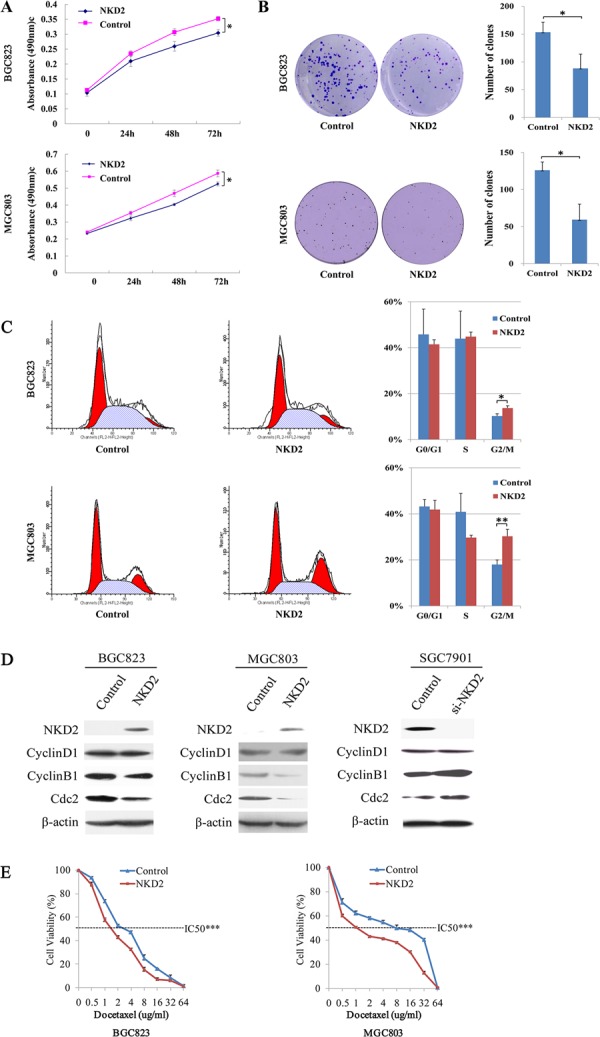
Figure 3. NKD2 induced G2/M phase arrest and sensitized BGC823 and MGC803 cells to docetaxel.

A. Growth curves represent the cell viability analyzed by the MTT assay in NKD2 re-expressed and unexpressed BGC823 and MGC803 cells. Each experiment was repeated in triplicate. *P < 0.05. B. Colony formation results show that colony number was reduced by re-expression of NKD2 in BGC823 and MGC803 cells. Each experiment was repeated in triplicate. Average number of tumor clones is represented by bar diagram. *P < 0.05. C. Cell phase distribution in NKD2 unexpressed and re-expressed BGC823 and MGC803 cells. The ratio is presented by bar diagram. Each experiment was repeated for three times. *P < 0.05, **P < 0.01. D. The expression of NKD2, CyclinD1, CyclinB1 and Cdc2 was detected by western blot in NKD2 unexpressed and re-expressed BGC823 and MGC803 cells. Knockdown of NKD2 in SGC7901 cells was used to validate the results. β-actin: internal control. E. The cell viability assay showed the effect of NKD2 on the sensitivity of BGC823 and MGC803 cells to docetaxel. ***P < 0.001.
