
Figure 6. Phylogenetic reconstruction of LTR from CRC-specific, silent, constitutively expressed and gonads-specific loci.
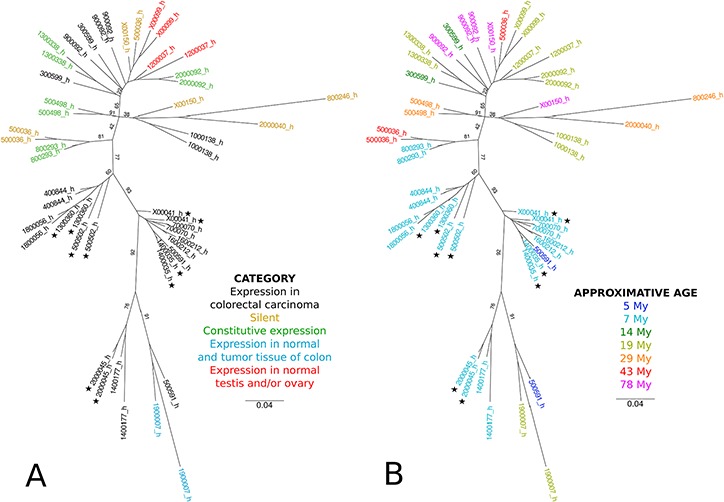
LTR were aligned using Muscle [46]. Phylogeny was reconstructed by maximum likelihood using PhyML and optimized parameters (see Materials and methods) [47]. Values on branches indicate bootstrap supports (computed on 100 replicates). Stars indicate loci that were validated in the clinical cohort by qRT-PCR. The scale bar represents the average number of substitutions per site. LTR were colored according to A. the category of the locus or B. according to its approximate age.