
Figure 4. Polysome profiles of MOLM16 AML cells treated with AZD1208 and/or AZD2014.
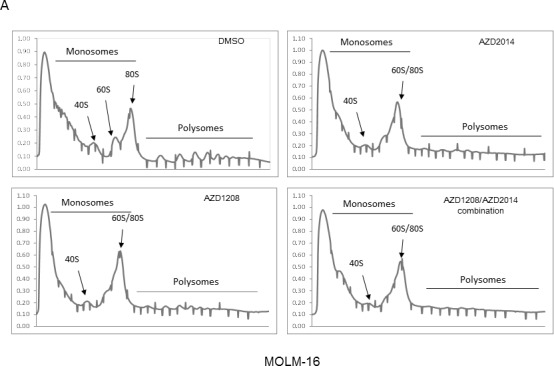
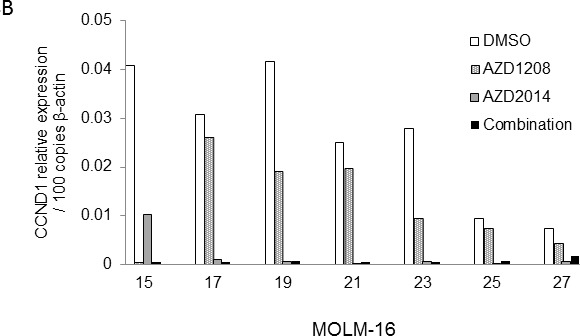
A. (i) Representative polysome profiles identified by velocity separation of translation complexes in linear sucrose gradients of MOLM-16 cells treated with DMSO (control), 2 μM AZD1208, 1 μM AZD2014, or the combination. (ii) The area under the curve for MOLM-16 cells was quantified by Image J software. B. qRT-PCR analysis of CCND1 mRNA associated with polysomal fractions 15-27 in MOLM-16, normalized against DMSO treatment as indicated.