Abstract
Bipolar disorder is a complex neuropsychiatric disorder that is characterized by intermittent episodes of mania and depression; without treatment, 15% of patients commit suicide1. Hence, it has been ranked by the World Health Organization as a top disorder of morbidity and lost productivity2. Previous neuropathological studies have revealed a series of alterations in the brains of patients with bipolar disorder or animal models3, such as reduced glial cell number in the prefrontal cortex of patients4, upregulated activities of the protein kinase A and C pathways5–7 and changes in neurotransmission8–11. However, the roles and causation of these changes in bipolar disorder have been too complex to exactly determine the pathology of the disease. Furthermore, although some patients show remarkable improvement with lithium treatment for yet unknown reasons, others are refractory to lithium treatment. Therefore, developing an accurate and powerful biological model for bipolar disorder has been a challenge. The introduction of induced pluripotent stem-cell (iPSC) technology has provided a new approach. Here we have developed an iPSC model for human bipolar disorder and investigated the cellular phenotypes of hippocampal dentate gyrus-like neurons derived from iPSCs of patients with bipolar disorder. Guided by RNA sequencing expression profiling, we have detected mitochondrial abnormalities in young neurons from patients with bipolar disorder by using mitochondrial assays; in addition, using both patch-clamp recording and somatic Ca2+ imaging, we have observed hyperactive action-potential firing. This hyperexcitability phenotype of young neurons in bipolar disorder was selectively reversed by lithium treatment only in neurons derived from patients who also responded to lithium treatment. Therefore, hyperexcitability is one early endophenotype of bipolar disorder, and our model of iPSCs in this disease might be useful in developing new therapies and drugs aimed at its clinical treatment.
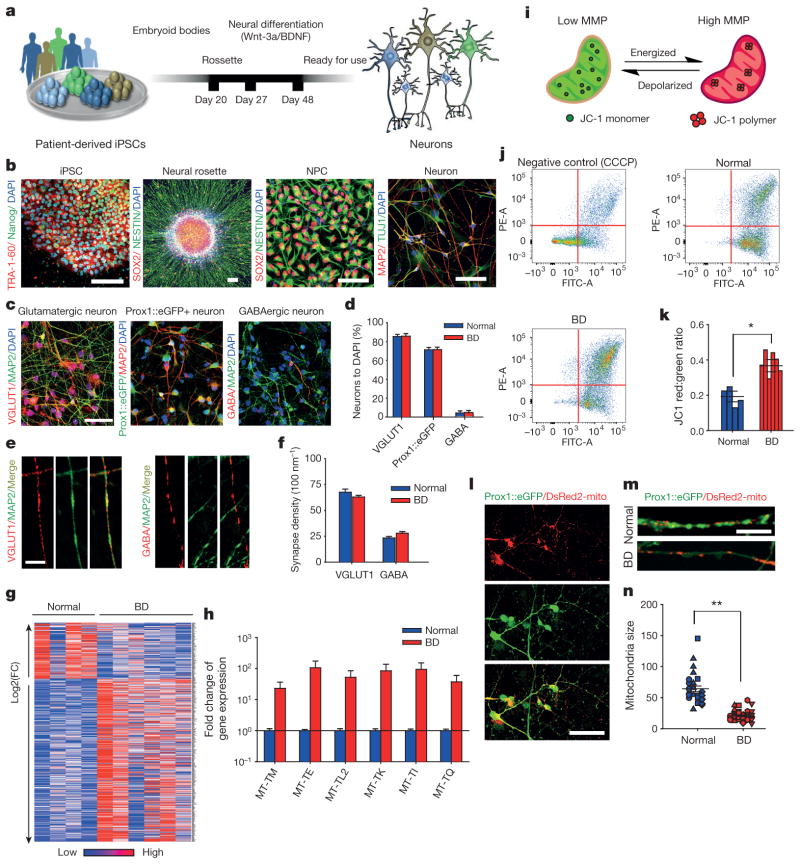
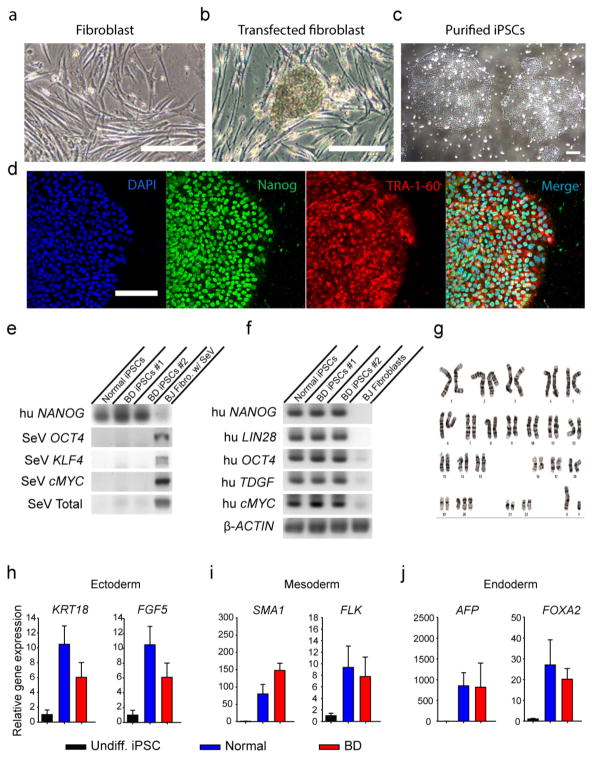
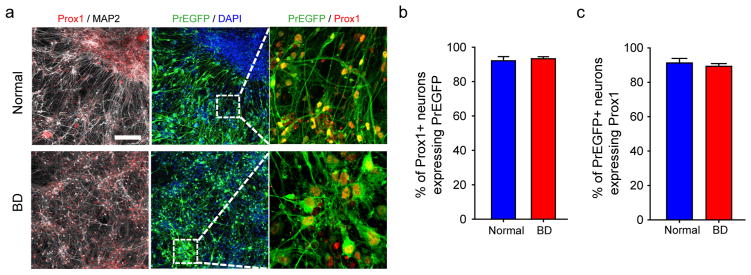
We collected and reprogrammed fibroblasts of six patients with manic type I bipolar disorder (BD) and four unaffected individuals using recombinant Sendai viral vectors expressing the four Yamanaka factors12 (Extended Data Fig. 1a–c). On the basis of a series of quality control examinations, we selected two clones from each individual for functional experiments (Extended Data Fig. 1d–j). The hippocampus of patients with BD often shows a reduced number of neurons13,14, indicating that hippocampal neurons probably exhibit cellular phenotypes of BD. We therefore differentiated the iPSCs into hippocampal dentate gyrus (DG) granule cell-like neurons using a newly reported protocol15 (Fig. 1a, b). More than 80% of the differentiated cells were VGLUT1-positive glutamatergic neurons, most of which were DG granule cell-like neurons that could be identified by a Prox1 promoter-driven lentiviral vector expressing enhanced green fluorescent protein (eGFP) (Prox1::eGFP) or an anti-Prox1 antibody15; only 2–7% cells were GABAergic (γ-aminobutyric-acid-releasing) neurons (Fig. 1c, d and Extended Data Fig. 2). Normal and BD neurons showed similar densities of glutamatergic and GABAergic synapses (Fig. 1e, f).
Figure 1. Hippocampal DG granule cell-like neurons derived from patients with BD show gene expression and mitochondrial abnormalities.
a, Schematic: generation of DG-like neurons from BD iPSCs.
b, Immunostainings of iPSCs for TRA-1–60 and Nanog, neural rosettes and neural progenitor cells for SOX2 and Nestin, and neurons for MAP2 and TUJ1. c, Immunostainings of neurons labelled with VGLUT1, MAP2, Prox1::eGFP and GABA. Scale bars, 50 μm for b and c. d, Quantification of VGLUT1-positive glutamatergic neurons (normal, n = 8; BD, n = 12 lines), Prox1::eGFP-positive DG-like neurons (normal, n = 8; BD, n = 12 lines) and GABAergic neurons (normal, n = 4; BD, n = 12 lines). e, Immunostaining of dendritic glutamatergic synapses and axonal GABAergic synapses. Scale bar, 5μm. f, Quantification of glutamatergic and GABAergic synapse densities (VGLUT1: normal, n = 30 neurons from 8 lines; BD, n = 78 from 12 lines. GABA: normal, n = 30 from 6 lines; BD, n = 88 from 12 lines).
g, Heat map of differential gene expression in normal and BD neurons.
h, Bar graph summarizing differential expression of mitochondrial genes in BD and normal neurons. i, Schematic rationale of JC-1. j, JC-1 flow cytometry graphs showing that, as a control, CCCP diminishes neuronal MMP and that BD neurons have elevated MMP. k, Quantification of elevated MMP in BD neurons compared with normal (normal, n = 8 lines from 4 subjects; BD, n = 12 lines from 6 subjects). l, m, Neurons expressing DsRed2-mito and Prox1::eGFP. Scale bars, 50 μm (l) and 20 μm (m).
n, DsRed2-mito puncta sizes reduced in BD neurons. Identical symbols indicate same subject (normal, n = 29 cells from 8 lines; BD, n = 39 from 12 lines). Student’s t-test, *P < 0.05; **P < 0.001. Bars, mean ± s.e.m.
To assess the genetic factors that distinguish patients with BD from healthy people, we performed total RNA sequencing (RNA-seq) analysis to compare the gene expression profiles between 3-week-old BD and normal neurons (Fig. 1g). Compared with normal neurons, 45 genes were significantly differentially expressed in the diseased neurons, with a P value adjusted for false discovery rate (Padj) of ≤0.1. Strikingly, we found that the expression of multiple mitochondria genes was significantly enhanced in the BD neurons (Fig. 1h). Clinical studies have revealed that people with mitochondrial cytopathies harbour a high risk of psychiatric disorders, including BD16,17. Hence, we investigated the mitochondrial function in young DG-like neurons by measuring the mitochondrial membrane potential (MMP) using the JC-1 assay (Fig. 1i). Flow cytometry analysis revealed that BD neurons showed increased red/green ratios, indicative of enhanced mitochondrial function (Fig. 1j, k and Extended Data Fig. 3a), a finding that is in line with the upregulated mitochondrial gene expression. We next measured the size of neuronal mitochondria, which was represented by the area of DsRed2-mito puncta (Fig. 1l). Compared with normal neurons, the young BD neurons had smaller mitochondria (Fig. 1m, n and Extended Data Fig. 3b). It has been suggested that microtubule-based transport of mitochondria interacts with their dynamics (fusion/fission; morphology or size) and MMP18. Moreover, neuronal activity is increased with fast mitochondrial transport and vice versa19. Thus, the smaller size and higher MMP of mitochondria in BD neurons probably assist their transport, which might lead to enhanced neuronal activity.
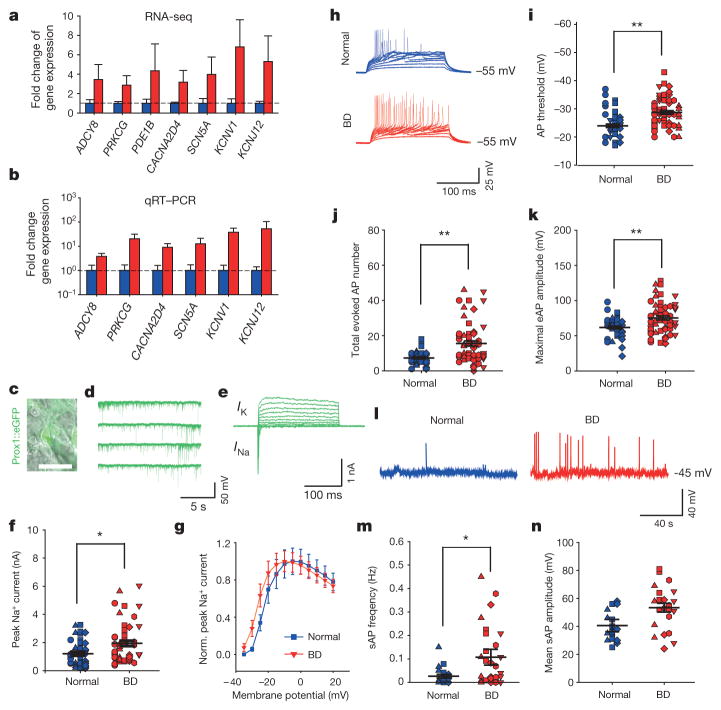
To explore the possible fold change of the mitochondrial alterations in the BD neurons, we expanded our standard of RNA-seq analysis to |log2(fold change)|≥1 and P ≤ 0.05. We found that 1,005 genes were significantly upregulated and 153 genes were downregulated in the BD neurons compared with controls (Fig. 1g). Kyoto Encyclopedia of Genes and Genomes (KEGG) analysis revealed that the Ca2+ signalling and neuroactive ligand–receptor interaction pathways were significantly altered (Supplementary Table 1). Gene ontology (GO) analysis suggested that genes involved in the protein kinase A and C (PKA/PKC) signalling pathways and the action potential (AP) firing system were upregulated (Fig. 2a and Supplementary Tables 2 and 3). These observations were verified using quantitative reverse transcription PCR (qRT–PCR) analysis on representative genes (Fig. 2b). Given the facts that enhanced mitochondrial function provides an extra energy resource for AP firing and that upregulation of the PKA/PKC pathways can enhance AP firing20–22, it is likely that AP firing efficiency is altered in BD.
Figure 2. Hippocampal neurons derived from patients with BD show hyperexcitability.
a, b, Average expression of representative genes involved in the PKA/PKC and AP firing systems revealed by RNA-seq (a) and qRT–PCR (b) analysis (normal, n = 4; BD, n = 6 lines). c–e, Patch-clamp recording on Prox1::eGFP-expressing DG-like neurons (c) showed spontaneous postsynaptic currents (d) and Na+/K+ currents (e). Scale bar, 20 μm. f, Average peak values of Na+ currents during stepwise depolarization (normal, n = 40 neurons from 8 lines; BD, n = 52 from 12 lines). g, Normalized average Na+ currents at different membrane potentials. h–k, Sample trace (h), average firing threshold (i), average total number (j) and maximal amplitude (k) of APs evoked during 300 ms stepwise depolarization. Identical symbols indicate same subject (for AP threshold: normal, n = 39 neurons from 8 lines; BD, n = 55 from 12 lines; for total AP number: normal, n = 39 from 8 lines; BD, n = 58 from 12 lines; for maximal amplitude: normal, n = 39 from 8 lines; BD, n = 57 from 12 lines). l–n, Sample trace (l), average frequency (m) and mean amplitude (n) of spontaneous APs (for AP frequency: normal, n = 29 neurons from 6 lines; BD, n = 30 from 8 lines). Student’s t-test, *P < 0.05; **P < 0.001. Bars, mean ± s.e.m.
We therefore performed patch-clamp recording experiments to compare the AP firing patterns of BD and normal iPSC-derived, 3-week-old Prox1::eGFP-labelled DG-like neurons, which had normal synaptic transmission (Fig. 2c, d). Compared with the control neurons, BD neurons exhibited greater activation of Na+ channels, lower AP threshold and greater values of evoked AP number and maximal AP amplitude (Fig. 2e–k and Extended Data Fig. 3c–f). Further analysis of spontaneous AP firing revealed that the BD neurons showed higher AP frequencies (Fig. 2l–n and Extended Data Fig. 3g). These observations are consistent with the RNA-seq and qRT–PCR results. Although an enhanced expression of K+ channel subunits was also detected, our patch-clamp recording results did not show any significant changes in the K+ currents (Extended Data Fig. 4). Given the fact that K+ channel subunits are often overexpressed in epilepsy as a compensatory response, the upregulated K+ channel subunit expression in the BD neurons is probably a homeostatic change by which the neurons attempt to counteract their hyperactivity.
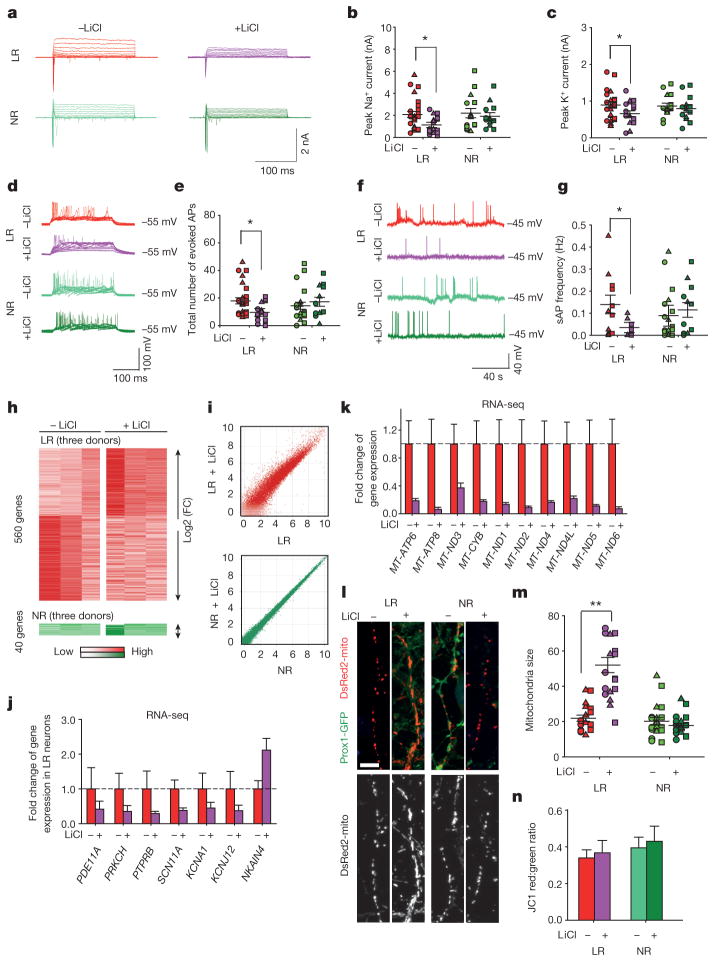
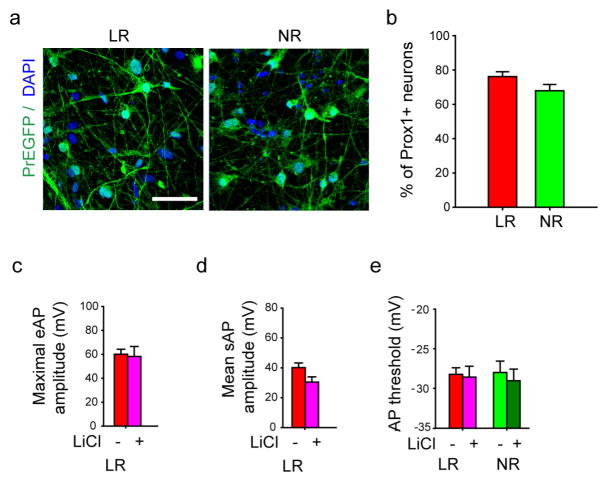
To test the suitability of our BD iPSC model for studying new clinical therapies and drugs, we next set out to investigate the consistency of the hyperactivity phenotype shown in the BD patient-derived neurons with the clinical defects of the patients. Clinically, lithium (Li) has been widely used to treat BD mania. In our study, the recruited subjects included three Li-responsive (LR) and three Li non-responsive (NR) patients (Supplementary Table 4). LR and NR patient-derived neurons exhibited similar percentages of Prox1-positive DG-like cells (Extended Data Fig. 5a, b). Hence, while we were comparing the electrophysiological activity of the BD and normal cells, we also investigated the effects of Li on the activity of the two subgroups of BD neurons in parallel, using 1-week chronic application of 1 mM LiCl. In 3-week-old neurons derived from LR patients, Li significantly reduced Na+/K+ currents (Fig. 3a–c), the total number of evoked APs (Fig. 3d, e) and the frequency of spontaneous APs (Fig. 3f, g), whereas the AP amplitudes and threshold remained unaffected (Extended Data Fig. 5c–e). In contrast, Li failed to induce any obvious changes in the NR neurons; however, NR neurons could be affected by the anti-epileptic drug lamotrigine (Extended Data Fig. 6). These results indicated that the hyperactivity of the DG-like neurons that were derived from clinically Li-responsive patients could be selectively diminished by Li treatment. Therefore, the neuronal hyperactivity revealed by our BD iPSC model is directly associated with the clinical symptom of mania in the patients with BD.
Figure 3. Li rescues hyperexcitability in hippocampal neurons derived from iPSCs of patients with BD.
a, Na+/K+ currents recorded from BD LR and NR neurons with and without Li. b, c, Effects of Li on average peaks of Na+ currents (b) and K+ currents (c) in the LR and NR neurons. Identical symbols indicate same subject (LR without Li, n = 26 neurons from 5 lines; with Li, n = 19 from 5 lines). d, Representative traces of APs evoked during 300 ms stepwise depolarization periods. e, Scatter graph showing Li-induced decrease in the average total AP number of the LR neurons (LR without Li treatment, n = 27 neurons from 5 lines; with Li treatment, n = 18 from 5 lines). f, Representative traces of spontaneous APs. g, Spontaneous AP firing frequency in Li-treated LR neurons (LR without Li, n = 11 neurons from 3 lines; with Li, n = 10 from 3 lines). h, i, Heat maps (h) and MA plots (i) showing effects of Li treatment on gene expression in LR and NR neurons. j, k, Effects of Li on the average expression of representative PKA/PKC/AP (j) and mitochondrial genes (k) in the LR neurons (with Li, n = 3; without Li, n = 3 lines). l, m, Sample images of neurons (l) and bar graph (m) showing the effects of Li treatment on mitochondria morphology. Scale bar, 10 μm (n = 19 neurons from 6 lines). n, No effects of Li treatment on MMP of the BD neurons (n = 6 lines for each group). Student’s t-test, *P < 0.05; **P < 0.001. Bars, mean ± s.e.m.
To explore the mechanisms that might underlie the Li-caused reduction of neuronal activity in the LR neurons, we performed RNA-seq analysis of Li-treated neurons. We found that, in the NR neurons, 40 genes were changed by the Li treatment; in sharp contrast, 560 genes in the LR neurons were significantly affected, of which 238 were upregulated and 322 were downregulated (Fig. 3h, i). Hence, Li can specifically affect the gene expression profiles of the LR neurons. Further analysis revealed that Li rescued 84 genes in the LR neurons to varying degrees, including the gene(s) that are probably key for the BD pathology and Li response, and thus could potentially be used to develop DNA predictor systems. Of these 84 genes, those involved in the PKA/PKC pathways and AP firing, such as PDE11A, PRKCH, PTPRB and SCN11A, as well as multiple mitochondria-related genes, were significantly downregulated, and the Na+/K+ ATPase pathway gene NKAIN was upregulated (Fig. 3j, k), indicating the attenuation of the PKA/PKC pathways, AP firing system, and mitochondrial functions. Indeed, Li partly rescued mitochondrial dysfunction by increasing the mitochondria size in 3-week-old LR neurons, whereas the MMP remained unaffected (Fig. 3l–n). It thus appears conceivable that Li diminishes hyperactivity of the LR neurons through reversing aberrant gene expression related to these pathway(s). In addition, we found that the expression of K+ subunits (KCNA1, KCNJ12) was also significantly downregulated in response to the Li treatment (Fig. 3j), probably because of a neuronal homeostatic response to the loss of neuronal activity.
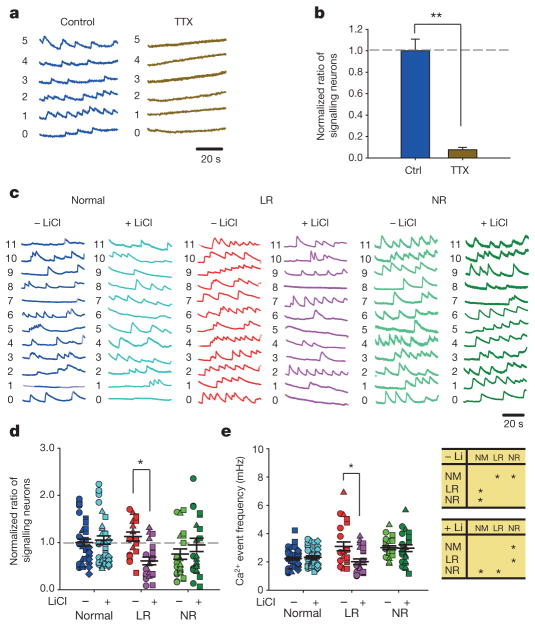
We next tested whether the enhanced excitability of single neurons could generate neural network hyperactivity through assaying somatic Ca2+ transient events with a calcium indicator, Fluo 4-AM. Ca2+ events were abolished by tetrodotoxin (TTX) (Fig. 4a, b), indicating that they represent APs spreading over the neural network23–25. As Prox1-expressing DG-like neurons accounted for approximately 80% of all neurons in the culture dish (Fig. 1c, d), Ca2+ imaging of synapsin promoter-driven lentiviral vector expressing DsRed (Syn::DsRed)-labelled neurons was able to monitor the activity of the granule cells. Compared with the normal group, the BD LR and NR neural networks both showed a significantly higher frequency of Ca2+ events (Fig. 4c–e). In the LR neural network, Li application resulted in a remarkable reduction both in the Ca2+ event frequency and in the percentage of signalling neurons (Fig. 4d, e and Extended Data Fig. 3g), whereas the BD NR network was unaffected. Interestingly, normal neurons did not show any obvious changes either (Extended Data Fig. 7). In addition, we observed that this hyperexcitability would reverse when the diseased neurons became old (Extended Data Fig. 8), which may represent an early sign of the reported loss of mature hippocampal neurons in the BD brain and/or might be associated with the transition of the patients from mania into depression13,14.
Figure 4. Somatic Ca2+ imaging analysis reveals hyperactivity in the neural network formed by the BD iPSC-derived neurons.
a, b, Sample traces (a) and bar graph (b) showing neuronal Ca2+ transients abolished by tetrodotoxin (n =10 images). c, Representative Ca2+ traces in normal, BD LR and NR neurons. d, Effects of Li treatment on the average ratio of neurons exhibiting Ca2+ events. Identical symbols indicate the same subject (n = 23 images from 6 lines). e, Scatter graph (left) and analysis of variance (ANOVA) (right) showing the average Ca2+ event frequencies in normal and BD neurons treated with Li (normal, n = 43 images from 8 lines; LR, n =23 from 6 lines; NR, n = 23 from 6 lines). Student’s t-test (b) and ANOVA (d, e), *P <0.05; **P < 0.001. Bars, mean ±s.e.m.
Previously, hyperexcitability had been observed in the ventral tegmental area dopaminergic neurons and hippocampal DG neurons of BD animal models, and thus was thought to be an endophenotype of this disease26,27. However, it remained unclear whether this phenotype could represent the clinical symptoms of BD. In the present study, we generated iPSCs from the fibroblasts of clinically diagnosed patients with BD and demonstrated that 3-week-old diseased neurons derived from iPSCs exhibited significantly upregulated neuronal activity. Importantly, we found that treating neurons with Li selectively diminished this abnormality only in neurons derived from those patients who were responsive to clinical Li administration. Notably, in a neuronal model of schizophrenia generated by the identical approach15, we did not observe hyperactivity in the diseased neurons (data not shown). Therefore, our findings indicated that neuronal hyperexcitability is specifically associated with the clinical symptoms of patients with BD.
As indicated earlier, patients with BD differ in response to Li; a subset of patients has a very robust response with excellent control of symptoms whereas others do not. This variability in response leads frequently to many years of trial-and-error efforts to identify the optimal medication. Recognition of this differential responsiveness to Li may lead not only to novel treatments but also to DNA or other biomarker predictors of response that can accelerate treatment optimization and provide precision medicine in psychiatry. Using neuronal hyperactivity and Li responsiveness as two indices, we detected correlated changes in the PKA/PKC/AP and mitochondria genes in the BD neurons, indicating that these pathways might be related to neuronal hyperexcitability. Further investigations will be necessary to determine whether mitochondrial alterations and/or PKA/PKC/AP gene expression changes represent a cause or a consequence of the observed hyperexcitability phenotype and to whether the reversal of hyperexcitability represents further progression of the disease.
In summary, the cell-autonomous findings revealed by our BD neuronal model based on iPSC technology represent an important first step in understanding the pathophysiology of BD, improving diagnosis and perhaps developing novel therapeutics for treatment of the disease.
Online Content Methods, along with any additional Extended Data display items and Source Data, are available in the online version of the paper; references unique to these sections appear only in the online paper.
METHODS
Subjects
Patients with type I BD were participants in one of two prospective clinical trials of Li monotherapy for identifying genetic variants predictive of good Li response. These studies included one of Li response in veterans conducted at the University of California, San Diego; the other was the Pharmacogenomics of Bipolar Disorder Study (clinical trial number NCT01272531; Supplementary Table 5). All subjects provided written informed consent and all procedures were approved by local human subjects committees. Subjects were initially screened for eligibility and diagnoses determined using the Diagnostic Interview for Genetic Studies. Subjects were started on Li. Over 4 months they were titrated up to a therapeutic level (1.0 meq dl−1) as tolerated, as other psychotropic medications were gradually discontinued. Subjects were seen at 2- to 4-week intervals and rated for mood symptoms. After 4 months, subjects with a Clinical Global Impressions Scale score of 3 or less, reflecting only mild symptoms, were declared responders, whereas other subjects were deemed non-responders. Li responders were then followed on Li monotherapy for up to 2 years. The responders remained stable for an average of 23 months on Li monotherapy, whereas the non-responders failed to remit from their index episode after an average trial of Li of 3 months. All subjects were white males. The characteristics of these subjects are detailed in Supplementary Table 4. Four-millimetre punch skin biopsies were obtained under sterile conditions from a few centimetres below the iliac crest.
iPSC reprogramming and neuron differentiation
BD and normal iPSCs were derived from fibroblasts using a Cyto-Tune Sendai reprogramming kit (Invitrogen) according to the manufacturer’s instructions. All iPSCs were characterized as previously described28. iPSC colonies were cultured on Matrigel-coated dishes (BD Biosciences) using mTeSR1 medium (StemCell Technologies). Embryoid bodies were formed by mechanical dissociation of iPSC colonies using collagenase and plating onto low-adherence dishes in DMEM/F12 (Invitrogen) supplemented with N2 and B27. For embryoid body differentiation, floating embryoid bodies were treated with DKK1 (0.5 μg ml−1), SB431542 (10 μm), noggin (0.5 μg ml−1) and cyclopamine (1 μm) for 20 days. To obtain neural progenitor cells, embryoid bodies were plated onto polyornithine/laminin (Sigma)-coated dishes in DMEM/F12 plus N2 and B27. Rosettes were manually collected and dissociated with accutase (Chemicon) after 1 week and plated onto laminin-coated dishes in neural progenitor cell media (DMEM/F12, 1× N2, 1× B27 (Invitrogen), 1 μg ml−1 laminin and 20 ng ml−1 FGF2 (Invitrogen)). To obtain mature neurons, neural progenitor cells were differentiated in DMEM/F12 supplemented with 1× N2, 1× B27, 20 ng ml−1 BDNF (Peprotech), 1 mM dibutyrl-cyclicAMP (Sigma), 200 nM ascorbic acid (Sigma), 1 μg ml−1 laminin and 620 ng ml−1 Wnt3a (R&D) for 3 weeks. Wnt3a was removed after 3 weeks. All cells used in the present study were verified as free from mycoplasma contamination.
Generation of lentivirus
Lentivirus was packaged in 293T HEK cells grown in DMEM/F12 (Invitrogen) supplemented with 10% FBS (Gemini). The 293T cells cultured in the 15-cm dish were transfected with a solution consisting of 12.2 μg lentiviral DNA, 8.1 μg MDL-gagpol, 3.1 μg Rev-RSV, 4.1 μg CMV-VSVG, 500 μl of Opti-MEM (Invitrogen) and 110 μl PEI (1 μg ml−1). Medium was changed after 12 h and the virus was harvested at 72 h after transfection.
Immunocytochemistry
Cells were fixed in 4% paraformaldehyde and then permeabilized with 0.25% Triton-X100 in PBS. Cells were then blocked in Tris-Cl buffer solution (TBS) containing 0.25% Triton-X100 and 10% donkey serum for 1 h, followed by incubation with primary antibody overnight at 4 °C. After three washes with TBS, cells were incubated with secondary antibodies for 1 h at room temperature. After three washes with TBS, cells were incubated with DAPI (0.1 μg ml−1, Sigma) for 15 min, followed by three washes with TBS to remove DAPI. Fluorescent signals were detected using a Zeiss 710 laser scanning microscope and images were processed with ZEN 2011, Adobe Photoshop CS5 and ImageJ 1.42 software. The primary antibodies used were mouse anti-TRA-1-60 monoclonal antibody (1:200, Chemicon catalogue number MAB4360), goat anti-Nanog polyclonal antibody (1:200, R&D catalogue number AF1997), goat anti-SOX2 polyclonal antibody (1:250, Santa Cruz catalogue number sc-17320), mouse anti-Nestin monoclonal antibody (1:200, Chemicon catalogue number MAB5326), rabbit anti-TUJ1 polyclonal antibody (1:500, Covance catalogue number PRB-435P), chicken anti-MAP2 polyclonal antibody (1:1,000, Abcam catalogue number ab5392), rabbit anti-VGLUT1 polyclonal antibody (1:200, Synaptic Systems catalogue number ab5392), rabbit anti-GFP antibody (1:500, Invitrogen catalogue number A6455) and rabbit anti-GABA polyclonal antibody (1: 1,000, Sigma catalogue number A2052). The secondary antibodies (Jackson ImmunoResearch Laboratories) used were goat anti-chicken Alexa Fluor 647 (1:500, catalogue number 703-605-155), goat anti-rabbit CY3 (1:500, catalogue number 111-165-003), donkey anti-chicken Dylight 488 (1:500, catalogue number 703-485-155), donkey anti-rabbit CY3 (1:500, catalogue number 711-165-152), donkey anti-rabbit Alexa 488 (1:500, catalogue number 711-545-152), donkey anti-chicken Dylight 549 (1:500, catalogue number 703-505-155), donkey anti-goat Alexa 488 (1:500, catalogue number 705-545-147), donkey anti-mouse CY3 (1:500, catalogue number 715-165-151), donkey anti-goat CY3 (1:500, catalogue number 705-165-147) and donkey anti-mouse Alexa 488 (1:500, catalogue number 715-545-151). All relevant information about the antibodies used in this study, including citation, clone number and antibody validation profile, can be found at the manufacturers’ websites.
RNA extraction, PCR and quantitative RT–PCR
Total cellular RNA was extracted from approximately 5 ×10⁶ cells using the RNA-BEE (Qiagen) according to the manufacturer’s instructions, and reverse transcription was performed using a High Capacity cDNA Synthesis kit (AB Biosystems). PCR was performed using a GoTAQ PCR kit (Fisher Scientific), and PCR products were analysed using agarose gel electrophoresis. Quantitative PCR was done using SyberGreen (Invitrogen), and the results were analysed using SDS3.2 software for a 7900HT real-time PCR system. The primer sequences used are described in Supplementary Table 6.
Somatic calcium imaging
Three-week-old neurons derived from BD and normal iPSCs were previously infected with a synapsin promoter-driven lentiviral vector expressing DsRed (Syn::DsRed). Cell cultures were washed twice with sterile Krebs HEPES Buffer and incubated with 3 μm Fluo 4-AM (Molecular Probes) in Krebs HEPES Buffer for 40 min at room temperature. Excess dye was removed by washing twice with Krebs HEPES Buffer, and cells were incubated for an additional 20 min to equilibrate the intracellular dye concentration and allow de-esterification. Time-lapse image sequences (×100 magnification) of 3,000 frames were acquired at 28 Hz with a region of 336 pixels × 256 pixels using a Hamamatsu ORCA-ER digital camera (Hamamatsu Photonics) with a 488 nm (FITC (fluorescein isothiocyanate)) filter on an Olympus IX81 inverted fluorescence confocal microscope (Olympus Optical). To assess changes in calcium signalling in response to perturbation of neuronal activity, tetrodotoxin (1 μm) was applied by bath application. Images were acquired with MetaMorph 7.7 software (MDS Analytical Technologies). Images were subsequently processed using ImageJ software and custom written routines in Matlab 7.2 software (Mathworks).
Electrophysiology
Neurons were previously infected with the Prox1::eGFP lentiviral vector. Whole-cell patch-clamp recordings were performed from Prox1::eGFP highlighted DG-like neurons after 3 weeks of differentiation. The bath was constantly perfused with an extracellular solution (128 mM NaCl, 5 mM KCl, 2 mM CaCl2, 30 mM glucose, 1 mM MgCl2 and 25 mM HEPES (pH 7.3)). The recording micropipettes (tip resistance 3–6 MΩ) were filled with internal solution (130 mM K-gluconate, 1 mM EGTA, 2 mM Mg-ATP, 0.3 mM Na-GTP, 5 mM Na-phosphocreatine and 10 mM HEPES (pH 7.3)). Recordings were made using Axopatch 200B or 700B amplifier (Axon Instruments). Signals were filtered at 2 kHz and sampled at 5 kHz. The series resistance was typically <15MΩ. For voltage-clamp recordings, the membrane potential was held at −70 mV. To record the sodium and potassium currents, cells were depolarized in 5 mV increments. For current-clamp recordings, a hyperpolarized current was injected into the neuron to a membrane potential of −55 mV or −45 mV, depending on the experiments. Step-depolarized currents with identical parameters were injected into normal and BD neurons to elicit APs. All recordings were performed at room temperature and chemicals were purchased from Sigma.
Mitochondrial assay and flow cytometry
To measure mitochondrial size, Prox1::eGFP and DsRed2-mito were co-expressed in DG-like neurons via lentiviral infection. Neurons were fixed in 4% paraformaldehyde and then permeabilized with 0.1% Triton-X100 in TBS. Cells were then blocked in TBS containing 3% donkey serum for 1 h, followed by incubation with DAPI for 15 min. Fluorescence images were acquired using a high-resolution LSM 710 confocal microscope (Carl Zeiss) and were processed with ZEN 2011 software (Carl Zeiss) and Adobe Photoshop CS5 software (Adobe). The size of the mitochondria (DsRed2-mito puncta) was analysed using the Particle Analysis tool in ImageJ software (National Institutes of Health).
For MMP, neurons were incubated with JC-1 dye (Molecular Probes) at 37 °C for 15–30 min29. The cells were dissociated into single cells using TrypLE (Invitrogen), washed three times and then resuspended in 1 ml warm PBS. Green and red fluorescence of JC-1 dye was quantitated using BD FACSCanto II flow cytometer (Becton, Dickinson). Histogram plots of green and red fluorescence were created to determine the red/green intensity ratio using FlowJo 10 software (TreeStar).
RNA-seq analysis
RNA was prepared into RNA-Seq libraries using an Illumina TruSeq Stranded Total RNA Sample Prep Kit with Ribo-zero Gold (Human/Mouse/Rat) (Illumina). Cytoplasmic and mitochondrial ribosomal RNA was depleted using a Ribo-zero Gold component. Depleted RNA was reverse transcribed into cDNA using SuperScript II reverse transcriptase (Invitrogen). Stranded cDNA sequencing libraries were generated according to Illumina’s procedures. Total RNA-Seq libraries were sequenced paired-end 2 × 100 base pairs (bp) using the Illumina HiSeq 2500 platform according to the manufacturer’s specifications. Low-quality ends and read-through adaptor sequences were trimmed using Cutadapt, version 1.3. The trimmed reads were mapped to the human genome (hg19/GRCh37) using STAR, version 2.3.0. The assignment of reads to gene regions was performed by htseq-count, version 0.5.4p5. These raw counts are taken as input for edgeR package for differential gene expression analysis using the exact and paired Student’s t-test described in the edgeR manual. DAVID (http://david.abcc.ncifcrf.gov/) was used to perform the gene functional annotation analysis. The categories of GO and KEGG pathways were chosen as background databases. All genes of Homo sapiens were used as background gene list. The RNA-seq data have been deposited in NCBI’s Gene Expression Omnibus under accession number GSE58933. The Prox1::eGFP-positive DG-like neurons showed gene expression similar to the whole differentiation culture (Extended Data Fig. 9).
Statistical analysis
No statistical methods were used to predetermine sample size. The experiments were not randomized.
For comparisons of Ca2+ imaging results among the normal, LR and NR groups, the difference was assessed using one-way ANOVA followed by Duncan’s test; the P value was adjusted by Benjamini and Hochberg correction, and an adjusted P value <0.05 was considered as significant. For RNA-seq, the data were analysed using the edgeR package30. For pairwise comparisons, we used quantile- adjusted conditional maximum likelihood methods. The common dispersion was calculated by using the estimateCommonDisp. The exact test is based on quantile-adjusted conditional maximum likelihood methods. Knowing the conditional distribution of the sum of counts in a group, edgeR computes exact P values by summing over all sums of counts that have a probability less than the probability under the null hypothesis of the observed sum of counts. Benjamini and Hochberg’s algorithm is used to control the false discovery rate. We performed paired comparisons to detect gene expression changes in response to Li treatment. This is an additive model with the patient as the blocking factor. For all other experiments, a two-tailed unpaired Student’s t-test was used to determine the statistical significance of observed differences between various conditions. The analysis approaches have been justified as appropriate by previous biological studies, and all data met the criteria of normal distribution. In all experiments, two lines from one patient were prepared, and one or two lines were eventually used for the experiment depending on the status of the cells, such as differentiation and cell density. For most experiments in this study, neurons of all patients and at similar densities were investigated (Extended Data Fig. 10), except that, for recordings of spontaneous AP firing, two patients with BD LR were investigated. The statistical data for each subject are listed in Supplementary Table 7. In the experiments, every cell line had a unique code that could not tell the identity of the subject but could tell which two lines belonged to the same subject, so that the person performing the experiments could use at least one line for each subject without knowing the group category. The collected data were used for statistical analysis without exclusion. All experiments were performed in technical and biological triplicate and were repeated at least three times. The variation within each group of neurons was not pre-estimated and the variation between groups might not be similar. For electrophysiological recording experiments, at least five to six neurons per subject were recorded and statistically analysed without exclusion. For Ca2+ imaging and immunostaining experiments, typically four or five view fields per subject containing several hundred neurons were used without exclusion for analysis. For RNA-seq, qRT–PCR and flow cytometry experiments, all cells in one culture were collected for analysis.
Extended Data
Extended Data Figure 1. Generation of iPSCs from patients with BD and healthy people.
a, Human fibroblasts generated from punch biopsy. b, The iPSC colonies appeared after fibroblasts were reprogrammed using the Sendai virus. c, Purified iPSC colonies were cultured in Matrigel-coated plate. d, Immunostaining of iPSCs with DAPI and pluripotency markers Nanog and TRA-1-60. e, RT–PCR results showing that the introduced Sendai virus genes were cleared from the generated iPSCs. f, RT–PCR results showing that the generated iPSCs expressed human pluripotency markers NANOG, LIN28, OCT4, TDGF and cMYC. g, Representative karyotyping image of generated iPSCs showing normal chromosomal structure. h–j, Bar graphs of quantitative RT–PCR showing that the iPSCs can randomly differentiate into cells expressing the markers for endoderm, mesoderm and ectoderm. Data are representative for a total of 20 iPS cell lines from 10 patients (2 clones per patient). Scale bar, 50 μm. Bars, mean ±s.e.m.
Extended Data Figure 2. Lentiviral transduction of Prox1::eGFP efficiently labels Prox1-positive DG granule cell-like neurons.
a, Sample immunostaining images showing the expression of Prox1 and Prox1::eGFP in the normal and BD neurons. Scale bar, 100 μm. b, Bar graph showing that, both in the normal and in BD groups, more than 90% of Prox1::eGFP-positive neurons express nuclear Prox1 protein. Normal, 92.1 ±2.4%, n = 4 lines; BD, 93.3 ±1.2%, n =12 lines. c, Bar graph showing that, both in the normal and in BD groups, approximately 90% of Prox1-positive DG-like neurons express Prox1::eGFP. Bars, mean ±s.e.m.
Extended Data Figure 3. Bar graphs summarizing the similarity between different cell lines of the same subject and comparison of low and high passage cells.
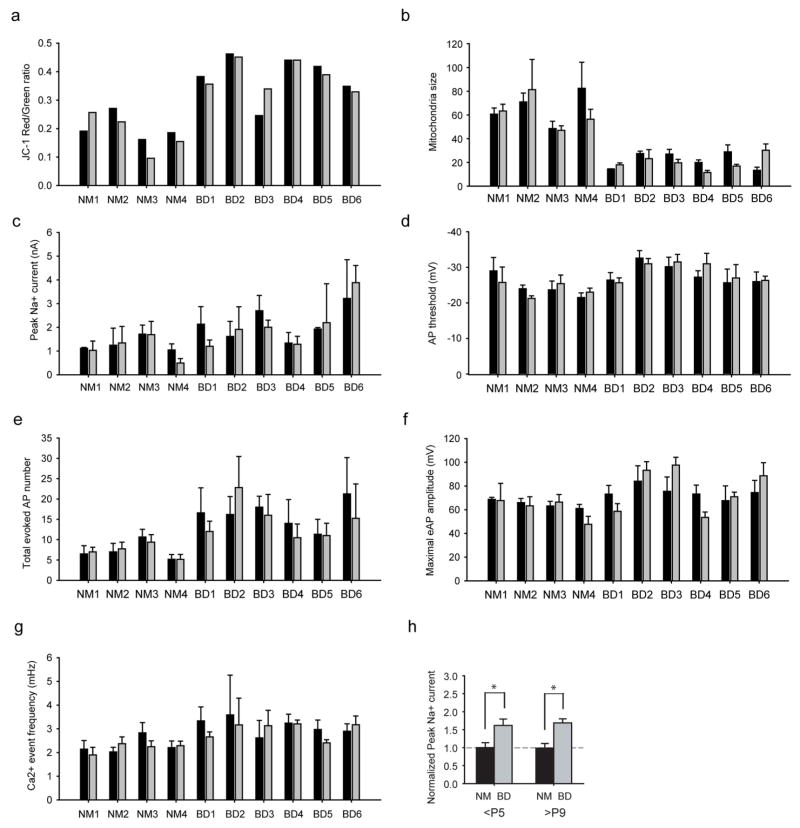
a, b, Bar graph comparing the MMP (n = 20 lines) (a) and mitochondria size (n = 68 images from 20 lines) (b) of different cell lines of one subject. c–f, Electrophysiological recording experiments, including peak Na+ currents (n = 92 neurons from 20 lines) (c), AP threshold (94 neurons from 20 lines) (d), total evoked AP number (n = 97 neurons from 20 lines) (e) and maximal AP amplitude (n = 96 neurons from 20 lines) (f). g, Bar graph comparing the frequency of Ca2+ transient events. Black bar, cell line/clone 1; grey bar, cell line/clone 2 (178 videos from 20 lines). h, Bar graph showing the normalized peak Na+ current in normal (NM) and BD neurons derived from <P5 and >P9 cell lines (P5: normal, n = 40 neurons from 8 lines; BD, n = 52 from 12 lines. P9: normal, n = 11 from 2 lines; BD, n =23 from 5 lines). Student’s t-test, *P < 0.05. Bars, mean ±s.e.m.
Extended Data Figure 4. K+ currents in the BD neurons.
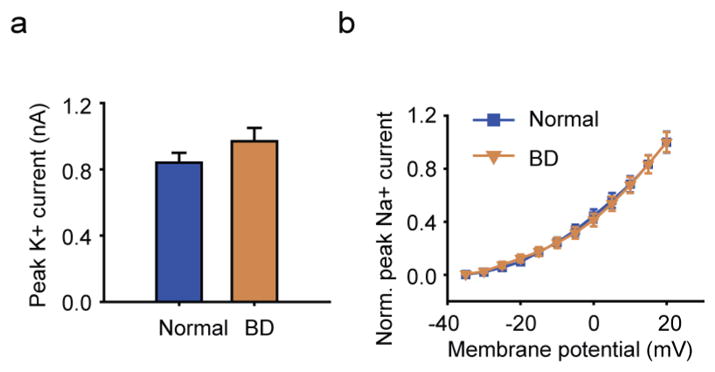
a, Average peak values of K+ currents in the BD and normal neurons. b, Normalized average K+ currents at different membrane potentials (normal, n = 35 neurons from 7 lines; BD, n = 41 from 10 lines). Student’s t-test. Bars, mean ±s.e.m.
Extended Data Figure 5. Prox1:eGFP expression in the BD LR and NR neurons and AP amplitude and threshold of BD neurons.
a, Sample immunostaining images showing the expression of Prox1::eGFP in the BD LR and NR neurons. Scale bar, 50 μm. b, Quantitative analysis revealed a similar percentage of Prox1::eGFP-positive DG-like neurons in the LR and NR groups (n = 32 images from 4 lines). c, d, Bar graphs showing the Li-induced effects in the maximal amplitude of evoked APs (LR without Li treatment, n = 27 neurons from 5 lines; with Li treatment, n = 18 from 5 lines) (c) and mean amplitude of spontaneous APs (LR without Li, n = 11 neurons from 3 lines; with Li, n = 10 from 3 lines) (d) of the LR neurons. e, Bar graph showing that the threshold of AP firing was not changed by Li (LR without Li, n = 11 neurons from 3 lines; with Li, n = 10 from 3 lines). Bars, mean ±s.e.m.
Extended Data Figure 6. AP firing in the BD NR neurons treated with lamotrigine (LTG).
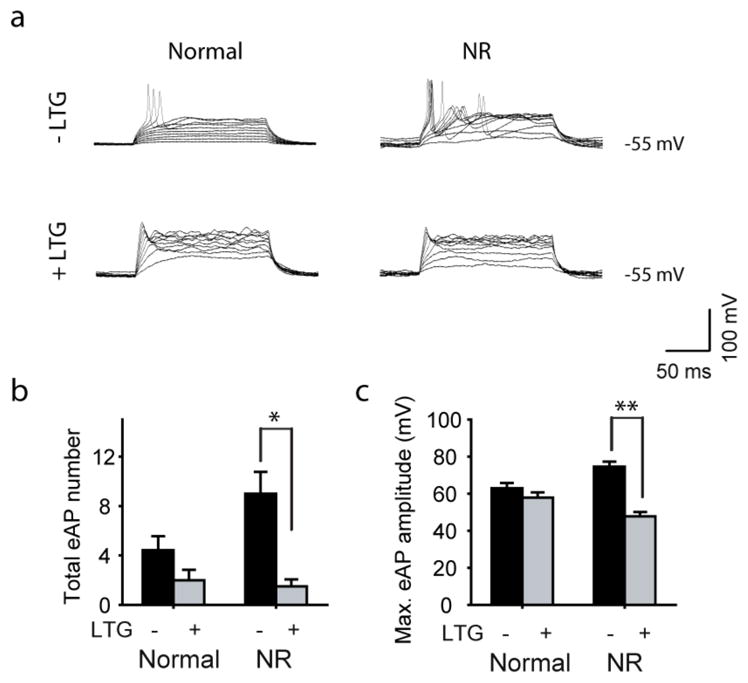
a, Representative traces of APs evoked during 300 ms stepwise depolarization periods in the normal and NR neurons with and without 100 μm lamotrigine treatment. b, c, Bar graphs summarizing the effects of lamotrigine on the total number (b) and maximal amplitude (c) of evoked APs in the normal and BD NR neurons (normal: without lamotrigine, n = 7 neurons; with lamotrigine, n = 8. BD NR: without lamotrigine, n = 5; with lamotrigine, n =6). Student’s t-test, *P <0.05; **P <0.001. Bars, mean ±s.e.m.
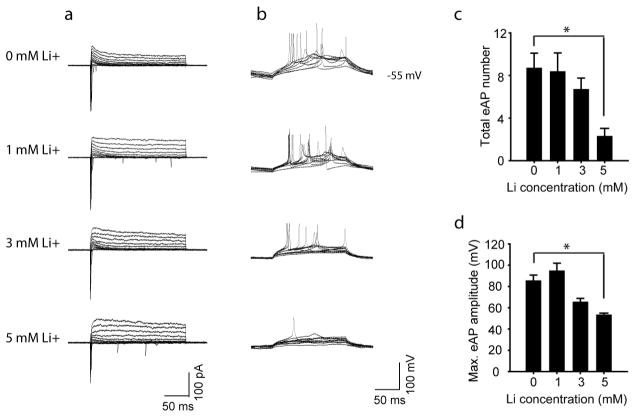
Extended Data Figure 7. Effect of Li on the normal neurons.
a, Representative traces of Na+/K+ currents in the normal neurons treated with Li at different concentrations. b, Representative traces of APs evoked during 300 ms stepwise depolarization periods in the normal neurons treated with Li at different concentrations. c, d, Bar graphs summarizing the effects of different concentrations of Li on the total number (c) and maximal amplitude (d) of evoked APs in the normal neurons (n = 4 neurons). Student’s t-test. *P < 0.05. Bars, mean ±s.e.m.
Extended Data Figure 8. Reversal of hyperexcitability in old BD neurons.
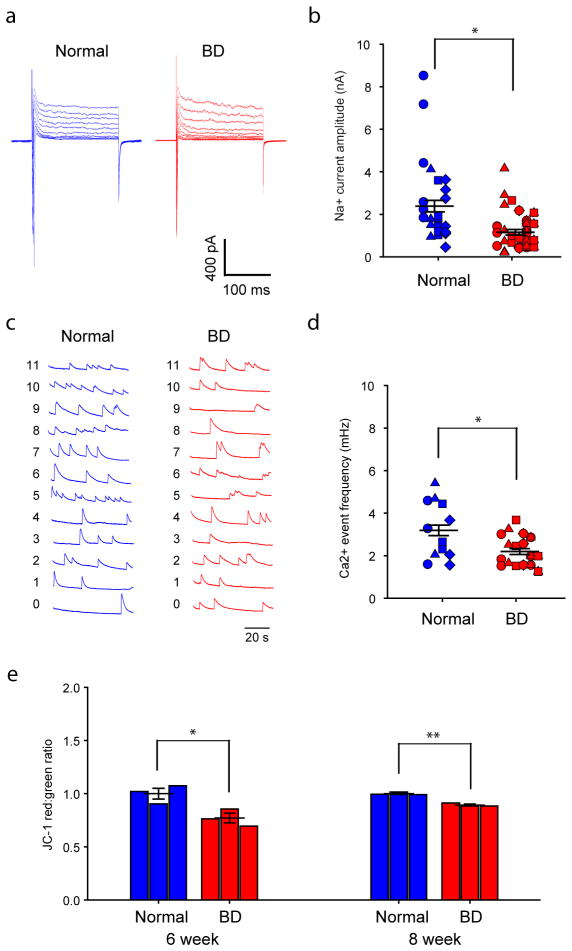
a, b, Sample traces (a) and scatter graph (b) showing that the 8-week-old BD neurons exhibited weaker Na+ currents than the normal neurons (normal, n = 28 neurons from 4 lines; BD, n = 37 from 6 lines). c, d, Sample traces (c) and scatter graph (d) showing that the 8-week-old BD neurons exhibited a lower frequency of Ca2+ transient events than the normal neurons (n =30 videos from 10 patients). e, Scatter graphs showing the MMP of 6- and 8-week-old BD and normal neurons (normal, n = 3 lines; BD, n =3 lines). Student’s t-test, *P <0.05; **P < 0.001. Bars, mean ±s.e.m.
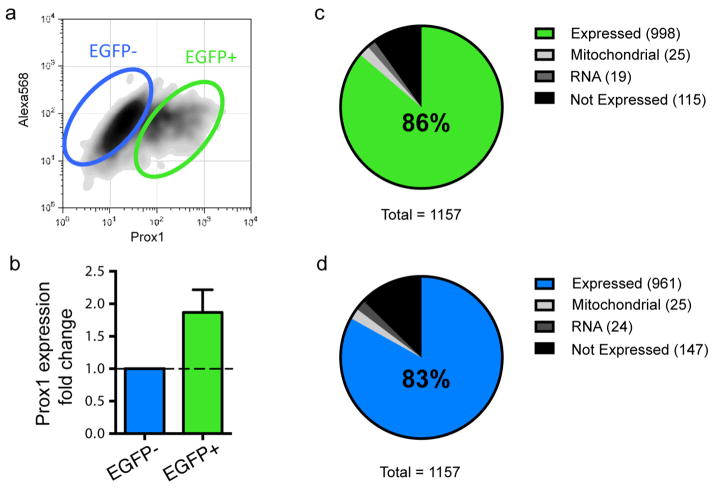
Extended Data Figure 9. The Prox1::eGFP-positive BD cells have similar expression of differentially expressed genes to the whole differentiation culture.
a, Sorting of cells strongly expressing Prox1::eGFP using flow cytometry. b, Bar graph showing that Prox1::eGFP expression is enriched in the selected cells. c, Enrichment of differentially expressed genes in the Prox1 + DG-like neurons (c) and non-DG cells (d) (n = 6 patients). Bars, mean ± s.e.m.
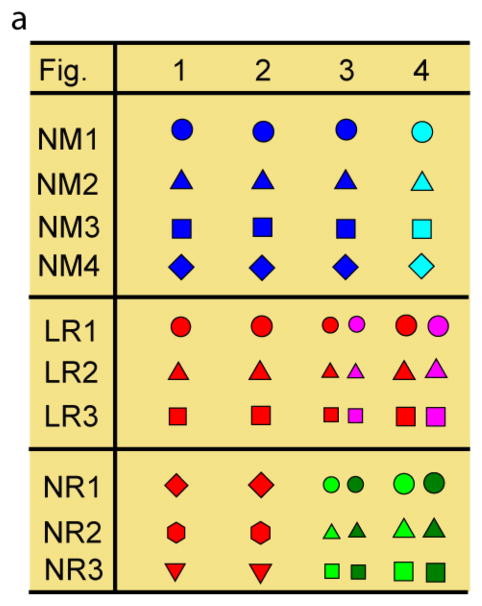
Extended Data Figure 10. Representative icons of the subjects in the figures.
a, Representative icons of the patients with BD and healthy people used in the experiments shown in the figures. Identical symbols indicate the same subject.
Acknowledgments
We thank the patients who participated in this study. We thank M. Ku for help in the RNA-seq analysis, and L. McHenry, D. Lisuk and C. Bardy for help with the somatic Ca2+ imaging experiments. We thank L. Moore, E. Mejia, B. Miller, R. Wright, T. Berggren and S. Lu for technical assistance. We also thank C. O’Connor for help on flow cytometry. This work was supported by the National Natural Science Foundation of China (grant numbers 31471020, 31161120358, 31123004), the National Basic Research Program of China (2015CB910603, 2011CB510106), the Open Project of Key Laboratory of Genomic and Precision Medicine, Chinese Academy of Sciences, by the Engmann Foundation, the JPB Foundation, the Helmsley Trust, the Mather’s Foundation, the Glenn Foundation for Aging Research, by National Institute of Health grant MH106056 (K.J.B.), New York Stem Cell Foundation – Robertson Award (K.J.B.), and by grants/contracts to J.R.K. from the National Institute of Mental Health (U01 MH92758) supporting the Pharmacogenomics of Bipolar Disorder Study and from the Department of Veterans Affairs (5I01CX000363). K.J.B. is a New York Stem Cell Foundation - Robertson Investigator. J.Y. is an Investigator of the Young Thousand Talents Program of China.
Footnotes
Supplementary Information is available in the online version of the paper.
Author Contributions J.M., Q.W.W., K.E.D., L.B., K.J.B., T.J.E. and J.Y. conducted the iPSC reprogramming and differentiation experiments. Q.W.W., B.Y. and J.Y. conducted the electrophysiological recording experiments. J.M., Q.W.W., Y.Z., S.S. and J.Y. conducted immunostaining experiments. D.X.Y., J.M., Q.W.W., B.Y. S.T.S. and J.Y. conducted Ca2+ imaging experiments. Y.K., Q.W.W. and J.Y. performed mitochondrial assays. J.M., S.P., B.Y., J.Z., Y.Z., S.M. and J.Y. conducted RNA-seq and qRT-PCR analysis. J.R.K., J.I.N., J.R.C., K.J.O., M.J.M., P.P.Z., M.A., C.M.N. and the Pharmacogenomics of Bipolar Disorder Study designed and conducted the clinical trial and provided samples from patients. J.Y. designed the experiments with F.H.G. and wrote the manuscript with J.M. and Q.W.W.
The authors declare no competing financial interests.
Readers are welcome to comment on the online version of the paper.
References
- 1.Sharma R, Markar HR. Mortality in affective disorder. J Affect Disord. 1994;31:91–96. doi: 10.1016/0165-0327(94)90112-0. [DOI] [PubMed] [Google Scholar]
- 2.Dusetzina SB, et al. Treatment use and costs among privately insured youths with diagnoses of bipolar disorder. Psychiatr Serv. 2012;63:1019–1025. doi: 10.1176/appi.ps.201100516. [DOI] [PMC free article] [PubMed] [Google Scholar]
- 3.Martinowich K, Schloesser RJ, Manji HK. Bipolar disorder: from genes to behavior pathways. J Clin Invest. 2009;119:726–736. doi: 10.1172/JCI37703. [DOI] [PMC free article] [PubMed] [Google Scholar]
- 4.Andreazza AC, Young LT. The neurobiology of bipolar disorder: identifying targets for specific agents and synergies for combination treatment. Int J Neuropsychopharmacol. 2014;17:1039–1052. doi: 10.1017/S1461145713000096. [DOI] [PubMed] [Google Scholar]
- 5.Chang A, Li PP, Warsh JJ. cAMP-Dependent protein kinase (PKA) subunit mRNA levels in postmortem brain from patients with bipolar affective disorder (BD) Brain Res Mol Brain Res. 2003;116:27–37. doi: 10.1016/s0169-328x(03)00211-0. [DOI] [PubMed] [Google Scholar]
- 6.Bezchlibnyk Y, Young LT. The neurobiology of bipolar disorder: focus on signal transduction pathways and the regulation of gene expression. Can J Psychiatry. 2002;47:135–148. doi: 10.1177/070674370204700203. [DOI] [PubMed] [Google Scholar]
- 7.Wang H, Friedman E. Increased association of brain protein kinase C with the receptor for activated C kinase-1 (RACK1) in bipolar affective disorder. Biol Psychiatry. 2001;50:364–370. doi: 10.1016/s0006-3223(01)01147-7. [DOI] [PubMed] [Google Scholar]
- 8.Berk M, et al. Dopamine dysregulation syndrome: implications for a dopamine hypothesis of bipolar disorder. Acta Psychiatr Scand Suppl. 2007;434:41–49. doi: 10.1111/j.1600-0447.2007.01058.x. [DOI] [PubMed] [Google Scholar]
- 9.Mahmood T, Silverstone T. Serotonin and bipolar disorder. J Affect Disord. 2001;66:1–11. doi: 10.1016/s0165-0327(00)00226-3. [DOI] [PubMed] [Google Scholar]
- 10.Scarr E, Pavey G, Sundram S, MacKinnon A, Dean B. Decreased hippocampal NMDA, but not kainate or AMPA receptors in bipolar disorder. Bipolar Disord. 2003;5:257–264. doi: 10.1034/j.1399-5618.2003.00024.x. [DOI] [PubMed] [Google Scholar]
- 11.Du J, Quiroz J, Yuan P, Zarate C, Manji HK. Bipolar disorder: involvement of signaling cascades and AMPA receptor trafficking at synapses. Neuron Glia Biol. 2004;1:231–243. doi: 10.1017/S1740925X05000098. [DOI] [PMC free article] [PubMed] [Google Scholar]
- 12.Takahashi K, et al. Induction of pluripotent stem cells from adult human fibroblasts by defined factors. Cell. 2007;131:861–872. doi: 10.1016/j.cell.2007.11.019. [DOI] [PubMed] [Google Scholar]
- 13.Bertolino A, et al. Neuronal pathology in the hippocampal area of patients with bipolar disorder: a study with proton magnetic resonance spectroscopic imaging. Biol Psychiatry. 2003;53:906–913. doi: 10.1016/s0006-3223(02)01911-x. [DOI] [PubMed] [Google Scholar]
- 14.Deicken RF, Pegues MP, Anzalone S, Feiwell R, Soher B. Lower concentration of hippocampal N-acetylaspartate in familial bipolar I disorder. Am J Psychiatry. 2003;160:873–882. doi: 10.1176/appi.ajp.160.5.873. [DOI] [PubMed] [Google Scholar]
- 15.Yu DX, et al. Modeling hippocampal neurogenesis using human pluripotent stem cells. Stem Cell Rep. 2014;2:295–310. doi: 10.1016/j.stemcr.2014.01.009. [DOI] [PMC free article] [PubMed] [Google Scholar]
- 16.Fattal O, Link J, Quinn K, Cohen BH, Franco K. Psychiatric comorbidity in 36 adults with mitochondrial cytopathies. CNS Spectr. 2007;12:429–438. doi: 10.1017/s1092852900015303. [DOI] [PubMed] [Google Scholar]
- 17.Marazziti D, et al. Psychiatric disorders and mitochondrial dysfunctions. Eur Rev Med Pharmacol Sci. 2012;16:270–275. [PubMed] [Google Scholar]
- 18.Chen H, Chan DC. Mitochondrial dynamics–fusion, fission, movement, and mitophagy–in neurodegenerative diseases. Hum Mol Genet. 2009;18(Suppl R2):R169–R176. doi: 10.1093/hmg/ddp326. [DOI] [PMC free article] [PubMed] [Google Scholar]
- 19.Sun T, Qiao H, Pan PY, Chen Y, Sheng ZH. Motile axonal mitochondria contribute to the variability of presynaptic strength. Cell Reports. 2013;4:413–419. doi: 10.1016/j.celrep.2013.06.040. [DOI] [PMC free article] [PubMed] [Google Scholar]
- 20.Kobayashi M, Sasabe T, Shiohama Y, Koshikawa N. Activation of α1-adrenoceptors increases firing frequency through protein kinase C in pyramidal neurons of rat visual cortex. Neurosci Lett. 2008;430:175–180. doi: 10.1016/j.neulet.2007.10.047. [DOI] [PubMed] [Google Scholar]
- 21.Szulczyk B, Książek A, Ładno W, Szulczyk P. Effect of dopamine receptor stimulation on voltage-dependent fast-inactivating Na+ currents in medial prefrontal cortex (mPFC) pyramidal neurons in adult rats. Acta Neurobiol Exp (Warsz) 2012;72:351–364. doi: 10.55782/ane-2012-1907. [DOI] [PubMed] [Google Scholar]
- 22.Yuan LL, Adams JP, Swank M, Sweatt JD, Johnston D. Protein kinase modulation of dendritic K+ channels in hippocampus involves a mitogen-activated protein kinase pathway. J Neurosci. 2002;22:4860–4868. doi: 10.1523/JNEUROSCI.22-12-04860.2002. [DOI] [PMC free article] [PubMed] [Google Scholar]
- 23.Marchetto MC, et al. A model for neural development and treatment of Rett syndrome using human induced pluripotent stem cells. Cell. 2010;143:527–539. doi: 10.1016/j.cell.2010.10.016. [DOI] [PMC free article] [PubMed] [Google Scholar]
- 24.Yuste R, MacLean J, Vogelstein J, Paninski L. Imaging action potentials with calcium indicators. Cold Spring Harb Protoc. 2011;2011:985–989. doi: 10.1101/pdb.prot5650. [DOI] [PubMed] [Google Scholar]
- 25.Grewe BF, Langer D, Kasper H, Kampa BM, Helmchen F. High-speed in vivo calcium imaging reveals neuronal network activity with near-millisecond precision. Nature Methods. 2010;7:399–405. doi: 10.1038/nmeth.1453. [DOI] [PubMed] [Google Scholar]
- 26.Coque L, et al. Specific role of VTA dopamine neuronal firing rates and morphology in the reversal of anxiety-related, but not depression-related behavior in the ClockΔ19 mouse model of mania. Neuropsychopharmacology. 2011;36:1478–1488. doi: 10.1038/npp.2011.33. [DOI] [PMC free article] [PubMed] [Google Scholar]
- 27.Hagihara H, Takao K, Walton NM, Matsumoto M, Miyakawa T. Immature dentate gyrus: an endophenotype of neuropsychiatric disorders. Neural Plast. 2013;2013:318596. doi: 10.1155/2013/318596. [DOI] [PMC free article] [PubMed] [Google Scholar]
- 28.Brennand KJ, et al. Modelling schizophrenia using human induced pluripotent stem cells. Nature. 2011;473:221–225. doi: 10.1038/nature09915. [DOI] [PMC free article] [PubMed] [Google Scholar]
- 29.Brennand K, et al. Phenotypic differences in hiPSC NPCs derived from patients with schizophrenia. Mol Psychiatry. 2015;20:361–368. doi: 10.1038/mp.2014.22. [DOI] [PMC free article] [PubMed] [Google Scholar]
- 30.Robinson MD, McCarthy DJ, Smyth GK. edgeR: a Bioconductor package for differential expression analysis of digital gene expression data. Bioinformatics. 2010;26:139–140. doi: 10.1093/bioinformatics/btp616. [DOI] [PMC free article] [PubMed] [Google Scholar]


