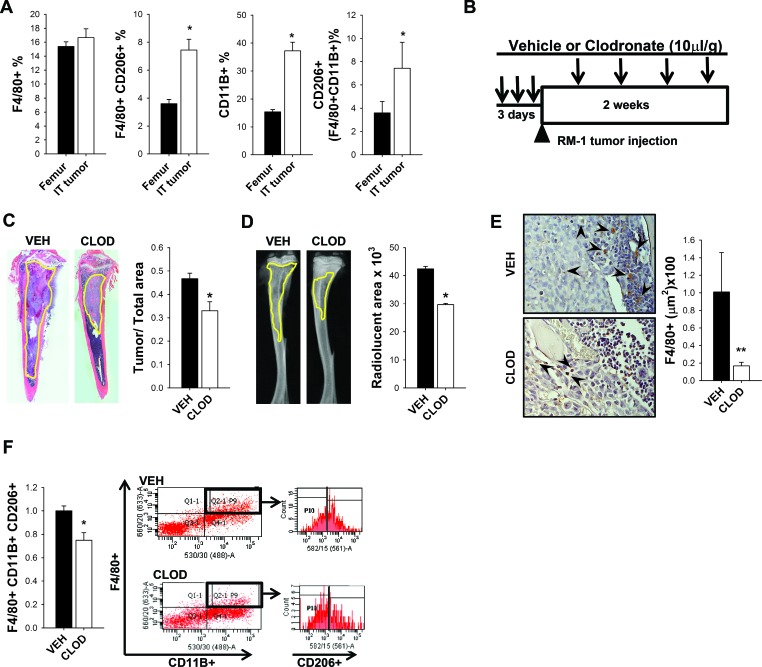
Figure 3. Impact of tumors and clodronate liposomes on macrophages and RM-1 tumor growth in bone.
A. FACS analyses of macrophages (F4/80+), M2 macrophages (F4/80+ CD206+), monocytes (CD11B+) and CD206+ cells gated on F4/80+CD11B+ population in femurs without tumors versus tibiae with intratibial RM-1 tumors in C57Bl6 male mice after 14 days with no macrophage depletion regime. B. Experimental design for macrophage depletion regimen and intratibial tumor growth for 2 weeks. Four-six week old C57Bl6 male mice were treated with 3 consecutive injections of clodronate loaded liposomes (CLOD) (10μl/g) or vehicle (VEH). RM-1 murine prostate cancer cells were injected intratibially on the fourth day and booster injections were given every third day for depletion maintenance. Fourteen days later mice were euthanized and evaluated. C. and D. Histological and radiographic analyses of intratibial RM-1 tumors in vehicle (VEH) and clodronate (CLOD) treated mice. C. Representative image of intratibial RM-1 tumor (yellow) and tumor area/tibia area quantification. D. Representative radiographic image of tibia and radiolucent area (yellow) quantification (mm3). E. F4/80 staining (red-brown) on tibial sections (20X) and quantification. Arrows show F4/80+ cells. F. Flow cytometric analysis and representative plot of the intratibial RM-1 tumors for M2 macrophages (F4/80+ CD11B+ CD206+). Data for figures A, C, D and F are mean ± SEM; n = 18 per group. Data for figure E is mean ± SEM; n 12-13 per group. Statistically significant differences were calculated using unpaired t tests between treatments. *P < 0.05, **P < 0.01 vs. VEH.

