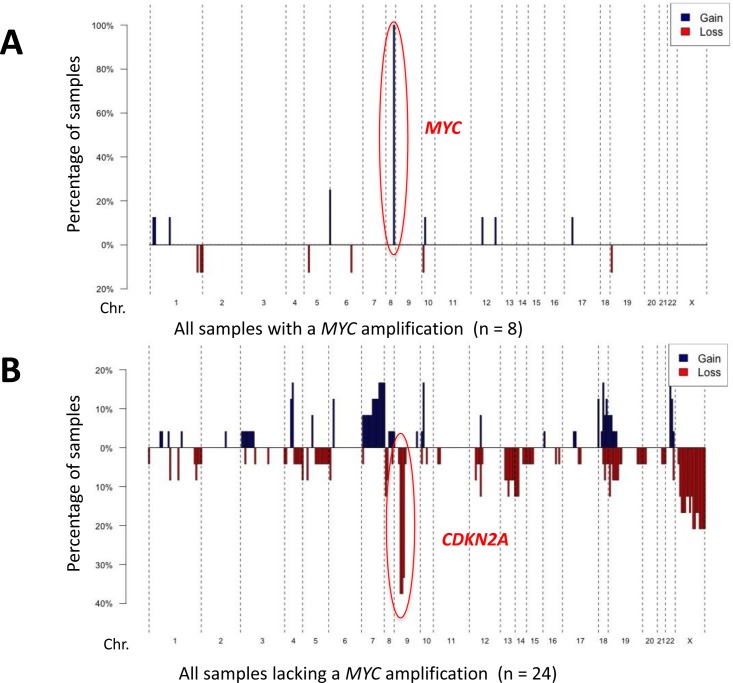
Figure 5. Copy number profiles according to MYC status.
Penetration blots of the samples included in the study grouped according to MYC status. A. penetration blot of tumors samples with a MYC-amplification. B. penetrations blot of tumors lacking a MYC-amplification. A fold change value of < −1.5 was applied as a cut-off for recognizing a loss and > 1.5 for recognizing a gain. Gains are shown in blue, losses in red.

