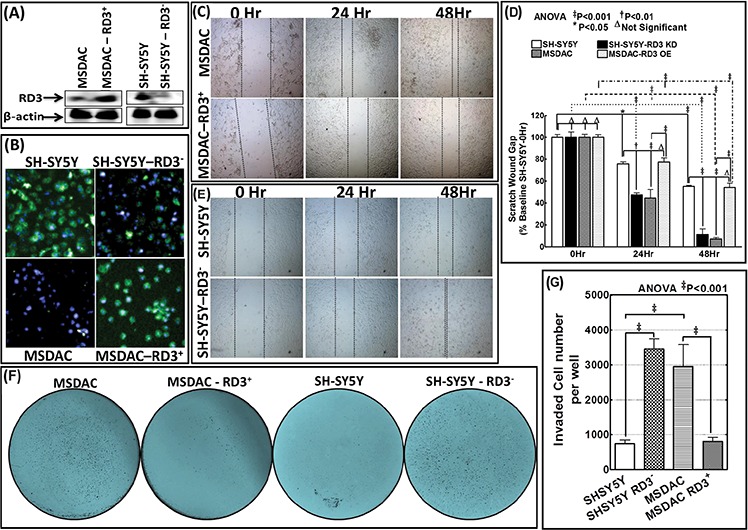
Figure 5. RD3 regulates tumor cell migration and invasion.

A. Representative immunoblots showing the re-expression of RD3 in MSDACs and silencing of RD3 in SH-SY5Y cells. Expression of GFP-tagged RD3 (Origene) was carried out by using TurboFectin 8.0 and RD3 silencing with shRNA (MISSION® shRNA, Sigma-Aldrich) following standard protocols. B. Representative microphotographs acquired from Operetta high-content confocal immunofluorescence imaging validate RD3 silencing in SH-SY5Y cells and RD3 re-expression in MSDACs. C. Scratch-wound-assay showing the cell-migration patterns of MSDACs and RD3-re-expressed MSDACs under proliferation controlled conditions at 0, 24 and 48 h after wound initiation. MSDACs exhibits robust cell migrations with significant wound closure after 48 h, while re-expression of RD3 in MSDACs significantly inhibited their migration. D. Histograms of scratch wound gap measurements (mean and SD) showing the cell migration patterns of MSDACs with and without RD3 re-expression and parental SH-SY5Y cells with and without RD3 silencing examined at 0, 24 and 48 h after wound initiation. Group-wise comparisons were examined by two-way ANOVA with Bonferroni's post-hoc test made using GraphPad PRISM software and a P value of < 0.05 is considered significant. E. Scratch-wound-assay showing the cell-migration patterns of SH-SY5Y cells and RD3-silenced SH-SY5Y cells under proliferation controlled conditions at 0, 24 and 48 h after wound initiation. SH-SY5Y cells exhibited only base-line migrations after 48 h, while silencing RD3 in SH-SY5Y cells consistently increased their migration with significant wound closure. F. Representative microphotographs of matrigel invasion assay showing robust invasion of MSDACs, completely alleviated invasion in RD3-re-expressed MSDACs and profound increase in invasive potential of RD3-silenced SH-SY5Y cells. Invasion assays are performed using BD Matrigel invasion assay following standard protocols. G. Histograms of matrigel invaded cells (mean and SD) showing complete inhibition of MSDACs' invasion potential with RD3 re-expression and significant increase in the invasiveness of RD3-silenced SH-SY5Y cells. Quantification of invaded cells was performed using Image Quant colony count analysis software and the group-wise comparisons were examined by ANOVA with Bonferroni's post-hoc corrections using GraphPad PRISM software. A P value of < 0.05 is considered significant.
