

Abstract
Background and Purpose
Angiotensin AT 2 receptors are upregulated in disease states such as atherosclerosis and blockade of the AT2 receptors exacerbates plaque formation. Direct stimulation of these receptors is anti‐atherogenic but the mechanisms and pathways involved remain unknown. We examined the effect of direct AT2 receptor stimulation with Compound 21 (C21) on the leukocyte adhesion cascade in vitro, right through to plaque formation in vivo.
Experimental Approach
Effects of C21 on TNFα‐induced inflammation were assessed in human umbilical vein endothelial cells (HUVECs), activation of monocytes, polarisation of monocyte‐derived macrophages and in intact mouse aortae.
Key Results
C21 attenuated TNFα‐induced: monocyte adhesion to cultured HUVECs, adhesion molecule expression and abolished TNFα‐induced ROS production. TNFα‐induced NFκB translocation from the cytoplasm to the nucleus, essential for cytokine production, was prevented by C21. C21 did not influence monocyte activation or macrophage polarisation but did reduce TNFα and IL‐6 mRNA expression in M1 macrophages. The anti‐inflammatory effects of C21 were abolished by an AT 2 receptor antagonist confirming that the effects of C21 were AT 2 receptor‐mediated. Also, leukocyte adhesion and cytokine gene expression, induced by high‐fat diet (HFD), was attenuated in ApoE‐/‐ mice treated with C21. Plaque size and stability were improved with C21 treatment with increased smooth muscle cell composition and decreased lipid size, compared with HFD‐saline treated mice.
Conclusion and Implications
C21 prevented TNFα‐induced and HFD‐induced vascular inflammation in vitro and in vivo. Our data provide strong evidence that the anti‐atherosclerotic actions of C21 were due to vascular anti‐inflammatory effects, mediated by AT 2 receptors.
Linked Articles
This article is part of a themed section on Inflammation: maladies, models, mechanisms and molecules. To view the other articles in this section visit http://dx.doi.org/10.1111/bph.2016.173.issue-4
Abbreviations
- ApoE−/−
apolipoprotein E knockout
- C21
compound 21
- HFD
high fat diet
- ICAM
intracellular adhesion molecule‐1
- M1
macrophage type 1
- M2
macrophage type 2
- PPOH
6‐(2‐propargyloxyphenyl) hexanoic acid
- ROS
reactive oxygen species
- SRB1
scavenger receptor class B type 1
Tables of Links
| TARGETS |
|---|
| GPCRs a |
| AT1 receptors |
| AT2 receptors |
| Enzymes b |
| CYP2C |
| NOS |
| Serine palmitoyltransferase |
| Tyrosine phosphatase |
These Tables list key protein targets and ligands in this article which are hyperlinked to corresponding entries in http://www.guidetopharmacology.org, the common portal for data from the IUPHAR/BPS Guide to PHARMACOLOGY (Pawson et al., 2014) and are permanently archived in the Concise Guide to PHARMACOLOGY 2013/14 (a,bAlexander et al., 2013a, 2013b).
Introduction
In atherosclerosis, deletion or pharmacological blockade of the angiotensin AT1 receptor reduces inflammation and plaque formation (Daugherty et al., 2004; Li et al., 2004; Iwai et al., 2005). An equally important consequence of blockade of AT1 receptors is the possibility for increased angiotensin II stimulation of the opposing angiotensin AT2 receptors that mediate anti‐inflammatory effects (Iwai et al., 2005; Rompe et al., 2010) and are up‐regulated in disease states such as atherosclerosis (Sales et al., 2005).
Direct or indirect stimulation of AT2 receptors reduced lesion area (Hu et al., 2008; Tesanovic‐Kljajic et al., 2013) and increased lesion stability, shown by a reduction in lipid deposition and macrophage content and increased collagen content in the plaque (Sales et al., 2005; Hu et al., 2008; Tesanovic‐Kljajic et al., 2013). Further effects of stimulation of AT2 receptors, which may result in an anti‐atherosclerotic effects, are inhibition of inflammatory cytokine gene and protein expression, reported via anti‐oxidant activities and prevention of NF‐κB activation (Hu et al., 2008; Rompe et al., 2010) observed in human and mouse dermal fibroblasts, smooth muscle cells and in the brain (Wu et al., 2004; McCarthy et al., 2009; Rompe et al., 2010). Because the majority of studies examining AT2 receptors are dependent on blockade of AT1 receptors rather than direct stimulation of AT2 receptors, interpretation can be limited as to the exact nature of the role of AT2 receptors. Although direct stimulation of the AT2 receptor in the setting of atherosclerosis has been reported to reduce plaque size and inflammatory cytokine profiles, it is unclear whether these anti‐inflammatory effects following direct AT2 receptor stimulation mediate the anti‐atherosclerotic effects observed.
Plaque progression is initiated by activation of the endothelium, and the consequent activation, recruitment and infiltration of monocytes. Once infiltrated, monocytes differentiate into macrophages and can be polarized into either the type 1 phenotype (M1), with the capacity to secrete inflammatory cytokines, or the type 2 phenotype(M2), with the capacity to secrete anti‐inflammatory cytokines. Within the atherosclerotic plaque, AT2 receptor expression has been co‐localized with macrophage staining (Sales et al., 2005) suggesting that macrophages express AT2 receptors. Whether direct activation of monocyte AT2 receptors inhibits activation and/or influences macrophage polarization remains unclear.
In the current study we aimed to determine the pathways involved in the anti‐atherosclerotic effects of direct activation of the AT2 receptors on the adhesion cascade in vitro, ex vivo and plaque formation in vivo.
Methods
Cell culture
HUVECs (passage 2–6, Lonza, Allendale, NJ, USA) and human monocytic cell line (Thp‐1) monocytes (ATCC, Manassas, VA, USA) were cultured in endothelial basal medium‐2 media with endothelial growth media growth supplements and 100 U·mL−1 antibiotic/antimitotic (Life Technologies, Auckland, New Zealand) or RPMI medium (Life Technologies) with 10% FBS respectively. Cultured cells were maintained at 37°C in 5% CO2.
HUVEC treatment
HUVECs were cultured to 80% confluency and were incubated for 4 h with media alone or in the presence of human TNF‐α (10 ng·mL−1, R&D Systems, Minneapolis, MN, USA), the AT2 receptor agonist, compound 21 (C21, 0.1–100 μM, Vicore Pharma, Sweden) and either the AT2 receptor antagonist PD 123319 (100 μM, Sigma‐Aldrich, St Louis, MO, USA) or pharmacological inhibitors of the published AT2 receptor intracellular signalling pathways (Lokuta et al., 1994; Jacobs and Douglas, 1996; Johren et al., 2004; Rompe et al., 2010) using the CYP2C/CYP2J inhibitor [6‐(2‐prp(argyloxyphenyl)hexanoic acid (PPOH), 10 μM; Sapphire Bioscience, Redfern, NSW, Australia], the NOS inhibitor [Nω‐nitro‐L‐arginine methyl ester hydrochloride (L‐NAME), 100 μM; Sigma‐Aldrich], the tyrosine phosphatase inhibitor sodium orthovanadate, (50 μM; Sigma‐Aldrich) or the serine palmitoyltransferase inhibitor (myriocin, 10 μM; Sigma‐Aldrich). Inflammation was assessed via cytokine gene expression, protein expression and static adhesion of Thp‐1 monocytes to the treated HUVEC monolayer.
Real‐time PCR
Cells were treated as detailed earlier and RNA was extracted using TRIzol (Life Technologies) methodology as described previously (Fu et al., 2012). One microgram of RNA was DNAse treated and reverse transcribed into cDNA. Gene expression for intracellular adhesion molecule‐1 (ICAM), the chemokine CCL2 and IL‐6 (primers obtained from Geneworks, Thebarton, SA, Australia) was assessed using real‐time RT‐PCR (ABI Prism 7500, Perkin‐Elmer Inc, PE Biosystems, Waltham, MA, USA) with SYBR green chemistry (Roche Diagnostics, Indianapolis, IN, USA). Gene expression was quantified using the ΔCT method as previously described (Sampson et al., 2008).
Flow cytometry
Protein expression of ICAM, CCL2 and IL‐6 was quantified in treated HUVECs using flow cytometry. Cells were treated, harvested and stained with anti‐ICAM (1:200, BD Biosciences, North Ryde, NSW, Australia), anti‐ CCL2 (1:200, BD Biosciences) and anti‐IL‐6 (1:200, BD Biosciences). Fluorescence was detected on the FACS Calibur II Flow Cytometer (BD Biosciences, San Jose, CA, USA) and Cell Quest Pro software (BD Biosciences).
Static adhesion assay
HUVECs were cultured on glass coverslips to 80% confluency. Following 4 h of treatment as detailed earlier, the cultured HUVEC monolayer was incubated with 3 × 10⁵ Thp‐1 monocytes for further 2 h. The HUVEC/Thp‐1 cell layer was fixed, mounted and imaged using phase contrast microscopy at 4× magnification (Olympus FSX100, Olympus Life Sciences, Notting Hill, Vic, Australia). The number of adhered monocytes was counted using ImageJ software (version 1.44p, NIH, Sacaton, AZ, USA). Four fields of view were averaged per well with triplicate wells analysed per assay. Each n represents an individual assay. Preliminary findings were used to determine that a sample size of n = 4 was required to detect a difference in adhesion of 1174 with a SD of 431, α = 0.05, power = 0.80.
NF‐κB translocation to the nucleus
HUVECs were cultured on a glass coverslip and were treated as described earlier (see HUVEC treatment section) for 15 min. Following treatment, cells were fixed (10% formalin; Sigma‐Aldrich), blocked with 0.3% Triton X‐100 (Sigma‐Aldrich) and 5% normal rabbit serum (Vector, Burlingame, CA, USA), incubated with anti‐NF‐κB‐p65 (1:50; Cell Signalling, Danvers, MA, USA) for 24 h at 4°C and subsequently with a secondary antibody conjugated with Alexa Fluor 546 (1:750; Life Technologies, Auckland, New Zealand) for 1 h. Cells were mounted in ProLong® Gold antifade reagent with 4′,6‐diamidino‐2‐phenylindole (DAPI) for nuclear staining (Life Technologies) and were imaged using fluorescence microscopy (0.75 μm z‐stack sections, Nikon AR1 confocal microscope). DAPI‐positive staining determined the nuclear area mask for each z‐stack that was used to quantify NF‐κB‐positive staining in the nucleus and cytoplasm. NF‐κB staining was quantified as the fluorescence intensity/area for each z‐stack slice and is presented as the average fluorescence intensity per cell.
Reactive oxygen species (ROS) production
HUVECs were cultured to 90% confluency on a glass coverslip that was mounted in a cell chamber. As previously described, cellular ROS production was assessed using perfused naïve endothelial cells exposed to the protocol described below (Huet et al., 2013). Cellular ROS generation was measured using 2,7‐dichlorofluorescein (DCFH; Molecular Probes Europe BV, Leiden, The Netherlands) and dihydroethidium (DHE; Molecular Probes Europe BV). Results are reported as a percentage increase of fluorescence using the following formula [(fluorescence at T120 − fluorescence at T60)/fluorescence at T60] × 100. Endothelial ROS production was quantified in the presence or absence of TNF‐α (1 ng·mL−1; Sigma Chemical Co., St Louis, MO, USA) (Huet et al., 2013) alone or in conjunction with C21 (100 μM). C21 was added to the perfusion 10 min after TNF‐α perfusion was started. After 1 h of exposure to TNF‐α, with or without C21, perfusion was continued with Krebs–Henseleit buffer, and the cells observed for a further hour. Fluorescent images were obtained every 10 min and analysed to assess ROS production. For each group the experiment was repeated four times, based on the power calculation described above.
Monocyte activation
Fresh whole human blood (1mL) was obtained via venepuncture, from healthy, medication free donors aged between 20–50 years of age, in compliance with the requirements of the Alfred Human Research and Ethics Unit (HREC; Ref. No. 195/13). Samples were collected in sodium citrate (13 mM; Merck, Bayswater, Vic, Australia) Whole blood (200 μL) was pretreated with C21 (1 μM) or C21 + PD 123319 (10 μM) or left untreated for 15 min at 37°C prior to staining with anti‐CD14 (1:100, BD Biosciences) and anti‐CD11b (1:100, BD Biosciences) and activated with LPS (100 ng·mL−1; Sigma‐Aldrich, Castle Hill, NSW, Australia) for 15 min at 37°C. Cells were subsequently lysed and expression of the activation marker CD11b determined in CD14+ monocytes by flow cytometry (FACS Calibur II, BD Biosciences). Each n represents an independent monocyte isolation from human blood (n = 4–6 independent samples) with n derived from the average of triplicate wells within each independent sample. SEM was calculated from the single n value per independent sample. Surface protein expression is presented relative to the untreated isolated monocytes from each blood sample.
Macrophage differentiation and polarization
Human monocytes were isolated from 60 mL buffy coats (Australian Red Cross Blood Bank using a Material Supply Agreement 13‐05VIC‐12) using magnetic‐activated cell sorting (MACS), pan monocyte negative selection kit and LS MACS columns (Miltenyi Biotec, Germany). Isolated monocytes were differentiated into macrophages using M‐CSF (100 ng·mL−1; R&D Systems) for 7 days. Macrophages were then cultured in media alone (unpolarized, M0) or polarized into either M1 phenotype [with LPS (100 ng·mL−1) + IFNγ (20 ng·mL−1; R&D Systems)] or M2 phenotype [with IL‐4 (20 ng·mL−1; R&D Systems)] in the presence or absence of C21 (1 μM) or C21 + PD 123319 (10 μM). To examine macrophage phenotype, macrophages were harvested after 6 h for mRNA gene expression analysis of TNF‐α, IL‐6, scavenger receptor class B type 1 (SRB1) and 18S as detailed earlier (primers obtained from Geneworks) or 24 h for surface marker expression of CD64 (M1 marker, anti‐CD64; R&D Systems) or CD200R (M2 marker, anti‐CD200R; R&D Systems) that was assessed via flow cytometric analysis. Each n represents an independent monocyte isolation from human blood (n = 4–6 independent samples) with n derived from the average of triplicate wells within each independent sample. SEM was calculated from the single n value per independent sample. Surface protein expression is presented relative to the untreated isolated monocytes from each blood sample.
Animals
All animal care and experimental procedures conformed to National Health and Medical Research Institute Animal Welfare Committee guidelines and were approved by the Alfred Medical Research and Education Precinct (AMREP) ethics committee (E/1090/2011/B) and the Alfred Human Research and Ethics Unit (HREC, Ref No. 397/09). All mice were specific pathogen free and were housed on a 12 h light/dark cycle with food and water provided ad libitum. Studies involving animals are reported in accordance with the ARRIVE guidelines for reporting experiments involving animals (Kilkenny et al., 2010; McGrath et al., 2010). A total of 114 animals were used in the experiments described here.
Quantification of endothelial inflammation in an intact vessel
Aortae were collected from 8‐ to 10‐week‐old male C57/Bl6 mice following CO2 asphyxiation (AMREP Animal Services, Melbourne, Vic, Australia), cleared of connective tissue and were either untreated or incubated with mouse TNF‐α (10 ng·mL−1; R&D Systems), C21 (1, 10, 100 μM) and/or PD 123319 (10 μM) for 4 h. Real‐time leukocyte to endothelial cell adhesion or gene expression of ICAM, CCL2and IL‐6 was assessed. Briefly, treated aortae were mounted on a vessel chamber (Michell et al., 2011) and perfused with whole human blood (0.12 mL·min−1) labelled with Vybrant DiI (1:1000, Lonza) to fluorescently label leukocytes as previously described (Woollard et al., 2008). Fresh whole human blood was obtained via venepuncture, as described above, and collected in heparin to prevent coagulation (40 U·mL−1 of blood). Leukocyte to endothelial cell interactions were imaged using a Zeiss Discovery V.20 microscope (Zeiss, Oberkochen, Germany) coupled to a high‐definition camera (Hamamatsu, Shizuoka Prefecture, Japan) and AxioVision software (release 4.8.2.0, Zeiss). Fifteen second video recordings of at least two fields of view were taken at each time point and adhered/stationary leukocytes were counted and averaged. We have previously observed that leukocyte adhesion to intact aorta treated with TNF‐α was the same when either mouse or human blood was used (Woollard et al., 2008). For cytokine gene expression, RNA was extracted from a separate cohort of treated vessels using TRIzol extraction and 1 μg was reverse transcribed into cDNA. ICAM, CCL2 and IL‐6 mRNA gene expression (primers were obtained from Geneworks) was determined via real‐time PCR with SYBR green chemistry (Roche Diagnostics) with relative expression quantified using the ΔCT method (Sampson et al., 2008).
In vivo atherosclerosis‐prone mouse model
Six‐week‐old male apolipoprotein E knockout (ApoE−/−) mice (AMREP Animal Services) were fed either a normal chow diet (4.9% fat, 24% protein, 47.5% carbohydrate) or high fat diet (HFD; 21% fat, 0.15% cholesterol; Specialty Feeds, Glen Forrest, WA, Australia) for 10 weeks. Mice were housed with environmental enrichment with three mice per cage and each cage was randomly assigned to standard chow or HFD. After 6 weeks on the HFD, mice were administered either C21 (100 ng·kg−1·min−1) or saline via osmotic minipump (model 2004, Alzet, DURECT, CA, USA) for 4 weeks. Systolic blood pressure was measured at week 6 prior to osmotic minipump implantation and at the conclusion of the study in week 10 by tail‐cuff plethysmography. Following the 10 week treatment period, plasma cholesterol levels were measured via the COBAS Integra (Roche Diagnostics Ltd.) and the aorta was collected for either assessment of endothelial inflammation or immunohistochemical analysis. Endothelial inflammation was assessed by quantifying leukocyte adhesion to the endothelium in real time using the vessel chamber apparatus and by real‐time PCR analysis of ICAM, CCL2 and IL‐6 gene expression as described above. In a separate cohort of mice, the aortae were collected, fixed in 10% neutral buffered formalin, dissected longitudinally and mounted en face. Plaque content in the aortic arch was assessed using en face Sudan IV staining as described previously (Woollard et al., 2014) and were imaged using a Motic SMZ‐168 light microscope and analysed using Fiji 1.47h software (Woollard et al., 2014). The aortic sinus was dissected from within the heart and embedded in OCT compound and sectioned at 6 μm. Sections were stained for lipid content (Oil Red O), anti‐CD68 content (macrophage marker, Serotec, Kidlington, Oxfordshire, UK), smooth muscle cell content (α‐smooth muscle actin, Abcam, Cambridge, UK) and collagen content (0.1% Sirius Red F3BA, Sigma‐Aldrich, Australia) as described previously (Woollard et al., 2014). Sections were imaged and analysed using an FSX100 Olympus microscope and Fiji 1.47h software. All staining data are expressed as the percentage of total plaque area positively stained.
Data analysis
All data are presented as mean ± SEM. Body weight, systolic blood pressure, plasma cholesterol levels, the number of monocytes adhered to the HUVEC monolayer, protein expression (ICAM, CCL2, IL‐6 and CD11b), gene expression (ICAM, CCL2, IL‐6, CD64, TNF‐α, CD200R and SRB1) and NF‐κB‐p65 fluorescent intensity was analysed using one‐way anova with Tukey's post hoc test to account for multiple comparisons. ROS production (DCFH and DHE fluorescence) and leukocyte adhesion to intact mouse aortae were analysed using one‐way anova with repeated measures and Tukey's post hoc test to account for multiple comparisons. Plaque size and composition was analysed using Student's t‐test. P < 0.05 was taken to indicate significant differences between group means.
Results
We examined the effect of C21 on TNF‐α‐induced endothelial inflammation in vitro. TNF‐α induced ICAM, CCL2 and IL‐6 mRNA and protein expression in endothelial cells (Figure 1B, C) as well as monocyte adhesion to the treated endothelial cell monolayer (Figure 1A). Given that C21 has been reported to elicit AT2 receptor‐mediated effects in vitro at concentrations ranging from 10−11 to 10−3 M (Barber et al., 1999; Matrougui et al., 1999; Widdop et al., 2002; Rompe et al., 2010; Dhande et al., 2015), we first performed a concentration‐response study. C21 at 100 μM reduced TNF‐α‐induced ICAM, CCL2 and IL‐6 gene and protein expression (Figure 1B, C). TNF‐α‐induced monocyte adhesion to endothelial cells was reduced by 40% in the presence of C21 (Figure 1A). The anti‐inflammatory effects of C21 were abolished in the presence of the AT2 receptor antagonist PD 123319 (Figure 1). Monocyte adhesion and expression of ICAM, CCL2 and IL‐6 was not different in untreated HUVECs compared with HUVECs treated with C21 or PD 123319 treatment alone (data not shown).
Figure 1.
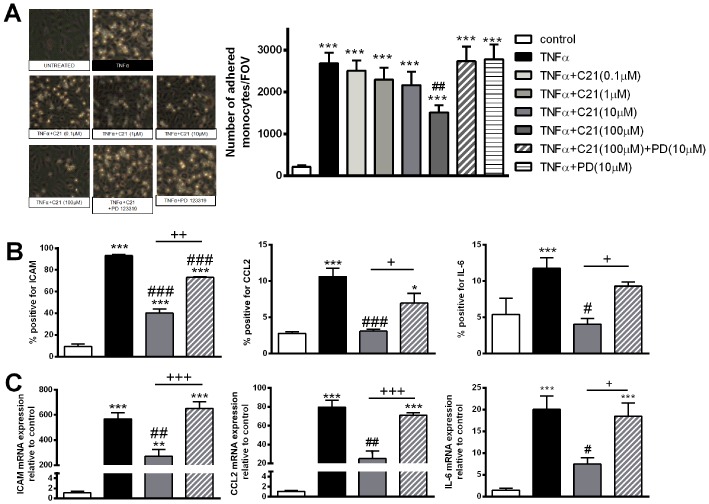
Endothelial inflammation in response to stimulation with TNF‐α (10 ng·mL−1), the AT2 receptor agonist C21 (0.1–100 μM) and/or the AT2 receptor antagonist PD 123319 (PD; 10 μM). Endothelial inflammation was assessed by (A) static adhesion of Thp‐1 monocytes to a treated HUVEC monolayer; (B) ICAM, CCL2 or IL‐6 protein expression; and (C) ICAM, CCL2 and IL‐6 gene expression. Data are presented as mean ± SEM, n = 4 for the control group with n = 5–6 in all other groups representing individual experiments performed in triplicate and were analysed using one‐way anova with Tukey's post hoc test to account for multiple comparisons. *P < 0.05, **P < 0.01, ***P < 0.005 compared with control. #P < 0.05, ##P < 0.01, ###P < 0.005 compared with TNF‐α. +P < 0.05, ++P < 0.01, +++P < 0.005.
We next examined the intracellular signalling pathways of the AT2 receptor. Pharmacological inhibition of known intracellular signalling pathways of AT2 receptors with PPOH, sodium orthovanadate, L‐NAME or myriocin did not prevent the anti‐inflammatory effects of C21 as assessed by monocyte adhesion or ICAM protein expression (Figure 2A, B). However, TNF‐α‐induced ROS production and NF‐κB‐p65 translocation from the cytoplasm to the nucleus were reduced in the presence of C21, an effect abolished by co‐incubation with PD 123319 (Figure 2C–F).
Figure 2.
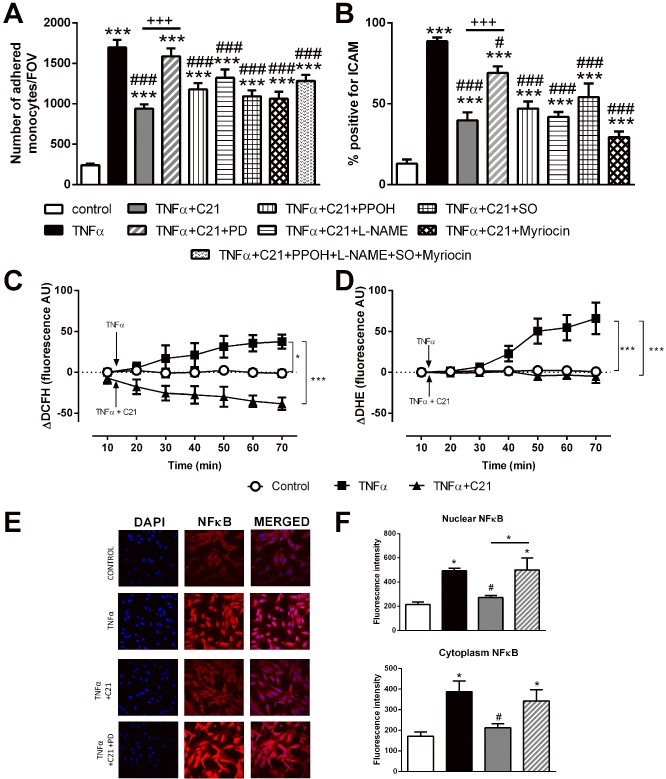
Investigation of the intracellular inflammatory signalling pathway. Endothelial inflammation was assessed via (A) Thp‐1 adhesion to a treated HUVEC monolayer, SO, sodium orthovanadate. (B) ICAM protein expression in treated HUVECs, intracellular ROS production assessed by (C) hydrogen peroxide production (measured as DCFH production) and (D) superoxide production (measured as DHE production) with the arrow indicating the time which TNF‐α and/or C21 incubation was started. (E–F) cytoplasmic and nuclear NF‐κB‐p65 subunit staining. Data are presented as mean ± SEM, n = 4 for the control group with n = 5–6 in all other groups representing individual experiments performed in triplicate. Panels A, B and F were analysed using one‐way anova with Tukey's post hoc test to account for multiple comparisons. Panels C and D were analysed using one‐way repeated measures anova with Tukey's post hoc analysis to account for multiple comparisons. *P < 0.05, ***P < 0.005 compared with control. #P < 0.05, ###P < 0.005 compared with TNF‐α. +++P < 0.005, significantly different as indicated.
We then examined whether C21 treatment prevented LPS‐induced monocyte activation and influenced macrophage polarization or macrophage cytokine profiles. Although LPS increased expression of the activation marker CD11b on CD14+ monocytes, this activation was unaffected by treatment with either C21 or C21 + PD 123319 (Figure 3A). Treatment of macrophages with LPS + IFN‐γ polarized macrophages to the M1 phenotype as shown by the increase in CD64 surface expression (Figure 3B). Co‐incubation of macrophages with LPS + IFN‐γ + C21 did not influence the expression of CD64 indicating that polarization to the M1 phenotype was unchanged by C21 (Figure 3B). Similarly, treatment of macrophages with IL‐4 increased the expression of CD200R indicating polarization to the M2 phenotype but this was not affected by C21 (Figure 3C). Consistent with the M1 surface expression, mRNA gene expression profiles of TNF‐α and IL‐6 were increased in macrophages treated with LPS + IFN‐γ (Figure 3D, F) compared with untreated cells. Macrophages treated with C21 in addition to LPS + IFN‐γ had significantly lower TNF‐α and IL‐6 gene expression compared with LPS + IFN‐γ treated cells (Figure 3D, F). Expression of the anti‐inflammatory gene SRB1 was increased in macrophages treated with IL‐4 compared with untreated macrophages (Figure 3E) and mRNA expression of SRB1 was not influenced by the presence of either C21 or PD 123319.
Figure 3.
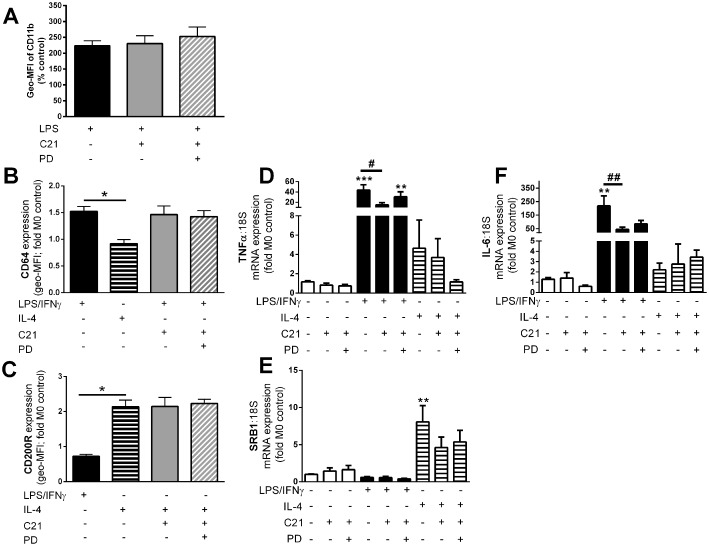
C21 treatment did not influence monocyte activation or macrophage polarization but did influence inflammatory gene expression profiles. (A) Monocytes were activated with LPS and activation was assessed as surface expression of the monocyte activation marker CD11b, represented as mean fluorescent intensity (Geo‐MFI) as the percentage of untreated monocytes. Macrophages were incubated with LPS + IFNγ to promote polarization to the M1 phenotype that was assessed by (B) surface expression of the M1 marker CD64 or (C) IL‐4 to promote polarization to the M2 phenotype that was assessed by surface expression of the M2 marker CD200R. Data are represented as the fold change in mean fluorescence intensity (Geo‐MFI) relative to the untreated samples. mRNA gene expression of the inflammatory genes (D) TNF‐α and (F) IL‐6 and the anti‐inflammatory gene (E) SRB1 was quantified in unpolarized, M1 and M2 macrophages. Data are represented relative to 18S and are expressed as mean ± SEM and were analysed using one‐way anova with Tukey's post hoc test to account for multiple comparisons. *P < 0.05, **P < 0.01, ***P < 0.005 compared with untreated controls. #P < 0.05, ##P < 0.01. Data are presented as mean ± SEM, n = 4 for the control group with n = 5–6 in all other groups representing individual experiments performed in triplicate.
To investigate whether the anti‐inflammatory effect of C21 in endothelial cells translates to the whole vessel, we next examined leukocyte adhesion and inflammatory gene expression in the intact mouse aorta. Four hour treatment with C21 prevented TNF‐α‐induced leukocyte adhesion in a concentration‐dependent manner which was blocked by PD 123319 (Figure 4). Leukocyte adhesion in vessels treated with C21 or PD 123319 alone was similar to untreated vessels (data not shown).
Figure 4.
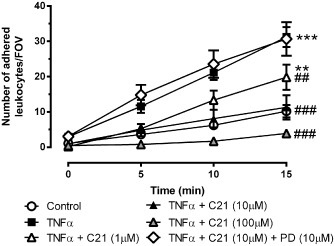
Endothelial inflammation in the intact mouse aortae in response to stimulation with TNF‐α (10 ng·mL−1), the AT2 receptor agonist C21 (1–100 μM) and/or the AT2 receptor antagonist PD 123319 (PD, 10 μM) as assessed by leukocyte to endothelial adhesion ex vivo [number of adhered leukocytes per field of view (FOV); n ≥ 6]. Data are presented as mean ± SEM and were analysed using one‐way repeated measures anova with Tukey's post hoc test to account for multiple comparisons. **P < 0.01, ***P < 0.005 compared with control. ##P < 0.01, ###P < 0.005 compared with TNF‐α.
To examine the anti‐inflammatory effects of C21 in vivo, we examined endothelial inflammation in the setting of atherosclerosis using ApoE−/− mice. Treatment of ApoE−/− mice with HFD did not increase body weight but increased systolic blood pressure, total cholesterol, LDL and HDL (Table 1). Body weight, systolic blood pressure and cholesterol levels were not different between ApoE−/− + HFD mice and ApoE−/− + HFD mice treated with C21 for 4 weeks (Table 1). We observed higher leukocyte to endothelial adhesion and gene expression of ICAM, CCL2 and IL‐6 in aortae from ApoE−/− + HFD mice compared with ApoE−/− fed a normal chow diet (Figure 5A, B). Treatment of ApoE−/− + HFD mice with C21 for the final 4 weeks significantly reduced leukocyte to endothelial adhesion (Figure 5A) and gene expression of ICAM, CCL2 and IL‐6 to levels similar to that of the normal chow fed mice (Figure 5B). Furthermore, plaque size was significantly lower in the aortae from mice treated with C21 compared with ApoE−/− +HFD mice (Figure 5C). We also observed a reduction in lipid deposition (Figure 5D) and macrophage content (Figure 5E) and an increase in smooth muscle cell content (Figure 5G) of the plaques from ApoE−/− + HFD + C21 mice compared with ApoE−/− + HFD. There was no difference in collagen content of the plaques from ApoE−/− + HFD and ApoE−/− + HFD + C21.
Table 1.
Body weight, systolic blood pressure (SBP) and serum cholesterol levels in ApoE −/− mice fed either a normal chow or HFD for 10 weeks with or without chronic C21 treatment
| Normal chow (n = 7) | HFD + saline (n = 8) | HFD + C21 (n = 8) | |
|---|---|---|---|
| Week 0 body weight (g) | 23 ± 1 | 23 ± 1 | 23 ± 1 |
| Week 10 body weight (g) | 27 ± 0.4 | 28 ± 0.5 | 28 ± 0.6 |
| Week 6 SBP (mmHg) | 86 ± 6 | 95 ± 1 | 93 ± 3 |
| Week 10 SBP (mmHg) | 94 ± 2 | 104 ± 1*** | 100 ± 1** |
| Total cholesterol (mM) | 23.7 ± 2.6 | 69.8 ± 5.5*** | 71.6 ± 5.4*** |
| HDL cholesterol (mM) | 4.6 ± 0.3 | 14.5 ± 1*** | 16.4 ± 0.6*** |
| LDL/vLDL cholesterol (mM) | 14.6 ± 1.9 | 66.2 ± 5.4*** | 72.5 ± 5.1*** |
Body weight and serum cholesterol levels (HDL and LDL/vLDL) at week 0, week 6 or at the conclusion of the 10 week treatment period. Data are presented as mean ± SEM and were analysed using one‐way anova with Tukey's post hoc test to account for multiple comparisons. **P < 0.01, ***P < 0.001 compared with ApoE−/− normal chow‐treated group.
Figure 5.
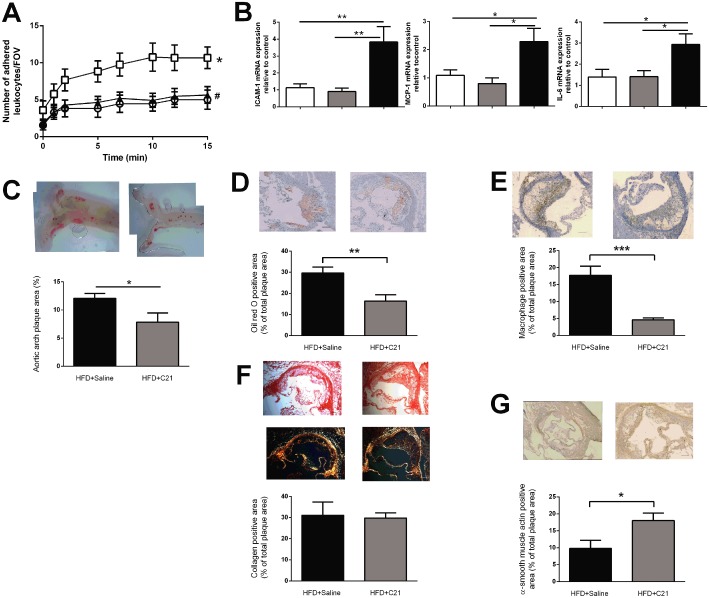
Chronic C21 treatment in ApoE −/− mice prevented HFD‐induced (A) leukocyte to endothelial adhesion ex vivo [number of adhered leukocytes per field of view (FOV); n ≥ 11] (B) ICAM, CCL2 and IL‐6 gene expression (n ≥ 5); (C) plaque size in the aortic arch (% area positive for Sudan IV, n = 8); and altered plaque morphology by reducing (D) lipid content (% area positive for Oil Red O staining) and (E) macrophage content in the plaque (% area positive for CD68, n ≥ 8). There was no difference in (F) collagen content [% area positive for collagen, n ≥ 8, representative images of both light (top) and polarized (lower) microscopy sections] but chronic C21 treatment increased (G) smooth muscle cell content in the plaques of ApoE −/− fed HFD (% area positive for α‐smooth muscle actin, n ≥ 6). Representative images are given for each analysis with grouped data presented as mean ± SEM. Scale bar = 100 μm. Panel A was analysed using one‐way repeated measures anova with Tukey's post hoc analysis to account for multiple comparisons, panel B was analysed using one‐way anova with Tukey's post hoc test to account for multiple comparisons and panels C–G were analysed using Student's t‐test. *P < 0.05, **P < 0.01, ***P < 0.005; #P < 0.05, compared with HFD+saline treated group.
Discussion
Activation of AT2 receptors reduced plaque formation and improved plaque stability in atherosclerosis‐prone mouse models (Sales et al., 2005; Hu et al., 2008; Tesanovic‐Kljajic et al., 2013), but the mechanisms underlying these effects remained unclear. We provide evidence, for the first time, that activation of the AT2 receptors on endothelial cells prevents endothelial inflammation via inhibition of ROS‐induced NF‐κB translocation and inflammatory cytokine expression. Previous reports had shown separately that AT2 receptor activation in the setting of atherosclerosis reduced NADPH oxidase activity and ROS production in whole aorta (Dandapat et al., 2008; Tesanovic‐Kljajic et al., 2013), prevents NF‐κB translocation in dermal fibroblasts (Rompe et al., 2010) and prevents inflammatory gene expression in endothelial cells and whole aorta (Rompe et al., 2010; Tesanovic‐Kljajic et al., 2013). This study is the first to elucidate the signalling pathway (from stimulation of AT2 receptors to ROS production, NF‐κB translocation, gene expression and protein expression) in endothelial inflammation. In addition, we observed that the anti‐inflammatory effects of C21 on the endothelium are preserved both ex vivo, in intact aorta and in vivo as shown by a reduction in TNF‐α‐induced and chronic HFD‐induced leukocyte to endothelial adhesion. Importantly, our data suggest that neither monocyte activation nor macrophage polarization are influenced by C21, pointing to the fact that the anti‐inflammatory effects of C21 in vivo are primarily mediated by activation of endothelial AT2 receptors. Chronic C21 treatment also reduced HFD‐induced endothelial inflammation, inflammatory cytokine expression and plaque formation. This finding is of particular interest as C21 was administered for the final 4 weeks of the 10 week HFD suggesting that therapeutically, C21 treatment may have beneficial effects on established plaques as well as preventing plaque formation.
The initial stages of plaque formation involve a complex interplay between endothelial activation and monocyte recruitment, infiltration and polarization. Stimulation of AT2 receptors has been reported to prevent inflammatory cytokine expression in human and mouse dermal fibroblasts, smooth muscle cells and brain (Wu et al., 2004; McCarthy et al., 2009; Rompe et al., 2010). We observed, consistent with previous reports (Iwai et al., 2005), that C21 blunts TNF‐α‐induced ICAM, CCL2 and IL‐6 gene and protein expression in endothelial cells. Although the anti‐inflammatory effects of C21 were inhibited by the AT2 receptor antagonist PD 123319, inhibition of the known intracellular signalling pathways of the AT2 receptor either alone or in combination did not prevent the anti‐inflammatory effects of C21. In addition to stimulation of these intracellular signalling pathways, activation of AT2 receptors has been reported to prevent AT1 receptor intracellular signalling (Yamada et al., 1998). Therefore, we hypothesized that the anti‐inflammatory effects of C21‐induced activation of AT2 receptors may be mediated by a prevention of a common AT1 receptor and TNF‐α intracellular signalling pathway, such as ROS production. Consistent with this hypothesis, we observed that C21 reduced TNF‐α‐induced ROS and NF‐κB translocation suggesting that the anti‐inflammatory effects of C21 were mediated via prevention of TNF‐α‐induced ROS production, NF‐κB translocation and subsequent inflammatory cytokine production. In addition, we provide the first functional evidence that C21 prevents TNF‐α‐induced and HFD‐induced leukocyte to endothelial adhesion in vitro, ex vivo and in vivo via a reduction in ROS‐induced NF‐κB translocation.
We hypothesized that, in addition to blunting endothelial activation, C21 treatment may prevent monocyte activation and promote macrophage polarization to the atheroprotective M2 phenotype, consistent with the reported C21‐induced reduction in macrophage content in plaques (Sales et al., 2005). Macrophage phenotype, and subsequent cytokine production, is both a cause and consequence of the plaque microenvironment. In the presence of inflammatory cytokines, polarization of macrophages to the M1 phenotype is enhanced resulting in a greater number of M1 macrophages capable of secreting inflammatory cytokines, further enhancing the inflammatory milieu within the plaque (Gordon and Taylor, 2005). Importantly, macrophages retain their plasticity and are able to re‐polarize to an alternative phenotype in response to alterations in the surrounding microenvironment. Indeed, pharmacological blockade of the inflammatory AT1 receptor promoted repolarization of M1 cells into the M2 phenotype (Hisada et al., 1999). Although AT1 receptor knockout mice have reduced numbers of M1 macrophages within the plaque, whether this is due to the absence of AT1 receptor signalling or the increased activation of AT2 receptors was unclear. C21 had no influence on the ability of macrophages to polarize to either M1 or M2 but did reduce the inflammatory gene expression profile of the M1 macrophages as evidenced by a lower TNF‐α and IL‐6 gene expression profile consistent with previous findings (Dhande et al., 2015). Moreover, we demonstrated that LPS‐induced monocyte activation is not attenuated in the presence of C21. Taken together, our in vitro data suggest that C21 prevents endothelial inflammation but had little to no effect on monocytes or macrophage phenotypes.
Treatment with C21 did not influence blood pressure or serum cholesterol levels as shown previously (Hilliard et al., 2012; Rehman et al., 2012; Brouwers et al., 2013; Tesanovic‐Kljajic et al., 2013), but did reduce HFD‐induced plaque formation and improve plaque morphology. Specifically, plaques from mice treated with C21 had a lower lipid and macrophage content and higher smooth muscle cell content than ApoE−/− + HFD mice suggesting that the plaques from C21 treated mice were of a more stable phenotype. These findings are consistent with previous studies involving LDLR−/− mice with AT2 receptor overexpression and ApoE−/− mice treated with the AT2 receptor peptide agonist CGP 42112 (Hu et al., 2008; Tesanovic‐Kljajic et al., 2013). The reduction in macrophage staining in the plaques from mice treated with C21 suggests that C21 treatment may influence endothelial recruitment and/or proliferation of monocytes and/or macrophages. Indeed, the reduction in TNF‐α‐induced or HFD‐induced ICAM, CCL2 and IL‐6 cytokine expression supports this hypothesis. We did not observe any difference in collagen content in the plaques from ApoE−/− + HFD and ApoE−/− + HFD + C21 in contrast to recent evidence from Tesanovic‐Kljajic et al. (2013). This is likely to be due to the difference in plaque development and location between the two studies. Tesanovic‐Kljajic et al. examined plaques in the brachiocephalic artery after 16 weeks of HFD in contrast to our study with plaques from the aortic arch after 10 weeks of treatment in. Indeed, Sales et al. (2005) reported that collagen staining in plaques from the aortic arch of ApoE−/− and ApoE−/−AT2R−/− mice was not different at 10 weeks of age but were higher in ApoE−/−AT2R−/− mice at 16 weeks suggesting that perhaps activation of AT2 receptors may reduce collagen deposition in the later stages of plaque development (Sales et al., 2005). In any case, atherosclerosis plaque stability was improved in both locations by activation of AT2 receptors in our study (shown by an increase in SMC staining) consistent with Tesanovic‐Kljajic et al. (2013, shown by an increase in collagen staining).
The reduction in plaque size in mice treated with C21 is particularly promising therapeutically, as C21 was administered for the final 4 weeks of the 10 week HFD, suggesting that C21 treatment may exert anti‐atherogenic effects on established plaques in addition to preventing plaque formation. To put this in context, the magnitude of the reductions in plaque size, lipid content and macrophage content was similar in the current study to results from models which stimulated AT2 receptors from plaque onset (Sales et al., 2005; Hu et al., 2008).
In summary, we demonstrated for the first time that direct activation of AT2 receptors with the specific non‐peptide agonist C21 prevented endothelial recruitment and adhesion of monocytes, the critical first step in plaque formation. Importantly, we observed that treatment with C21 prevented endothelial inflammation via inhibition of ROS‐induced NF‐κB translocation. Furthermore, our data demonstrated that AT2 receptor stimulation did not influence monocyte activation or macrophage polarization despite the fact that these receptors were expressed on both monocytes and macrophages. In an atherosclerosis model, we observed that a 4 week treatment with C21 significantly reduced plaque size and improved plaque stability. Taken together, our findings suggest that the anti‐atherogenic effects of direct AT2 receptor stimulation are mediated by the prevention of endothelial inflammation. Given the striking reduction in endothelial inflammation and plaque formation in the setting of atherosclerosis together with the well‐reported up‐regulation of AT2 receptors in atherosclerosis, our data provide strong evidence not only of the therapeutic potential of C21 in the treatment of atherosclerosis but, moreover, that its anti‐atherosclerotic actions are due to its vascular anti‐inflammatory effects.
Author contributions
A. K. S., J. C. I., W. A. S., D. D., N. L., O. H. and T. B. performed the research. A. K. S., J. C. I., T. U., U. M. S., G. L. J., R. E. W. and J. P. F. C.‐D. designed the research study. R. E. W. and U. M. S. contributed essential reagents or tools. A. K. S., J. C. I., W. A. S., D. D., N. L., O. H. and T. B. analysed the data. A. K. S., J. C. I. and J. P. F. C.‐D. wrote the paper. A. K. S., J. C. I., W. A. S., D. D., N. L., O. H., T. B., T. U., U. M. S., G. L. J., R. E. and J. P. F. C.‐D. drafted the manuscript.
Conflict of interest
T. U. has a moderate financial interest in Vicore Pharma and U. M. S. received modest support from Vicore Pharma.
Acknowledgements
The authors would like to acknowledge the facilities provided by Monash Micro Imaging, Monash University and in particular the imaging technical assistance of Ms Irena Carmichael and Mr Stephen Cody. This work was supported by the National Health and Medical Research Council of Australia (program grant APP10363652), National Heart Foundation Fellowships awarded to A. K. S. (PF 12M 6806) and J. C. I. (PF 12M 6810) and supported in part by the Victorian Government's Operational Infrastructure Support Program.
Sampson, A. K. , Irvine, J. C. , Shihata, W. A. , Dragoljevic, D. , Lumsden, N. , Huet, O. , Barnes, T. , Unger, T. , Steckelings, U. M. , Jennings, G. L. , Widdop, R. E. , and Chin‐Dusting, J. P. F. (2016) Compound 21, a selective agonist of angiotensin AT2 receptors, prevents endothelial inflammation and leukocyte adhesion in vitro and in vivo . British Journal of Pharmacology, 173: 729–740. doi: 10.1111/bph.13063.
References
- Alexander SPH, Benson HE, Faccenda E, Pawson AJ, Sharman JL, Spedding M et al (2013a). The Concise Guide to PHARMACOLOGY 2013/14: G Protein‐Coupled Receptors. Br J Pharmacol 170: 1459–1581. [DOI] [PMC free article] [PubMed] [Google Scholar]
- Alexander SPH, Benson HE, Faccenda E, Pawson AJ, Sharman JL, Spedding M et al (2013b). The Concise Guide to PHARMACOLOGY 2013/14: Enzymes. Br J Pharmacol 170: 1797–1867. [DOI] [PMC free article] [PubMed] [Google Scholar]
- Barber MN, Sampey DB, Widdop RE (1999). At(2) receptor stimulation enhances antihypertensive effect of at(1) receptor antagonist in hypertensive rats. Hypertension 34: 1112–1116. [DOI] [PubMed] [Google Scholar]
- Brouwers S, Smolders I, Massie A, Dupont AG (2013). Angiotensin II type 2 receptor‐mediated and nitric oxide‐dependent renal vasodilator response to compound 21 unmasked by angiotensin‐converting enzyme inhibition in spontaneously hypertensive rats in vivo . Hypertension 62: 920–926. [DOI] [PubMed] [Google Scholar]
- Dandapat A, Hu CP, Chen J, Liu Y, Khan JA, Remeo F et al (2008). Over‐expression of angiotensin II type 2 receptor (agtr2) decreases collagen accumulation in atherosclerotic plaque. Biochem Biophys Res Commun 366: 871–877. [DOI] [PubMed] [Google Scholar]
- Daugherty A, Rateri DL, Lu H, Inagami T, Cassis LA (2004). Hypercholesterolemia stimulates angiotensin peptide synthesis and contributes to atherosclerosis through the at1a receptor. Circulation 110: 3849–3857. [DOI] [PubMed] [Google Scholar]
- Dhande I, Ma W, Hussain T (2015). Angiotensin at2 receptor stimulation is anti‐inflammatory in lipopolysaccharide‐activated thp‐1 macrophages via increased interleukin‐10 production. Hypertens Res 38: 21–29. [DOI] [PMC free article] [PubMed] [Google Scholar]
- Fu Y, Moore XL, Lee MK, Fernandez‐Rojo MA, Parat MO, Parton RG et al (2012). Caveolin‐1 plays a critical role in the differentiation of monocytes into macrophages. Arterioscler Thromb Vasc Biol 32: e117–e125. [DOI] [PubMed] [Google Scholar]
- Gordon S, Taylor PR (2005). Monocyte and macrophage heterogeneity. Nat Rev Immunol 5: 953–964. [DOI] [PubMed] [Google Scholar]
- Hilliard LM, Jones ES, Steckelings M, Unger T, Widdop RE, Denton KM (2012). Sex‐specific influence of angiotensin type 2 receptor stimulation on renal function; a novel therapeutic target for hypertension. Hypertension 59: 409–414. [DOI] [PubMed] [Google Scholar]
- Hisada Y, Sugaya T, Yamanouchi M, Uchida H, Fujimura H, Sakurai H et al (1999). Angiotensin II plays a pathogenic role in immune‐mediated renal injury in mice. J Clin Invest 103: 627–635. [DOI] [PMC free article] [PubMed] [Google Scholar]
- Hu C, Dandapat A, Chen J, Liu Y, Hermonat PL, Carey RM et al (2008). Over‐expression of angiotensin II type 2 receptor (agtr2) reduces atherogenesis and modulates lox‐1, endothelial nitric oxide synthase and heme‐oxygenase‐1 expression. Atherosclerosis 199: 288–294. [DOI] [PubMed] [Google Scholar]
- Huet O, Laemmel E, Fu Y, Dupic L, Aprico A, Andrews KL et al (2013). Interleukin 10 antioxidant effect decreases leukocytes/endothelial interaction induced by tumor necrosis factor alpha. Shock 39: 83–88. [DOI] [PubMed] [Google Scholar]
- Iwai M, Chen R, Li Z, Shiuchi T, Suzuki J, Ide A et al (2005). Deletion of angiotensin II type 2 receptor exaggerated atherosclerosis in apolipoprotein e‐null mice. Circulation 112: 1636–1643. [DOI] [PubMed] [Google Scholar]
- Jacobs LS, Douglas JG (1996). Angiotensin II type 2 receptor subtype mediates phospholipase a2‐dependent signaling in rabbit proximal tubular epithelial cells. Hypertension 28: 663–668. [DOI] [PubMed] [Google Scholar]
- Johren O, Dendorfer A, Dominiak P (2004). Cardiovascular and renal function of angiotensin II type‐2 receptors. Cardiovasc Res 62: 460–467. [DOI] [PubMed] [Google Scholar]
- Li Z, Iwai M, Wu L, Liu HW, Chen R, Jinno T et al (2004). Fluvastatin enhances the inhibitory effects of a selective at1 receptor blocker, valsartan, on atherosclerosis. Hypertension 44: 758–763. [DOI] [PubMed] [Google Scholar]
- Lokuta AJ, Cooper C, Gaa ST, Wang HE, Rogers TB (1994). Angiotensin II stimulates the release of phospholipid‐derived second messengers through multiple receptor subtypes in heart cells. J Biol Chem 269: 4832–4838. [PubMed] [Google Scholar]
- Matrougui K, Loufrani L, Heymes C, Levy BI, Henrion D (1999). Activation of at(2) receptors by endogenous angiotensin II is involved in flow‐induced dilation in rat resistance arteries. Hypertension 34 (4 Pt 1): 659–665. [DOI] [PubMed] [Google Scholar]
- McCarthy CA, Vinh A, Callaway JK, Widdop RE (2009). Angiotensin at2 receptor stimulation causes neuroprotection in a conscious rat model of stroke. Stroke 40: 1482–1489. [DOI] [PubMed] [Google Scholar]
- Michell DL, Andrews KL, Woollard KJ, Chin‐Dusting JP (2011). Imaging leukocyte adhesion to the vascular endothelium at high intraluminal pressure. J Vis Exp 54: 3221. [DOI] [PMC free article] [PubMed] [Google Scholar]
- Pawson AJ, Sharman JL, Benson HE, Faccenda E, Alexander SP, Buneman OP et al; NC‐IUPHAR (2014). The IUPHAR/BPS Guide to PHARMACOLOGY: an expert‐driven knowledge base of drug targets and their ligands. Nucl. Acids Res 42 (Database Issue): D1098–D1106. [DOI] [PMC free article] [PubMed] [Google Scholar]
- Rehman A, Leibowitz A, Yamamoto N, Rautureau Y, Paradis P, Schiffrin EL (2012). Angiotensin type 2 receptor agonist compound 21 reduces vascular injury and myocardial fibrosis in stroke‐prone spontaneously hypertensive rats. Hypertension 59: 291–299. [DOI] [PubMed] [Google Scholar]
- Rompe F, Artuc M, Hallberg A, Alterman M, Stroder K, Thone‐Reineke C et al (2010). Direct angiotensin II type 2 receptor stimulation acts anti‐inflammatory through epoxyeicosatrienoic acid and inhibition of nuclear factor kappab. Hypertension 55: 924–931. [DOI] [PubMed] [Google Scholar]
- Sales VL, Sukhova GK, Lopez‐Ilasaca MA, Libby P, Dzau VJ, Pratt RE (2005). Angiotensin type 2 receptor is expressed in murine atherosclerotic lesions and modulates lesion evolution. Circulation 112: 3328–3336. [DOI] [PubMed] [Google Scholar]
- Sampson AK, Moritz KM, Jones ES, Flower RL, Widdop RE, Denton KM (2008). Enhanced angiotensin II type 2 receptor mechanisms mediate decreases in arterial pressure attributable to chronic low‐dose angiotensin II in female rats. Hypertension 52: 666–671. [DOI] [PubMed] [Google Scholar]
- Tesanovic‐Kljajic ST, Widdop RE, Vinh A, Welungoda I, Bosnyak S, Jones ES et al (2013). Direct at(2) receptor stimulation is athero‐protective and stabilizes plaque in apolipoprotein e‐deficient mice. Int J Cardiol 169: 281–287. [DOI] [PubMed] [Google Scholar]
- Widdop RE, Matrougui K, Levy BI, Henrion D (2002). At2 receptor‐mediated relaxation is preserved after long‐term at1 receptor blockade. Hypertension 40: 516–520. [DOI] [PubMed] [Google Scholar]
- Woollard KJ, Suhartoyo A, Harris EE, Eisenhardt SU, Jackson SP, Peter K et al (2008). Pathophysiological levels of soluble p‐selectin mediate adhesion of leukocytes to the endothelium through mac‐1 activation. Circ Res 103: 1128–1138. [DOI] [PubMed] [Google Scholar]
- Woollard KJ, Lumsden NG, Andrews KL, Aprico A, Harris E, Irvine JC et al (2014). Raised soluble p‐selectin moderately accelerates atherosclerotic plaque progression. PLoS ONE 9: e97422. [DOI] [PMC free article] [PubMed] [Google Scholar]
- Wu L, Iwai M, Li Z, Shiuchi T, Min LJ, Cui T X et al (2004). Regulation of inhibitory protein‐kappa‐b and monocyte chemoattractant protein‐1 by angiotensin II type 2 receptor‐activated src homology protein tyrosine phosphatase‐1 in fetal vascular smooth muscle cells. Mol Endocrinol 18: 666–678. [DOI] [PubMed] [Google Scholar]
- Yamada T, Akishita M, Pollman MJ, Gibbons GH, Dzau VJ, Horiuchi M (1998). Angiotensin II type 2 receptor mediates vascular smooth muscle cell apoptosis and antagonizes angiotensin II type 1 receptor action: an in vitro gene transfer study. Life Sci 63: PL289–PL295. [DOI] [PubMed] [Google Scholar]