Abstract
Objective:
Breast density (BD) is a recognized risk factor for breast cancer. This study maps density variation across a screening population and identifies demographic distinctions, which may affect density and so impact on cancer development/detection. We focus on the relationship between age, ethnicity and socioeconomic status on density.
Methods:
This retrospective study on a screening population adheres to local patient confidentiality requirements. BD data from screening mammograms (March 2013 to September 2014) were measured using Volpara®Density™ software (Volpara®Solutions™, Wellington, New Zealand). Demographics, including patient age, ethnicity and deprivation index, were obtained from our breast screening database and analysed with respect to breast volume (BV), fibroglandular tissue volume (FGV), Volpara %BD and Volpara Grade (1–4 scale, lowest to highest).
Results:
Study population demonstrates little difference for BV with respect to age, but a slight negative trend was noted when FGV was evaluated vs age. Density was linked to ethnicity: females of Chinese ethnicity had higher BD largely reflecting their lower BV. Females in the most deprived quintiles tended to have larger and therefore less dense breasts.
Conclusion:
Our mapping of BD in a regional screening programme demonstrates impact of age, ethnicity and socioeconomic status on BD with attendant implications for breast cancer risk.
Advances in knowledge:
BD is a known risk factor for development of breast cancer. Density trends in a large regional screening population with respect to age, ethnicity and socioeconomics may eventually help identify the risk of breast cancer in certain subsets of the population.
INTRODUCTION
Breast cancer is the most common cancer in females; over 11,000 deaths in the UK were attributed to the disease in 2012.1 Multiple studies have shown that screening mammography decreases breast cancer mortality.2 Increasingly, attention is being paid to identifying and predicting a female's individual risk for breast malignancy in order to determine more appropriate and effective screening regimens.3,4 Breast density (BD) is a recognized risk factor for breast cancer and is thought to reflect an intrinsically greater propensity for the development of breast cancer.5,6 In addition, dense tissue may mask lesions and make cancer detection more challenging. Degree of BD itself may change over time or in response to lifestyle factors such as exercise, diet and exogenous hormone treatment.7 BD has also been shown to be dependent upon other factors, including ethnicity and socioeconomic status.8,9
Our regional Southwest London screening service evaluates 40,000 females per year. Certain demographic information is readily available in this screening population, collected as a part of the screening process. In particular, a female's age, her ethnicity and her postcode (which allows a deprivation index or socioeconomic indicator to be derived) are obtained at screening and entered into the breast screening database.
The aims of this study were to map density variation across a screening population and to identify readily obtainable demographic distinctions, which may affect density and impact cancer development/detection. In particular, we focus on the impact of age on density, ethnicity on density and deprivation index (socioeconomic status) on density.
METHODS AND MATERIALS
This retrospective study was carried out on fully anonymous, routinely collected data only, held in accordance with the National Health Service (NHS) Cancer Screening Programmes Confidentiality and Disclosure Policy 2011. The NHS Breast Screening Programme (BSP) has section 251 support under the NHS Act 2006.
BD data were obtained from screening mammograms obtained from March 2013 to September 2014. All mammograms were performed on either Hologic Selenia and Dimensions units (Hologenic, Bedford, MA) or on a GE Seno Essential unit (GE Medical Systems, Buc, France).
Study population
At the time of the study, the majority of females in the study population invited for screen were within the standard UK screening range of ages 50–70 years (in practice, owing to the nature of invitation to screen timing, ages 49–70 years). In addition, the study population also included females aged above 70 years who would have had to self-refer in order to undergo screening. Those females aged below 49 years would usually be in a high-risk category as determined by formal genetics evaluation.
Density measurements
Five of our eight screening mammography units, each serving a local population, had available raw data for analysis, resulting in inclusion of more than half of all screening mammograms in the study. Mammographic breast densities were measured using Volpara Density software (Algorithm 150; Volpara®Solutions™, Wellington, New Zealand), a fully automated volumetric method of density assessment, which has recently been validated against other methods of measuring density.10 Average density scores were calculated using the Volpara algorithm using all available views [craniocaudal (CC) and mediolateral oblique (MLO)] and averaged right and left breast measurements.
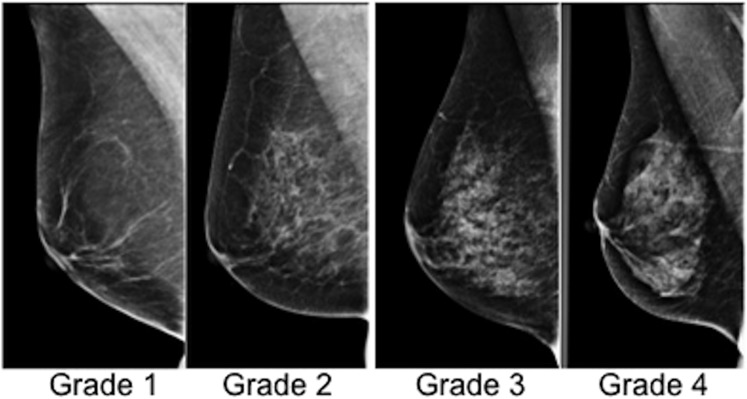
Volpara breast volume (BV), fibroglandular tissue volume (FGV) and Volpara %BD were obtained. The percent volumetric density was divided into pre-assigned categories (Volpara Grades) as follows: 0–4.5%, ≥4.5–7.5%, ≥7.5–15.5%, ≥15.5% (Figure 1). These divisions are designed to accord to the four Breast Imaging-Reporting and Data System (BI-RADS) breast composition categories: 1-fatty [Volpara density grade (VDG 1)], 2-scattered (VDG 2), 3-heterogeneous (VDG 3), 4-extremely dense (VDG 4), although it is worth noting that studies have shown varying agreement both in the evaluation of BI-RADS density between film readers and in the evaluation of BI-RADS categories and automated software.11,12
Figure 1.
Mammographic Volpara breast density (Grades 1–4).
Demographic data
Patient age and self-reported ethnicity were obtained from the database. The breakdown of self-reported ethnic groups based on preset Office of National Statistics 2011 categories is as follows: black includes black African, black British and black Caribbean; white includes white British, white Irish and any other white background; Asian includes Asian British, Bangladeshi, Indian and Pakistani. Chinese is identified as a separate ethnic category. As well, socioeconomic circumstances were approximated using the Indices of Deprivation (IMD) 2010, a deprivation index at the small area level (lower layer super output area or LSOA), created by the British Department for Communities and Local Government.13 The IMD is made up of seven domains (income, employment, health deprivation and disability, education skills and training, barriers to housing and services, crime, and living environment) combined into one score. Each LSOA is then ranked by overall score with the lowest rank being the most deprived. The range of values is from 1 to 32,000. These values have been divided into quintiles for purposes of analysis.
Data analysis
Data analysis was performed using the R statistical system (R Foundation for Statistical Computing, Vienna, Austria).14 The data were loaded from Excel® (Microsoft Excel, Redmond, WA) using openxlsx.15 The statistical charts were generated using the lattice package for R.16 Age distribution for the overall study population was analysed and categorized by incident and prevalent screens. BV, FGV as well as %BD with attendant Volpara Grades were analysed in relationship to cohort age. Density was also evaluated in relationship to ethnic origin code. Finally, density was analysed with respect to deprivation index quintiles (1–5, 1 being the most deprived and 5 the least deprived). Significance for ethnic and deprivation density differences was assessed using a χ2 test.
RESULTS
Screening population
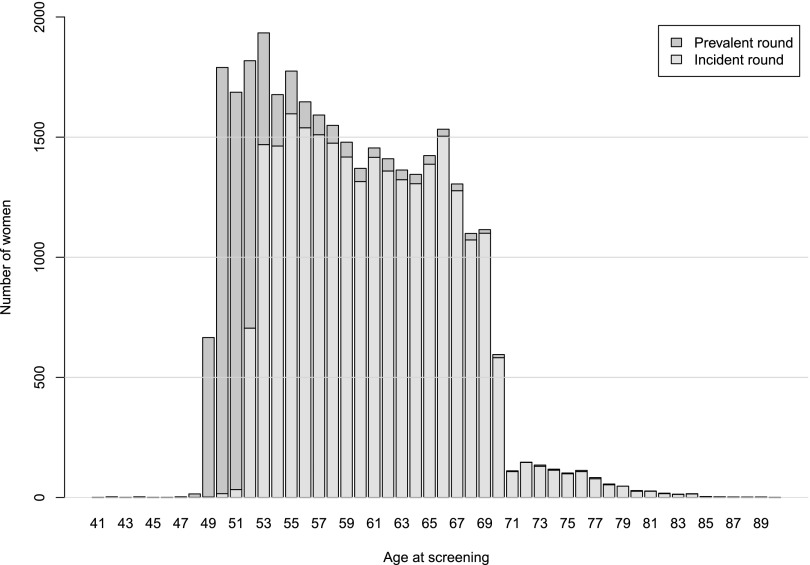
32,685 screening cases were evaluated (age range of the screened females was 41–90 years). The distribution of ages reflects the parameters of the Southwest London UK screening programme (Figure 2 and Table 1). During the time period of the study, females aged 49–70 years were invited for screening. There were only a very few females younger than 49 years of age (28 in total). There were 1030 females older than 70 years; this group would have been self-referred for screening.
Figure 2.
Age distribution in the study screening population by prevalent and incident screen.
Table 1.
Screening population categorized by Volpara density grade with respect to age
| Age (years) | VG 1 | VG 2 | VG 3 | VG 4 | Total |
|---|---|---|---|---|---|
| 40–44 | 1 | 2 | 3 | 2 | 8 |
| 45–49 | 122 | 183 | 223 | 158 | 686 |
| 50–54 | 1948 | 2739 | 2838 | 1381 | 8906 |
| 55–59 | 2270 | 2795 | 2225 | 752 | 8042 |
| 60–64 | 2107 | 2565 | 1788 | 483 | 6943 |
| 65–69 | 2026 | 2488 | 1549 | 412 | 6475 |
| 70–74 | 319 | 455 | 267 | 65 | 1106 |
| 75–79 | 102 | 179 | 91 | 29 | 401 |
| 80–84 | 23 | 42 | 32 | 7 | 104 |
| 85–89 | 2 | 5 | 4 | 2 | 13 |
| 90+ | 0 | 1 | 0 | 0 | 1 |
| Total | 8920 | 11,454 | 9020 | 3291 | 32,685 |
Age and density
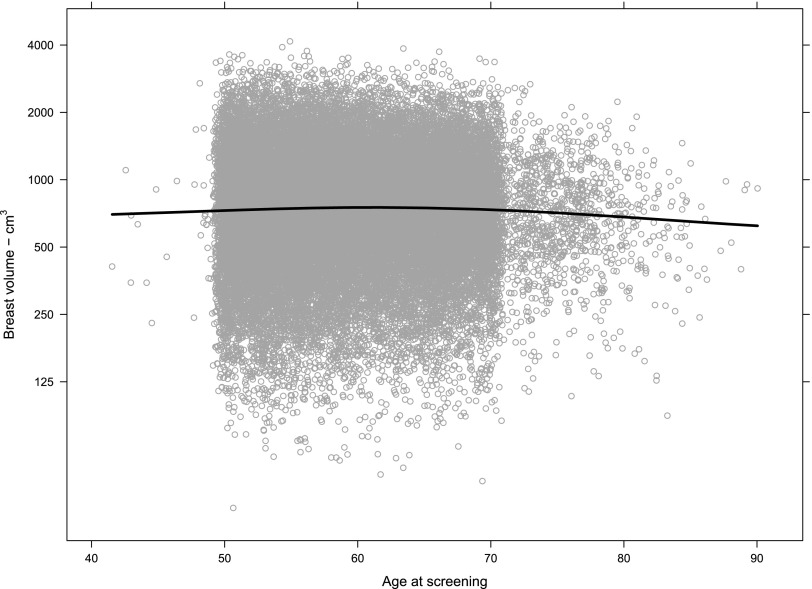
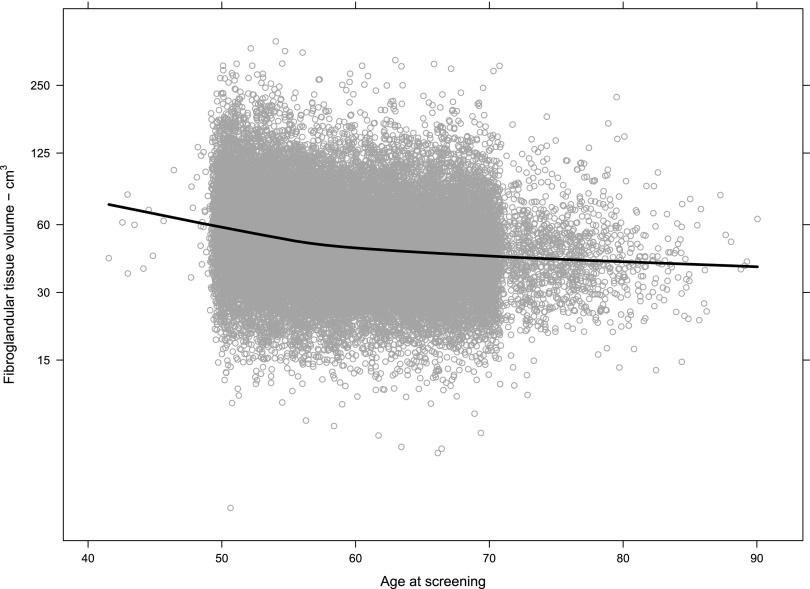
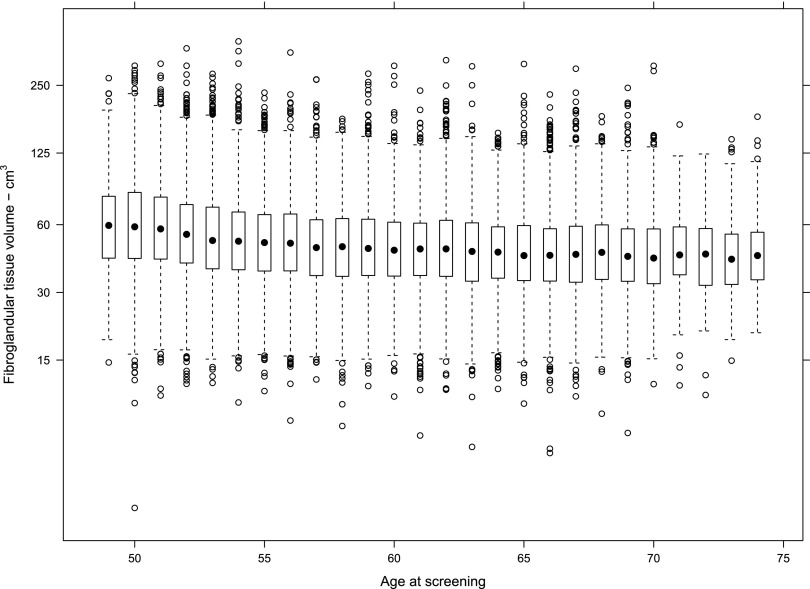
The χ2 test provided strong evidence against the null hypotheses of no association between BD and age. BD was plotted vs age for BV, FGV and %BD for the population. Table 1 demonstrates the complete numerical breakdown for Volpara Grades for all cases by age range. Overall, 8920/32,685 (27%) of females had Volpara Grade 1 breasts, 11,454/32,685 (35%) had Volpara Grade 2 breasts, 9020/32,685 (28%) had Volpara Grade 3 breasts and 3291/32,685 (10%) had Volpara Grade 4 breasts. Females in the 56–64 age range of the population had slightly higher overall BV as estimated by Volpara (Figure 3), but half of the population had a BV between 500 and 1000 cm3 regardless of age. FGV (estimated by Volpara) was also distributed similarly regardless of age, although a decrease in FGV was noted as screening population age increased (Figure 4). However, although the median FGV was higher in younger females, variability of the measurements was similar for each age group (Figure 5).
Figure 3.
Breast volume (estimated by Volpara) by age at screening (n = 32,685). Each circle represents one case measurement. The line is a LOESS smoother for the data and shows that the central tendency is very slightly higher in the age range 56–64 years. The volume measurements are right skewed, so they are shown on a log scale to produce an approximately normal distribution on each chart.
Figure 4.
Fibroglandular tissue volume (estimated by Volpara) by age at screening (n = 32,685). Each circle represents one measurement; the line is a LOESS smoother for the data and shows that the central tendency declines most noticeably in the age range 50–60 years. Data are shown on a log scale to produce an approximately normal distribution.
Figure 5.
Fibroglandular tissue volume (FGV) (estimated by Volpara) by age at screening (n = 32,685). Shown on a log scale to produce an approximately normal distribution. The box-and-whisker charts show that the median FGV is higher in younger females, but the variability of the measurements is similar for each age group.
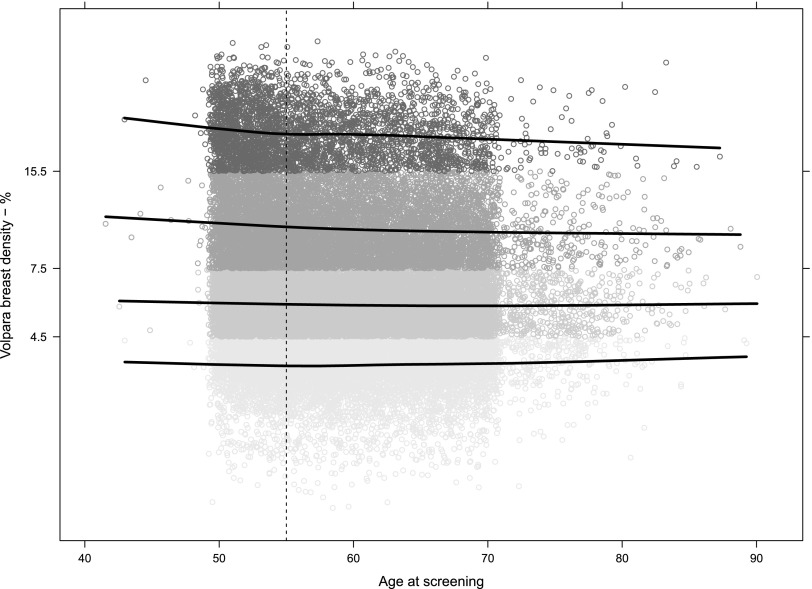
Distribution of %BD including Volpara Grades was also analysed. A negative trend for %BD vs age was noted in females younger than 56 years, most evident for females with Grade 4 breast %BD and to a lesser extent for females with Grade 3 breast %BD (Figure 6). While overall older females in our study generally had fattier breasts than did younger females, as would be expected (62% of females ≤70 years had Volpara Grade 1 and Grade 2 breasts compared with 68% of females ≥71 years), Volpara Grade 4 %BD was still observed in 6.5% of females in the over 70 age group.
Figure 6.
Volpara percentage breast density by age. The data are presented on a log scale to get a normal distribution. The y-axis tick labels and the shades indicate the density group: <4.5% = Grade 1, 4.5–7.5% = Grade 2, 7.5–15.5% = Grade 3 and >15.5% = Grade 4. Grade 2 is approximately twice as dense as Grade 1 and so on. The lines are LOESS smoothers for each grade. They show that the tendency for younger females to have denser breasts is more obvious in Grades 3 and 4. Above age 55 years (marked with the vertical dashed line), the tendencies are less clear.
Density and ethnicity
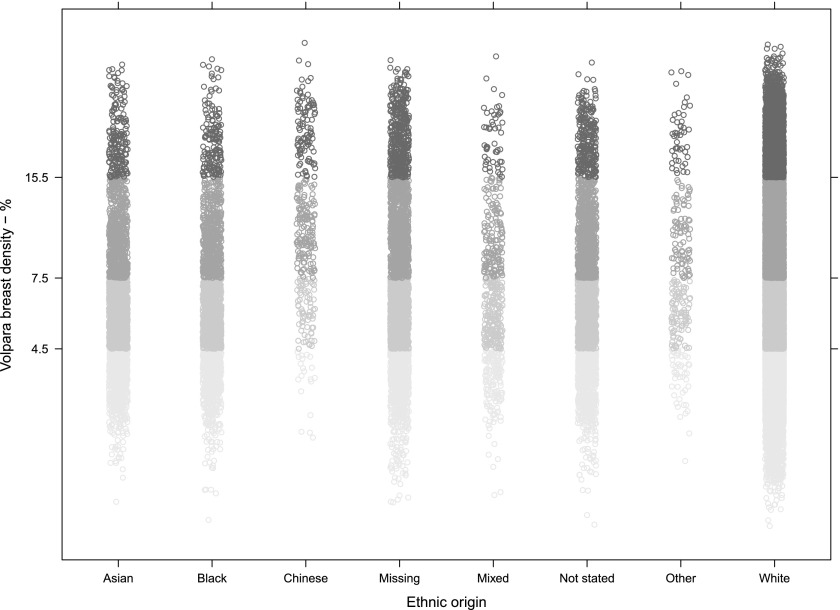
We determined the mean range of BV, FGV and %BD for each self-reported ethnicity group (Table 2). The majority of females (64%; 20,898/32,685) recorded their ethnicity as white. Females of Chinese ethnicity had significantly the highest range of %BD (7.3–17.0) and significantly the lowest BV (270–560 cm3) (p < 0.001) (Table 2). Black females had significantly higher BV as compared with other groups (640–1400 cm3), but also higher FGV (44–77 cm3). Thus, this group's BD does not appear to differ substantially from the rest of the cohort. The χ2 test provided strong evidence against the null hypotheses of no association between BD and the ethnic group (Figure 7). The association between age and density discussed above was broadly similar in each ethnicity group.
Table 2.
Breast volume (BV), fibroglandular tissue volume (FGV) and % density by the ethnic groupa
| Ethnic group | Count | BV (cm3) | FGV (cm3) | Density (%) |
|---|---|---|---|---|
| White | 20,898 | 480–1100 | 35–64 | 4.4–9.7 |
| Missing | 3041 | 490–1100 | 39–74 | 4.5–11.0 |
| Asian | 2744 | 520–1000 | 34–59 | 4.3–8.4 |
| Not stated | 2695 | 500–1100 | 37–67 | 4.3–9.4 |
| Black | 2173 | 640–1400 | 44–77 | 4.3–8.5 |
| Mixed | 521 | 540–1200 | 37–68 | 4.3–9.2 |
| Chinese | 340 | 270–560 | 28–60 | 7.3–17.0 |
| Other | 273 | 380–840 | 34–64 | 5.2–12.0 |
| Total | 32,685 | 490–1100 | 36–65 | 4.4–9.7 |
Half the females in each group are in each range, a quarter are lower and a quarter higher. “Missing” means no ethnic group was recorded; “Not stated” means female chose not to state.
The ranges are interquartile ranges rounded to two significant figures.
Figure 7.
Volpara percentage breast density by ethnic group. The data are presented on a log scale to get a normal distribution. The y-axis tick labels and the shades of grey indicate the density group: below 4.5% is Grade 1, 4.5–7.5% Grade 2, 7.5–15.5% Grade 3 and Grade 4 above that.
Density and deprivation index
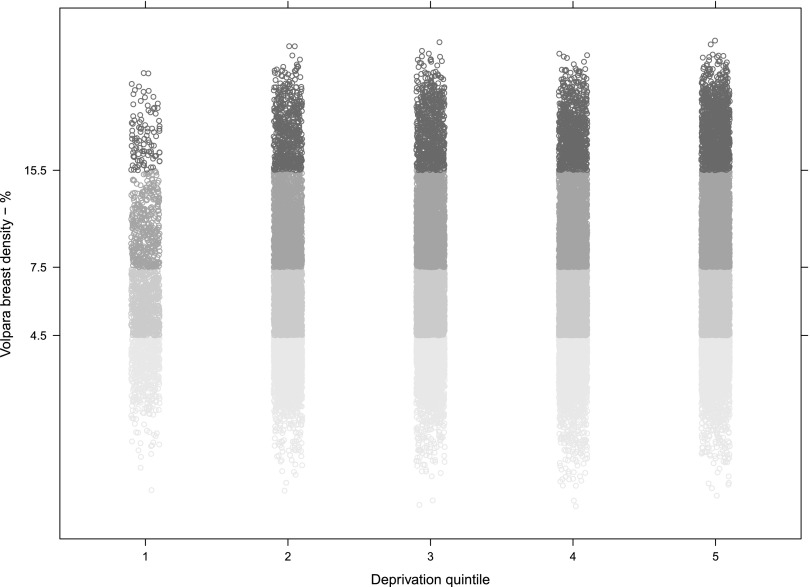
BD was categorized according to deprivation data divided into quintiles (1–5, most deprived to least deprived). In our population, females in the most deprived quintiles tended to have larger and therefore less dense breasts (Figure 8). The χ2 test provided strong evidence against the null hypotheses of no association between BD and deprivation. The association between age and density discussed above was broadly similar in each deprivation quintile.
Figure 8.
Volpara percentage breast density by deprivation quintile. The data are again presented on a log scale to get a normal distribution. The y-axis tick labels and the shades of grey indicate the density group: below 4.5% is Grade 1, 4.5–7.5% Grade 2, 7.5–15.5% Grade 3 and Grade 4 above that. The x-axis shows the deprivation quintile as defined by the UK Office for National Statistics; quintile 1 defined to be the most deprived, quintile 5 is the least deprived.
DISCUSSION
BD is a known risk factor for breast cancer.5,6,17,18 A variety of studies have suggested that certain demographic factors may be predictive of BD, and therefore, of breast cancer risk.8,19–21 Our study focuses on teasing out the relationship between density and those demographic characteristics, which are readily obtainable through our screening programme records, specifically, age, ethnicity and socioeconomic status/deprivation index.
Importantly, this study is not a longitudinal study; instead, it offers a snapshot view of density in a screening population at one moment in time. It is also worth noting that we did not obtain data for the population on factors which are known to influence risk, including hormone replacement therapy (HRT) status, parity, previous history of atypia or high-risk lesion, history of previous breast cancer etc. However, such information may not always be available in a real-time clinical scenario; our purpose was therefore to evaluate the feasibility of acquiring and analysing population density in relationship to demographic information that was readily available to us as part of the routine screening examination.
Age and density
An overall negative association between age and BD has been shown in other studies.22 Our study population demonstrates overall little difference for BV with respect to age, particularly in the post-menopausal age group. A slight negative trend was noted when FGV was evaluated vs age as would be expected. This downward trend is visible only before age 56 years, a finding that may arise from a perimenopausal/post-menopausal divide. Analysis of percentile density measurements with respect to age showed that the proportion of females with the fattiest breasts (Volpara Grade 1) was surprisingly slightly lower in older females (≥71 years) than in younger females (≤70 years) (25% vs 27%), probably owing to the self-referring nature of this older population. It is also important to note, however, that there are females with very high BD (Volpara Grade 4) in all age groups, even in older age groups. This has been noted in other studies and may have implications for a female's lifetime risk of breast cancer.22
Our findings may also result from the characteristics of our particular study population. UK screening parameters entail a narrower standard screening band than many screening programmes; females of average risk are invited for screening between ages 50 and 70 years (although in practice, a female may be 49 years at her initial screen). Females younger than 49 years would usually be of higher than normal risk and therefore on specialized screening protocols; this group makes up only a tiny fraction of the overall study group. Females older than 70 years would be self-referred and also represent a relatively small percentage of the overall screening population.
There may also be specific historical lifestyle influences at play. For example, it has been suggested that post-World War II rationing, which persisted through the 1950's in Britain, may have impacted on factors such as fat consumption, which could affect BD in the older cohort.23 Oral contraceptive use, on the other hand, with its potential impact on BD, would only apply to the younger members of the cohort.20 HRT was introduced in the 1940's and became widely used in the 1960's, but after the 2002 US Females's Health Initiative randomized clinical trial and the 2003 UK Million Females observational study brought up concerns regarding HRT safety, HRT use decreased.24 These changes may also have had impact on our cohort.
Ethnicity and density
In our study, density patterns emerged in certain ethnic groups, consistent with the literature.8,21,25 In particular, females of Chinese ethnicity had higher BD, but this largely reflects the lower BV of this group compared with other ethnic groups. Black females had higher BV range than other ethnic groups, but %BD was not higher. Age did not impact on ethnic group densities.
Deprivation and density
Females in the most deprived quintile tended to have larger and less dense breasts, and females in the least deprived quintiles had denser breasts. This is consistent with other studies, which have identified a positive association between socioeconomic status and BD for females of the highest educational level and for those living in the most affluent areas. This is generally attributed to the lower body mass index (BMI) of an affluent population.9 Our observation that there is a decrease in proportion of females with fatty BD in the older population may represent a preferential self-referral rate from more affluent socioeconomic groups, a hypothesis, which could be explored in future studies.
Limitations
Our study was limited by several factors. Volpara analysis was not available for all screening sites during our study period as the raw data were not transferrable from certain mammography units. As stated above, we were not able to ascertain specific factors with impact on density (use of HRT, menopausal status etc.). Again, these factors may well be obtainable in a research context, but such data collection is not necessarily feasible within the confines of a mass population and a large screening practice. Another limitation is the lack of information regarding BMI. Some demographic and density studies have taken into account BMI, either by collecting this data from participants or by performing BMI estimation, for example, using the volume of non-dense tissue as a stand-in for BMI.8,19 We have not employed such a proxy, although we did evaluate the impact of overall BV. However, again, we submit that in a practical context, it is difficult to acquire BMI data in a population screening programme. Our study is therefore valuable as a practical investigation of what information may be readily available in a real-time setting. Finally, our study is limited by variation in patient demographics. For example, Chinese females comprise only a small percentage of our study sample. And as described earlier in the article, females aged above 70 years must invite themselves to attend screening. This age group represents only a small and self-selected percentage of the total, which may bias the results. In addition, we were limited by available raw data from our screening mammography units (five out of eight machines). However, it is known that there is considerable local variation in ethnicity across London owing to immigration patterns and hence ethnicity in particular may vary with machine just as the ethnic mix of our total screening population would not be identical to a neighbouring screening population. Certainly, the age profile in our population is similar to whole population, indicating there is unlikely to be any other bias apart from geographical location.
Future directions
Our study suggests that age, ethnicity and socioeconomic status may have impact on BD with relevance for identification of future cancer risk. This is particularly timely in light of the recently published Report of the Working Party for Higher Risk Breast Screening.26 The Working Party has recommended an extended screening programme for females at elevated relative risk of developing breast cancer (3 to 7× that of the general population). For females at high–moderate risk, 18-month interval screens are recommended on the basis of anticipated mortality benefit. As the article notes, the task of identifying such females is not always straightforward. For females who do not have an obvious source of elevated risk (family history, for example), it can be difficult to know who would benefit from increased surveillance. Yet, the article also makes clear that identifying the appropriate groups should be approached practically and without adopting complicated unwieldy protocols. BD is one factor in evaluating risk that is readily available at the moment of screening. A history of high-risk/atypical (B3) lesions is another such factor that could be readily identified in the course of a screening programme.
Our study is observational and we have not promoted or evaluated a particular risk model based on our findings. However, this demonstration of a means of practically and relatively easily evaluating density data for a screening population may be helpful in considerations of how to implement a broader risk evaluation programme.
Acknowledgments
ACKNOWLEDGMENTS
The authors gratefully acknowledge Toby Thurston, MA BSc, FIET, for his work on the Tables and Figures and for his many helpful comments and suggestions.
Contributor Information
Samantha L Heller, Email: sheller2005@gmail.com.
Sue Hudson, Email: sue.hudson@pasconsulting.co.uk.
Louise S Wilkinson, Email: Louise.Wilkinson@stgeorges.nhs.uk.
REFERENCES
- 1.Cancer Research UK. [Updated 20 February 2015; accessed 9 September 2015]. Available from: http://www.cancerresearchuk.org/health-professional/cancer-statistics/statistics-by-cancer-type/breast-cancer/mortality#heading-zero
- 2.Pace LE, Keating NL. A systematic assessment of benefits and risks to guide breast cancer screening decisions. JAMA 2014; 311: 1327–35. doi: 10.1001/jama.2014.1398 [DOI] [PubMed] [Google Scholar]
- 3.Onega T, Beaber EF, Sprague BL, Barlow WE, Haas JS, Tosteson AN, et al. Breast cancer screening in an era of personalized regimens: a conceptual model and National Cancer Institute initiative for risk-based and preference-based approaches at a population level. Cancer 2014; 120: 2955–64. doi: 10.1002/cncr.28771 [DOI] [PMC free article] [PubMed] [Google Scholar]
- 4.Venturini E, Losio C, Panizza P, Rodigherio MG, Fedele I, Tacchini S, et al. Tailored breast cancer screening program with microdose mammography, US, and MR Imaging: short-term results of a pilot study in 40-49-year-old women. Radiology 2013; 268: 347–55. doi: 10.1148/radiol.13122278 [DOI] [PubMed] [Google Scholar]
- 5.Boyd NF, Guo H, Martin LJ, Sun L, Stone J, Fishell E, et al. Mammographic density and the risk and detection of breast cancer. N Engl J Med 2007; 356: 227–36. doi: 10.1056/NEJMoa062790 [DOI] [PubMed] [Google Scholar]
- 6.Boyd NF, Martin LJ, Yaffe MJ, Minkin S. Mammographic density and breast cancer risk: current understanding and future prospects. Breast Cancer Res 2011; 13: 223. doi: 10.1186/bcr2942 [DOI] [PMC free article] [PubMed] [Google Scholar]
- 7.Heine JJ, Malhotra P. Mammographic tissue, breast cancer risk, serial image analysis, and digital mammography. Part 2. Serial breast tissue change and related temporal influences. Acad Radiol 2002; 9: 317–35. doi: 10.1016/S1076-6332(03)80374-4 [DOI] [PubMed] [Google Scholar]
- 8.Ellison-Loschmann L, McKenzie F, Highnam R, Cave A, Walker J, Jeffreys M. Age and ethnic differences in volumetric breast density in new zealand women: a cross-sectional study. PLoS One 2013; 8: e70217. doi: 10.1371/journal.pone.0070217 [DOI] [PMC free article] [PubMed] [Google Scholar]
- 9.Viel JF, Rymzhanova R. Mammographic density and urbanization: a population-based screening study. J Med Screen 2012; 19: 20–5. doi: 10.1258/jms.2011.011112 [DOI] [PubMed] [Google Scholar]
- 10.Redondo A, Comas M, Macia F, Ferrer F, Murta-Nascimento C, Maristany MT, et al. Inter-and intraradiologist variability in the BI-RADS assessment and breast density mammograms. Br J Radiol 2012; 85: 1465–70. doi: 10.1259/bjr/21256379 [DOI] [PMC free article] [PubMed] [Google Scholar]
- 11.Gard CC, Aiello Bowles EJ, Miglioretti DL, Taplin SH, Rutter CM. Missclassification of Breast Imaging Reporting and Data System (BI-RADS) Mammographic Density and Implications for Breast Density Reporting Legislation. Breast J 2015; 21; 481–9. doi: 10.1111/tbj.12443 [DOI] [PMC free article] [PubMed] [Google Scholar]
- 12.Eng A, Gallant Z, Shepherd J, McCormack V, Li J, Dowsett M, et al. Digital mammographic density and breast cancer risk: a case inverted question markcontrol study of six alternative density assessment methods. Breast Cancer Res 2014; 16: 439. doi: 10.1186/s13058-014-0439-1 [DOI] [PMC free article] [PubMed] [Google Scholar]
- 13.Mclennan D, Barnes H, Noble M, Davies J, Garrett E, Dibben C. The English Indices of Deprivation 2010. London, UK: Crown; 2011. [Google Scholar]
- 14.R core team. R: A language and environment for statistical computing. R Foundation for Statistical Computing. Vienna, Austria: R Foundation for Statistical Computing; 2014. [Google Scholar]
- 15.Walker A. openxlsx: read, write and edit xlsx files. R package version 2.2.1. Vienna, Austria: R Foundation for Statistical Computing; 2014. [Google Scholar]
- 16.Sarkar D. Lattice: multivariate data visualization with R. New York, NY: Springer; 2008.
- 17.Yaffe M, Boyd N. Mammographic breast density and cancer risk: the radiological view. Gynecol Endocrinol. 2005; 21(Suppl. 1): 6–11. doi: 10.1080/09513590400030053 [DOI] [PubMed] [Google Scholar]
- 18.Phipps AI, Buist DS, Malone KE, Barlow WE, Porter PL, Kerlikowske K, et al. Breast density, body mass index, and risk of tumor marker-defined subtypes of breast cancer. Ann Epidemiol 2012; 22: 340–8. doi: 10.1016/j.annepidem.2012.02.002 [DOI] [PMC free article] [PubMed] [Google Scholar]
- 19.Aitken Z, Walker K, Stegeman BH, Wark PA, Moss SM, McCormack VA, et al. Mammographic density and markers of socioeconomic status: a cross-sectional study. BMC Cancer 2010; 10: 35. doi: 10.1186/1471-2407-10-35 [DOI] [PMC free article] [PubMed] [Google Scholar]
- 20.Dorgan JF, Klifa C, Deshmukh S, Egleston BL, Shepherd JA, Kwiterovich PO, et al. Menstrual and reproductive characteristics and breast density in young women. Cancer Causes Control 2013; 24: 1973–83. doi: 10.1007/s10552-013-0273-2 [DOI] [PMC free article] [PubMed] [Google Scholar]
- 21.McCormack VA, Perry N, Vinnicombe SJ, dos Santos Silva I. Ethnic variations in mammographic density: a British multiethnic longitudinal study. Am J Epidemiol 2008; 168: 412–21. doi: 10.1093/aje/kwn169 [DOI] [PubMed] [Google Scholar]
- 22.Checka CM, Chun JE, Schnabel FR, Lee J, Toth H. The relationship of mammographic density and age: implications for breast cancer screening. AJR Am J Roentgenol 2012; 198: W292–5. doi: 10.2214/AJR.10.6049 [DOI] [PubMed] [Google Scholar]
- 23.Stephen AM, Sieber GM. Trends in individual fat consumption in the UK 1900-1985. Br J Nutr 1994; 71: 775–88. doi: 10.1079/BJN19940183 [DOI] [PubMed] [Google Scholar]
- 24.Women's Health Concern. [Updated 8 January 2015; accessed 9 September 2015]. Available from: http://www.womens-health-concern.org/help-and-advice/factsheets/hrt-know-benefits-risks/
- 25.Ursin G, Ma H, Wu AH, Bernstein L, Salane M, Parisky YR, et al. Mammographic density and breast cancer in three ethnic groups. Cancer Epidemiol Biomarkers Prev 2003; 12: 332–8. [PubMed] [Google Scholar]
- 26.Report of the working party for higher-risk breast screening. Public Health England. 2015. [Cited July 2015; accessed 9 September 2015]. Available from: http://www.cancerscreening.nhs.uk/breastscreen/publications/report-working-party-higher-risk-breast-screening.pdf


