

Abstract
The electrochemical properties of Shewanella oneidensis cytochrome c nitrite reductase (ccNiR), a homodimer that contains 5 hemes per protomer, were investigated by UV/Visible and EPR spectropotentiometries. Global analysis of the UV/Vis spectropotentiometric results yielded highly reproducible values for the heme midpoint potentials. These midpoint potential values were then assigned to specific hemes in each protomer (as defined in previous X-Ray diffraction studies) by comparing the EPR and UV/Vis spectropotentiometric results, taking advantage of the high sensitivity of EPR spectra to the structural microenvironment of paramagnetic centers. Addition of the strong-field ligand cyanide led to a 70 mV positive shift of the active site’s midpoint potential, as the cyanide bound to the initially 5-coordinate high-spin heme and triggered a high-spin to low-spin transition. With cyanide present three of the remaining hemes gave rise to distinctive and readily assignable EPR spectral changes upon reduction, while a fourth was EPR silent. At high applied potentials interpretation of the EPR spectra in the absence of cyanide was complicated by a magnetic interaction that appears to involve three out of five hemes in each protomer. At lower applied potentials the spectra obtained in the presence and absence of cyanide were similar, which aided global assignment of the signals. The midpoint potential of the EPR-silent heme could be assigned by default, but the assignment was also confirmed from UV/Vis spectropotentiometric analysis of the H268M mutant of ccNiR, in which one of the EPR-silent heme’s histidine axial ligands was replaced with a methionine.
TOC image
Correlations between the electronic properties of Shewanella oneidensis cytochrome c nitrite reductase (ccNiR) and its structure: effects of heme oxidation state and active site ligation Natalia Stein, Daniel Love, Evan T. Judd, Sean J. Elliott, Brian Bennett, A. Andrew Pacheco

Introduction
Cytochrome c nitrite reductase (ccNiR) is a soluble periplasmic bacterial enzyme that catalyzes the 6-electron reduction of nitrite to ammonia(1), and can also catalyze reduction of NO or hydroxylamine to ammonia(2, 3). The active protein is a homodimer, which depending on the organism from which it is obtained, has protomeric molecular masses ranging from 52 to 65 kDa(4–10). In all homologues studied so far each protomer contains five c-type hemes, four of which are six-coordinate, bis-histidine ligated and low-spin, and the fifth of which is five-coordinate high-spin, and unique among c-hemes in having a lysine residue in the proximal axial position (Fig. 1). The hemes in ccNiR are closely packed, with iron-iron distances of <13 Å, which facilitates rapid inter-heme electron transfer. Thus, the 6-coordinate hemes appear to act as electron shuttles that efficiently carry electrons from the enzyme’s external physiological electron donor to the five-coordinate active site where nitrite reduction occurs(4–10).
Figure 1.

The five hemes from one of the ccNiR protomers and their axial ligands, with axial ligand His 268 that was subjected to mutagenesis identified. The dashed vertical line represents a dimer interface for the complete dimer. The hemes are color-coded to match spectral assignments made in the main text and Table 2.
Ammonifying bacteria use ccNiR to reduce the terminal electron acceptor nitrite in anaerobic respiration(1, 11, 12), and this appears to be the enzyme’s primary role. However, there is also some evidence that ccNiR has a role in mitigating oxidative and nitrosative stress, not just in response to nitrite, but also to NO, hydroxylamine and even hydrogen peroxide(2, 6, 13, 14). This hypothesis has been reinforced by the isolation of a ccNiR ortholog and a related nitrite reducing multi-heme protein from bacteria that are incapable of dissimilatory nitrite reduction(6, 14).
Many aspects of the heme arrangement within ccNiR are replicated in other proteins(15, 16), and how a common structural motif is optimized for specialized roles is a subject of much investigation. For example, comparative mechanistic studies of ccNiR and Nitrosomonas europaea hydroxylamine dehydrogenase (HDH1), a multi-heme enzyme which catalyzes the oxidation of hydroxylamine to nitrite in ammonia oxidizing bacteria(11, 12), have been carried out in order to understand how ccNiR and HDH have been evolutionarily optimized to catalyze similar reactions in opposite directions(10, 17–19). Ultimately, meaningful interpretation of mechanistic data for ccNiR and HDH requires that the redox properties of the enzymes under reaction conditions of a given study be thoroughly understood. This article presents UV/Vis and EPR spectropotentiometric studies of wild type ccNiR from Shewanella oneidensis in the presence and absence of the strong-field ligand cyanide, and a UV/Vis spectropotentiometric analysis of the H268M ccNiR mutant (Fig. 1). CcNiR’s physiological substrate nitrite is a strong-field ligand, and the major objective of these studies was to determine the effect of such ligands on the enzyme’s midpoint potentials. In addition to addressing this question, the combined studies led to the assignment of all of S. oneidensis ccNiR’s heme midpoint potentials.
Materials and Methods
General materials
Potassium cyanide, sodium nitrite, ethylenediaminetetraacetic acid disodium salt (EDTA), anthroquinone-2-sulfonic acid sodium salt monohydrate, methyl viologen hydrate and safranine-O were purchased from Acros Organics. Anthroquinone-1,5-disulfonic acid disodium salt hydrate, hexaammineruthenium(III) chloride, potassium indigo trisulfonate, potassium indigo tetrasulfonate and indigo carmine were purchased from Sigma-Aldrich. Sodium chloride and 2-[4-(2-hydroxyethyl)-piperazin-1-yl]ethanesulfonic acid (HEPES) sodium salt were from Fisher Scientific. The mediator Diquat (6,7-dihydrodipyrido[1,2-a:2′,1′-c]pyrazinediium dibromide, Table 1) was synthesized using the method described by Homer and Tomlinson(20).
Table 1.
Mediators used for spectropotentiometry
| Mediator | ɛ° (V vs SHE) | Used for | Concentration (μM) |
|---|---|---|---|
| Phenazine methosulfate | 0.08 | UV/Vis | 25 |
| Gallocyanin | −0.020 | EPR | 25 |
| Hexaammineruthenium(III) chloride | −0.020 | UV/Vis | 100 |
| Indigo tetrasulfonate | −0.030 | EPR | 25 |
| Indigo trisulfonate | −0.080 | EPR | 25 |
| Indigo carmine | −0.125 | UV/Vis, EPR | 25 |
| Anthraquinone 1,5-disulfonic acid | −0.175 | UV/Vis, EPR | 25 |
| Anthraquinone 2-sulfonic acid | −0.255 | UV/Vis, EPR | 25 |
| Safranine O | −0.289 | UV/Vis, EPR | 25 |
| Diquata | −0.390 | UV/Vis, EPR | 25 |
| Methyl viologen | −0.449 | UV/Vis, EPR | 25 |
Diquat:

Protein purification and handling
Wild type S. oneidensis ccNiR (ccNiRwt) was purified from a high yield expression system, and stored in aliquots at −80 °C, as described previously(10).
To ensure that the H268M mutant of ccNiR (ccNiRH268M) could be readily separated from the constitutively expressed wild type enzyme, S. oneidensis TSP-C was transformed with a TEV cleavable 10-histidine tag (C-terminal) in PHSG298(21). The H268M mutation was then introduced using an Agilent QuikChange Lightning site-directed mutagenesis kit with the primers 5′GAGACCTGGAAGATGGGCATCATGGGTAAAAATAACGTCTCGTGT3′ and 5′ACACGAGACGTTATTTTTACCCATGATGCCCATCTTCCAGGTCTC3′. The mutation was verified by sequencing. Transformed cells were grown in 1L batches of LB medium at 30°C for 24 hours, after which ccNiRH268M was purified using a Ni-6-Sepharose column (GE Healthcare), and the His tag removed by overnight digestion with recombinant TEV protease, as described previously(22).
UV/Vis spectropotentiometric titrations of ccNiR
UV/Vis spectropotentiometry experiments were performed using a BASi Epsilon EC potentiostat to set the potential, and a CARY Bio 50 UV/Vis spectrophotometer to obtain the spectra at each applied potential. The complete apparatus was housed in an anaerobic glove box. Controlled potentiometric electrolysis of the solution was performed in an optically transparent thin-layer electrode cell similar to one used in earlier work by this group (10), and elsewhere (23, 24). A solution of ccNiR (25 – 30 μM dimer) and redox mediators (Table 1) was prepared in 50 mM HEPES, 200 mM NaCl, pH 7.0. UV/Vis spectra in the range 250 – 800 nm were collected at 10 mV intervals between +50 mV and −600 mV (vs. SHE). An Ag/AgCl electrode (BASi, Model RE-5B) was used as a reference. Cyclic voltammograms of methyl viologen were collected before and after collecting the datasets, and the calculated midpoint potential (ɛ0m = −0.449 V(25)) was used to account for any drift in the reference electrode. Spectra collected with the mediator solutions in the absence of ccNiR were subtracted from the corresponding ccNiR data sets to account for any spectral changes due to the mediators during the titration. The corrected data sets were analyzed using programs written within the commercially available software package Mathcad 15 (PTC Software). Data analysis broadly followed the methodology used previously by this group(10); details specific to this work are provided in the Results and in Supporting Information.
Electron paramagnetic resonance (EPR) titrations of ccNiR. EPR spectra were recorded on an EleXsys E600 spectrometer (Bruker), equipped with an ER4122SHQ resonator, an Oxford Instruments ITC503 temperature controller and ESR900 helium flow cryostat (Oxford Instruments). A microwave frequency of 9.386 GHz was employed; precise frequencies were recorded for each spectrum by a built-in microwave counter. Background signals were recorded on a frozen water sample and subtracted in Xepr (Bruker Biospin) with small field corrections for slight frequency differences. Magnetic field modulation and phase-sensitive detection at100 kHz were employed, with 5 G (0.5 mT) field modulation amplitude; other recording parameters (time constant, conversion time) were chosen such that the resolution was limited by the modulation amplitude. A microwave power of 1 mW and temperature of 10 K were employed. At higher power (e.g. 5 mW) rapid passage effects were clearly evident in the spectra, whereas at lower power or higher temperatures the spectra were either unacceptably noisy or certain features were relaxation-broadened beyond detection. The combination of 1 mW at 10 K with the high-Q resonator thus provided the best compromise. Typical ccNiR concentrations for the experiments were 25 – 30 μM in dimer. For EPR-spectropotentiometric titrations the samples were prepared using a bulk electrolysis cell with platinum mesh as the working electrode. In a typical experiment 4 mL of ccNiR solution were added to the bulk electrolysis cell. The sample was stirred rapidly, and the desired potential was applied. Upon stabilization, a 250 μl subsample was removed from the cell and transferred into an EPR tube. The EPR tube was then placed into a test tube, which was stoppered with a butyl rubber stopper, removed from the glove box, and immediately submerged in liquid nitrogen. Samples were subsequently stored at −80 °C, and kept on dry ice during transportation (< 8 h).
Results
Effect of cyanide on the electrochemical properties of ccNiR
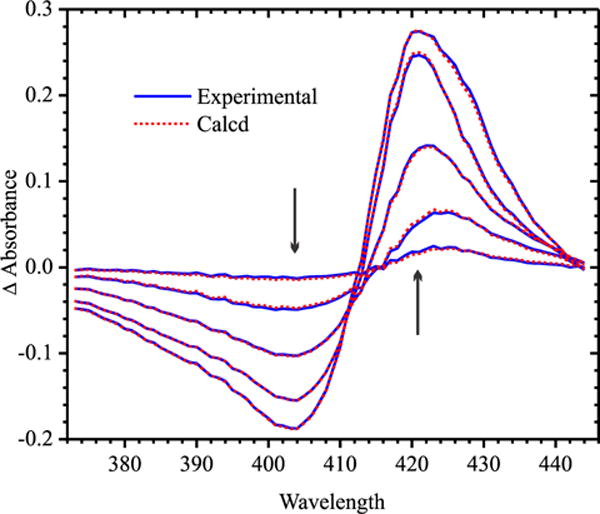
Figure 2 shows selected UV/Visible spectral changes observed upon decreasing the potential applied to a solution initially containing 23.3 μM fully oxidized ccNiR dimer and 75 μM cyanide. Singular value decomposition (SVD) analysis (26, 27) showed that five components contribute to the spectral changes. The data were well-fit using a model in which each protomer of the ccNiR dimer is successively reduced in 1-electron increments, as shown in Scheme 1 and Eqs. 1, 2, whose complete derivation can be found in ref.(10). Equations 1a, 1b and 1c are derived from the Nernst equation in exponential form, and correlate the concentration of each partially reduced species Cred(m) with the applied potential, ɛapp. In the equations ɛ0m is the midpoint potential associated with one-electron reduction of the (m − 1)th reduced species, and CT is the total ccNiR concentration in solution. For the data of Fig. 2 the best fit was obtained by setting n, the number of electrons transferred in each reduction event, to one. Equation 2 is a matrix form of Beer’s law in which Cred is a matrix of concentrations wherein each column corresponds to a unique reduced species Cred(m), and each row to a specific applied potential; Δɛ is an extinction coefficient difference matrix in which each column corresponds to a unique reduced species and each row to a wavelength; ΔA is the SVD-processed absorbance difference matrix in which each column contains a spectrum at a fixed applied potential, and each row shows how absorbance varies with potential at a fixed wavelength; and l is a scalar representing the path length of the OTTLE cell. The procedure by which the Fig. 2 data were fit with Eqs. 1 and 2 was analogous to one described previously(10), and the calculated least-squares best fits are overlaid on the experimental data in Fig. 2. The fitting procedure yielded extinction coefficient difference spectra for the ccNiR species Cred1 – Cred5 at varying stages of reduction (Fig. 3a), and the concentrations of the partially reduced species as a function of applied potential (Fig. 3b).
Figure 2.
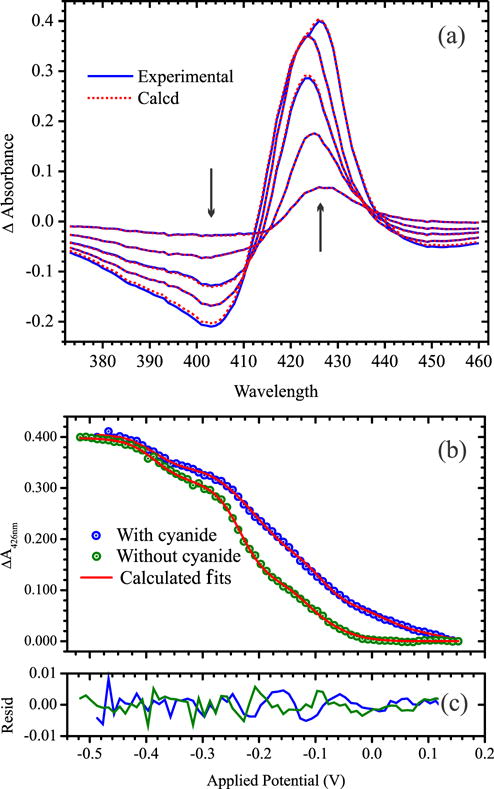
(a) UV/Vis spectral changes obtained upon exposing a solution initially containing 23.3 μM of fully oxidized ccNiR dimer and 75 μM cyanide to applied potentials of −27, −137, −217, −317, and −487 mV vs SHE; arrows indicate the direction of change. Solid blue lines show the experimentally obtained data, whereas the dashed red lines were calculated from least-squares fitting to five Nernstian potentials (Scheme 1 and Eqs. 1 and 2), as described in ref.(10). (b) Blue circles: an absorbance difference vs. applied potential slice taken at 426 nm from the spectra of part (a); green circles: an equivalent slice obtained from a global fit of the spectral changes accompanying potentiometric reduction of a 23.3 μM solution of ccNiR dimer in the absence of cyanide (spectral changes are provided as Supporting Information). In both cases the solid red traces are the least-squares best fits obtained from a global analysis of the data. (c) Residuals for (b).
Scheme 1.
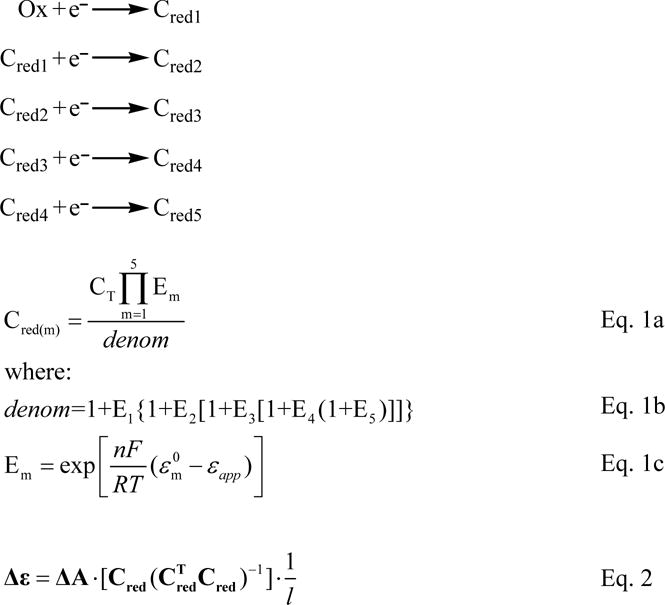
Definition of the species used in Eqs. 1 and 2. Ox refers to fully oxidized ccNiR, as isolated from the purification process. Cred1 – Cred5 refer to the one-electron-reduced to five-electron-reduced species, respectively.
Figure 3.
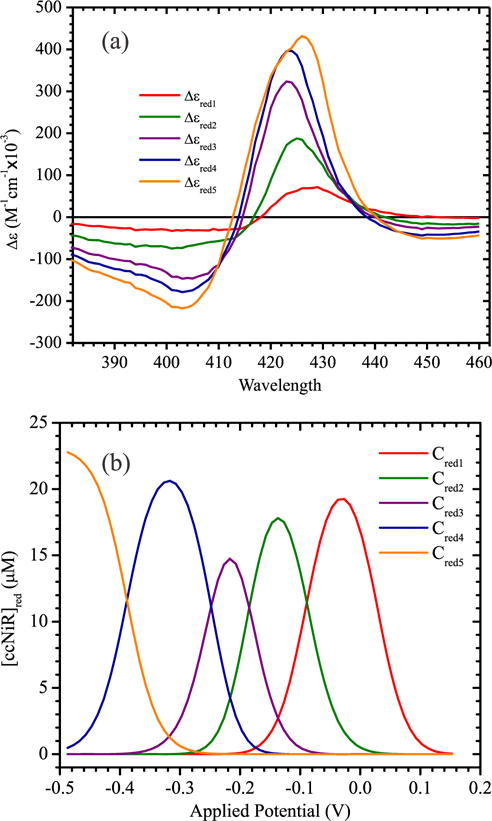
(a) Extinction coefficient difference spectra corresponding to each of the reduced ccNiR species Cred1 – Cred5 (Scheme 1), as calculated Using Eqs. 1 and 2 by the procedure described in ref.(10), for the data obtained in the presence of cyanide (Fig. 2a). (b) Calculated concentrations of Cred1 – Cred5 as a function of the applied potential (vs SHE) for the same data. Both here and in (a) the traces are color coded to match the hemes in Fig. 1 to which they are tentatively assigned (see text for details). Note: the values of Cred1 – Cred5 are given in terms of dimer concentrations, but those of Δɛ are given in terms of the protomer concentrations, to allow direct comparison with earlier reports where this was done (for example in refs.(10, 17)). The amplitudes for the Δɛ spectra corresponding to the ccNiR dimer will be twice those shown in (a).
The model embodied in Scheme 1 and Eqs. 1 and 2 is consistent with the fact that each ccNiR protomer contains five structurally distinct hemes. However, it is important to emphasize that each species Cred(m) reflects only the number of electrons that have been added to the protomer as a whole. In some cases each added electron may end up localized on a specific heme, but the model also allows for the possibility that it will delocalize among several hemes, as has been proposed previously and is discussed further below (10).
The most striking difference observed between data collected in the presence and absence of cyanide is a 70 mV positive shift in the first midpoint potential when cyanide is present. This is seen graphically in Fig. 2b, and also in Table 2, which compare data collected in the presence and absence of cyanide using the same apparatus: the first ccNiR midpoint potential is seen to shift from −44 mV to +27 mV vs SHE in the presence of cyanide. Some variability in the calculated midpoint potentials accompanies changes in apparatus (ref.(10)), but in all cases the characteristic shift to higher potential was observed. Differences in the midpoint potentials associated with the remaining reduction events were much less pronounced (Table 2), from which we conclude that Cred1 in Scheme 1 corresponds to reduction of the active site heme, and that binding of cyanide to this site effects the shift to higher potential.
Table 2.
Midpoint potentials of S. oneidensis ccNiR hemes (in volts vs. the standard hydrogen electrode) for wild type ccNiR (ccNiRwt) in the presence and absence of cyanide, and for the H268M mutant (ccNiRH268M). Colors and the labels H1 – H5 suggest possible assignments to the hemes in Fig. 1; see text for details.
| ccNiRwta | ccNiRwt + CN− | ccNiRH268M | |
|---|---|---|---|
| ɛ01 | −0.0440±002 (H1) | 0.027 (H1) | 0.060 (H5) |
| ɛ02 | −0.110±0.004 (H4) | −0.089 (H4) | −0.035 (H1) |
| ɛ03 | −0.21±0.02 (H2) | −0.185 (H2) | −0.116 (H4) |
| ɛ04 | −0.257±0.017 (H5) | −0.248 (H5) | −0.209 (H2) |
| ɛ05 | −0.382±0.004 (H3) | −0.388 (H3) | −0.338 (H3) |
Average of two experiments performed using the same apparatus, but different ccNiR batches. Experiments obtained using different spectroelectrochemical apparatus, or different techniques, exhibited greater variability in the midpoint potential values obtained (ref(10)).
The spectropotentiometric titrations of ccNiR in the presence and absence of added cyanide were repeated using EPR spectroscopy in place of UV/Vis. EPR spectra are highly sensitive to the hemes’ structural microenvironment, allowing one to readily correlate observed spectral changes to changes at specific hemes.
Figure 4 shows the EPR spectral changes observed when a 25 μM solution of fully oxidized ccNiR dimer was exposed to 100 μM cyanide. Addition of the cyanide extinguished a component of the spectrum that is characterized by a derivative-shaped signal with a trough at g′ = 2.87, and another characterized by EPR absorption extending from zero-field to g′ ≈ 10.2 The latter signal was enhanced in parallel mode (B0‖B1; not shown) and is characteristic of an integer-spin system. These features were previously assigned to the high-spin (S = 5/2) Fe(III) active site, weakly exchange-coupled to one of the low-spin (S = ½) hemes(17), and are similar to those assigned earlier to the active site of Escherichia coli ccNiR(7). The heme closest to the active site heme 1 is heme 3, and in the past it has been assumed that heme 3 and heme 1 are weakly exchange-coupled(7, 17); however, the situation may be more complex, for reasons presented below. The disappearance of the g′ = 2.87 and g′ > 10 signals upon cyanide addition suggests that the strong-field ligand has bound to the active site and caused a high-spin to low-spin transition, consistent with the UV/Vis spectropotentiometric results reported above.
Figure 4.

Blue trace: X-band EPR spectrum for a 25 μM solution of fully oxidized ccNiR dimer; Red trace: same, except that the solution also contained 100 μM cyanide.
The remaining signals in the Fig. 4 spectra can be assigned to low-spin Fe(III) hemes in a variety of environments, by comparison with well-established literature precedents. Three features at gx = 2.94, gy = 2.29 and gz = 1.52 are characteristic of low-spin ferric hemes with imidazoles that are parallel to each other on opposite sides of the heme plane, an arrangement that gives rise to rhombic EPR spectra(7, 29). CcNiR has two such hemes in each protomer: hemes 2 and 3 in Fig. 1, either of which could give rise to a rhombic trio. Notice however that the signals are present both in the presence and absence of cyanide; though the gx = 2.94 feature is mostly hidden by the more intense g = 2.87 trough when cyanide is absent, the features at gy = 2.29 and gz = 1.52 are clearly visible in both of the Fig. 4 spectra. Thus, if in the absence of cyanide hemes 1 and 3 are weakly exchange-coupled as proposed above and in the literature(7, 17), and give rise to the unique set of signals with g′ = 2.87 and g′ > 10, then the rhombic signal set must be due to heme 2 alone.
A final weak feature, seen at g = 3.39 in the presence of cyanide, is characteristic of hemes that are in highly axial environments, to the point where the dxz and dyz orbitals are virtually degenerate and the unpaired electron can be considered to be shared between them. Often referred to as “Highly Axial Low-Spin” (HALS) signals(29–31), these signals are difficult to resolve and usually only the g ~ 3 – 4 signal is detected. HALS-type signals can arise from low-spin ferric hemes with imidazoles perpendicular to each other on opposite sides of the heme plane(7, 29), and/or from hemes with the plane of the axial imidazole(s) meso with respect to the heme nitrogens (i.e. bisecting the N-Fe-N right-angle(32)). In addition, HALS-type signals have also been observed for low-spin ferric heme cyanide model compounds(33). The S. oneidensis ccNiR crystal structure reveals two hemes with imidazoles roughly perpendicular (hemes 4 and 5, Fig. 1). Therefore, the g = 3.39 feature seen in the presence of cyanide could be due to one or more of the ccNiR hemes 4 and 5, and/or the cyanide-bound active site; the spectropotentiometric titration described next allows these possibilities to be distinguished. Note that a feature at almost the same position (g = 3.41) is also seen in the absence of cyanide, but it is significantly more intense than the g = 3.39 feature seen in its presence. One or more HALS-signal-generating hemes almost certainly contribute to this feature, but it seems probable that the weakly exchange-coupled hemes 1 and 3 also contribute, making the signal stronger than is typical.
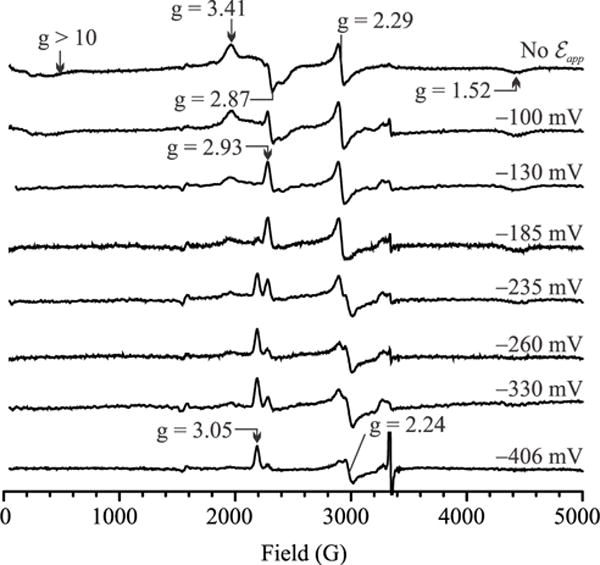
Figure 5 shows the EPR spectral changes observed upon decreasing the potential applied to the solution initially containing 25 μM fully oxidized ccNiR dimer and 100 μM cyanide, in addition to the mediators from Table 1. At an applied potential of 0 mV vs SHE the most notable change is a decrease in the intensity, and shift to slightly higher field, of the g = 3.39 HALS signal. This change is attributed to reduction of the active site heme, on the basis of the UV/Vis spectropotentiometric results of Fig. 2b above that show the cyanide-bound active site reducing with a midpoint potential of +20 mV. The fact that the putative HALS signal doesn’t completely disappear as the active site is reduced confirms that it is actually a composite of at least two overlapping signals, one arising from the active site and the second from one or both of hemes 4 and 5, each of which has mutually perpendicular imidazoles on opposite sides of the heme plane (Fig. 1)(7, 29).
Figure 5.

X-band EPR spectra obtained for a solution initially containing 25 μM of fully oxidized ccNiR dimer and 100 μM cyanide, upon exposing it to the applied potentials shown (vs SHE). An additional signal that grows in at g = 1.31 as the applied potential is decreased can be viewed in an expanded spectrum provided as Supporting Information.
As the potential is decreased further from 0 mV to −377 mV, a second rhombic signal set with gx = 3.07, gy = 2.25 and gz = 1.31 appears, while the residual HALS signal, now with maximum intensity at g = 3.31, disappears concomitantly. In addition the original rhombic signal set with gx = 2.94, gy = 2.30 and gz = 1.51 also gradually fades, though its disappearance lags the appearance of the new rhombic set. As stated above, in ccNiR rhombic signal sets would be expected for magnetically isolated ferric hemes 2 and 3, on the basis of their axial ligand geometry(7, 29). Since the initial gx = 2.94, gy = 2.30 and gz = 1.51 set was assigned to heme 2 above and in previous reports(7, 17), the new rhombic set must arise from heme 3.
The fact that the new rhombic set for heme 3 appears as the second HALS signal disappears can be explained if the residual HALS signal arises from a pair of magnetically coupled ferric hemes rather than from a single heme. In this scenario ferriheme 3 would generate a rhombic signal set, and the adjacent ferriheme 4 a HALS signal, if magnetically isolated, but in practice they couple to generate a HALS-like signal. Then, if the normally HALS-generating heme 4 reduces first, the remaining now-uncoupled but still-oxidized heme 3 will display its typical rhombic signals. By correlating the UV/Vis and EPR results the midpoint potential of heme 4 is thus assigned as −89 mV, the second reduction event listed in Table 2. In the UV/Vis spectropotentiometric results the midpoint potential for the third reduction event is −185 mV, which is assigned to heme 2 since in EPR the disappearance of the heme 2 signal set somewhat lags the appearance of the heme 3 set.
The rhombic signal set attributed to heme 3 is still present at −377 mV, at which applied potential only a single heme (with midpoint potential of −388 mV, Table 2) remains partially oxidized according to the UV/Vis results. Heme 3 is thus seen to be the last one reduced with a midpoint potential of −388 mV. By default, the midpoint potential of −248 mV (Table 2) is then assigned to heme 5. The HALS signal expected for this heme was not detectable; however, a site-directed mutagenesis experiment (described below) provides additional support for the assignment of the −248 mV midpoint potential to heme 5. The color coding of the midpoint potentials listed in Table 2 summarizes their plausible assignments to the hemes in Fig. 1, on the basis of the UV/Vis and EPR spectropotentiometric results.
At low applied potentials the EPR spectral changes that accompany a decrease in potential in the absence of cyanide (Fig. 6) are similar to those seen in its presence (Fig. 5). The similarity extends to the appearance of a new rhombic signal set at gx = 3.05, gy = 2.24 and gz = 1.31 and concomitant disappearance of a HALS signal at g ~ 3.3 – 3.4 as the potential drops below ~ − 150 mV, consistent with magnetic coupling between ferric hemes 3 and 4, which disappears when heme 4 is reduced. At higher potentials the changes observed in the absence of cyanide are different because the ferric active site starts out as high-spin, and coupled to at least one nearby low-spin heme (Figs. 4 – 6). Previously the active site’s characteristic signals at g′ = 2.87 and g′ > 10 were attributed to weak exchange-coupling with one low-spin heme, presumably heme 3 which is nearest (Fig. 1; see above, and refs.(7, 17)). However, given that ferric heme 3 appears to be coupled to ferric heme 4, it now looks like the characteristic active site signals may actually arise from a more complex 3-way magnetic interaction between the active site (heme 1), heme 3 and heme 4.
Figure 6.
X-band EPR spectra obtained for a solution initially containing 25 μM of fully oxidized ccNiR dimer in the absence of cyanide, upon exposing it to the applied potentials shown (vs SHE). An additional signal that grows in at g = 1.31 as the applied potential is decreased can be viewed in an expanded spectrum provided as Supporting Information.
UV/Vis spectropotentiometry of the H268M S. oneidensis ccNiR mutant
In ccNiR, His268 is one of the axial ligands for heme 5 in each protomer (Fig. 1). Figure 7 shows selected UV/Vis spectral changes observed upon decreasing the potential applied to a solution initially containing 19.9 μM of oxidized ccNiRH268M dimer. An analysis similar to that described above for the wild-type in the presence of cyanide (fully described in Supporting Information) yielded the fits shown by the dashed red traces in Fig. 7, midpoint potentials for five discrete reduction steps of the mutant protein (Table 2), and extinction coefficient difference spectra corresponding to the five partially-reduced species (Supporting Information).
Figure 7.
UV/Vis spectral changes obtained upon exposing a solution initially containing 19.9 μM of fully oxidized ccNiRH268M dimer to applied potentials of 0, −100, −180, −270, and −500 mV vs SHE; arrows indicate the direction of change. Solid blue lines show the experimentally obtained data, whereas the dashed red lines were calculated from least-squares fitting to four Nernstian potentials, as described in Supporting Information.
As indicated by the color coding of the midpoint potentials in Table 2, ɛ02 – ɛ05 for ccNiRH268M most closely match ɛ01 – ɛ03 and ɛ05 for ccNiRwt; ccNiRH268M shows no midpoint potential that closely corresponds to ccNiRwt ɛ04. Similarly, ccNiRwt exhibits no midpoint potential that corresponds to the high potential ɛ01 of ccNiRH268M. Thus, it appears that the H268M mutation causes the ccNiRwt ɛ04 to shift dramatically to the positive, becoming ɛ01 in ccNiRH268M. This provides strong evidence that ccNiRwt ɛ04 corresponds to heme 5, whose axial ligand was mutated in ccNiRH268M
Note that the shapes of the ccNiRH268M spectra at low potential (Fig. 7) are notably different from those of the wild type at low potential (as seen for example in Fig. 2a). This can also be seen more conveniently in Figure S6 in Supporting Information, which compares the extinction coefficient difference spectra for the reduced species Cred1 – Cred5 obtained from the UV/Vis spectropotentiometric titrations of ccNiRH268M and ccNiRwt, respectively. For the wild type the extinction coefficient difference spectra for Cred4 and Cred5 exhibit noticeable red-shifts in the signals that have maximum amplitude above 420 nm. This shift is completely absent in the spectrum Δɛred4 of ccNiRH268M, but appears as a shoulder in that of Δɛred5(Fig. S6). Again, this is consistent with assignment of Δɛred4 to reduction of heme 5 in the wild type ccNiRwt, but not in ccNiRH268M.
Discussion
By combining results of UV/Vis and EPR spectropotentiometric titrations, specific midpoint potentials have been assigned to each of the five hemes per protomer of S. oneidensis ccNiRwt in the presence and absence of the strong-field ligand cyanide, and of the ccNiRH268M variant in the absence of cyanide (Table 2). The UV/Vis spectropotentiometric apparatus used herein yielded highly reproducible midpoint potential values. This allowed the midpoint potential of the active site heme to be identified as the only one that shifted significantly in the presence of cyanide, and that of heme 5 as the only one to shift notably upon mutating one of its axial ligands to a methionine in the ccNiRH268M variant.
Apart from heme 5, reduction of each of the remaining hemes could be associated with distinct EPR spectral changes. At some applied potentials two or more of the ferrihemes appear to be involved in complex magnetic interactions that resisted attempts at simulation, and which can’t be directly interpreted based solely on literature precedents. Despite this we can be reasonably confident about the midpoint potential assignments thanks to the fact that, at key points during the EPR spectropotentiometric titration, the highly characteristic rhombic signals of uncoupled ferrihemes 2 and 3 are detectable and can be tracked(7, 29). In this regard the S. oneidensis ccNiR behavior is similar to that of N. europaea HDH, a homotrimer that contains 8 hemes per protomer. In HDH two pairs of ferrihemes in each protomer are magnetically coupled at high potentials, and uncouple as one heme in each pair is reduced(34). For the HDH case unambiguous simulation of the coupling necessitated a multi-frequency EPR study, which tracked how the signals from the coupled hemes shifted with frequency; similar studies are planned for ccNiR in the future. Pereira et al. also reported seeing signals appear in the EPR spectrum of the Desulfovibrio vulgaris ccNiR as hemes uncoupled during reduction(6), though in that case spectral interpretation was complicated by the fact that the D. vulgaris enzyme is isolated as a complex with the tetraheme NrfH, which adds four extra hemes to the mix.
The analysis presented thus far assumes that each reduction event identified in the UV/Vis spectropotentiometric titrations has 1:1 correspondence with reduction of a unique heme. However, for S. oneidensis ccNiR in the absence of cyanide, we previously suggested that each of the first two 1-electron reduction events of Scheme 1 might actually spread the electron density among two or more hemes(10). Reduction of high-spin ferrihemes typically yields UV/Vis difference spectra with maximum positive deflection above 430 nm. A distinct peak at 430 nm was observed for E. coli ccNiR(35), but not for the S. oneidensis enzyme in the absence of cyanide (Fig. S1 and ref.(10)). The S. oneidensis spectra could be explained if the first and second reduction events distributed the electron density between the high-spin active site and one or more of the low-spin hemes, since the latter invariably exhibit maxima below 430 nm in the UV/Vis(10). Of note, evidence of this type of behavior was observed in a theoretical analysis of HDH reduction(36). Given the complexity of the EPR spectra associated with 0- to 3-electron reduced ccNiR in the absence of cyanide, the possibility of delocalized 1-electron reduction steps can still not be ruled out by our present study (nor can it be ruled out for the ccNiRH268M variant). In the presence of cyanide the EPR spectral changes associated with ɛ01 and ɛ02 are much more discrete, a fact that is aided by the large shift to positive potential of ɛ01. Under these conditions the assignment of ɛ01 and ɛ02 to reduction of specific hemes is more robustly supported.
In addition to the spectropotentiometric studies of S. oneidensis ccNiR reported here and in a previous study(10), some of the E. coli ccNiR heme midpoint potentials were similarly assigned in two earlier studies, using a combination of magnetic circular dichroism(35) and EPR(7) spectropotentiometries. Though the spectropotentiometric behaviors for the S. oneidensis and E. coli ccNiRs are similar superficially, closer inspection reveals some striking differences between the two enzymes.
The biggest difference observed between the S. oneidensis and E. coli ccNiR spectropotentiometric profiles is seen in the midpoint potential of heme 2 (Fig. 1), which is substantially higher in E. coli ccNiR than it is in the S. oneidensis enzyme (−37 mV, ref.(7) vs −214 mV, Table 2, in the absence of strong-field ligands). The E. coli and S. oneidensis enzymes are structurally very similar, but the region in which they differ most significantly is on the protein surface near heme 2(10). This region appears to be the physiological entry point for electrons(7, 9), and the structural difference is believed to reflect the fact that E. coli and S. oneidensis ccNiR use different physiological electron donors, with E. coli using NrfB and S. oneidensis using CymA(10). Visual inspection of the E. coli and S. oneidensis ccNiR structures in space-filling mode (Fig. 8) reveals that the propionate group of heme 2 is neutralized by hydrogen bonding with Arg 201 in the E. coli structure, whereas it is solvent exposed in the S. oneidensis ccNiR. Propionate neutralization has been shown to provoke significant positive shifts in heme midpoint potentials(37), and thus could account for the difference observed here. The heme edge in the S. oneidensis ccNiR also appears to be somewhat more solvent exposed than that in the E. coli enzyme (Fig. 8); a decrease in solvent exposure is likewise known to shift heme midpoint potentials in the positive direction(38).
Figure 8.

Space-filling view of the ccNiR surface in the vicinity of heme 2 (purple) for (a) the S. oneidensis enzyme; and (b) the E. coli enzyme. The yellow arrows point to the heme propionate that is solvent-exposed in the S. oneidensis enzyme, but hydrogen-bonded to Arg 201 in the E. coli enzyme.
For E. coli ccNiR both MCD and EPR clearly show that the active site (heme 1, Fig. 1) is the second heme reduced, after heme 2, with a midpoint potential of −107 mV(7, 35). By contrast, in the S. oneidensis enzyme the active site reduces first, with a midpoint potential of −44 mV in the absence of strong field ligands, and one of +20 mV in the presence of cyanide (Table 2). Interestingly, an early EPR spectropotentiometric titration of the D. Vulgaris ccNiR suggested that the active site of this enzyme was one of the last hemes to reduce, with a midpoint potential of ~ −210 mV(6).
Detection of the heme 3 signals for S. oneidensis ccNiR greatly simplified the unambiguous assignment of the EPR spectra for this enzyme. These signals are still visible at the lowest potential monitored (−377 mV and −406 mV in Figs. 5 and 6, respectively), showing that heme 3 is the last one reduced (see Results). In the case of E. coli ccNiR the trio of rhombic signals expected for heme 3 was not detected at any applied potential, which to date has made it impossible to unambiguously assign any low-spin hemes other than heme 2(7, 35). As for S. oneidensis ccNiR only one HALS signal was clearly detectable in the E. coli enzyme, and this was associated with a reduction event centered at a midpoint potential of −292 mV(7, 35). Such a value most closely corresponds to that of the S. oneidensis enzyme’s heme 5 midpoint potential, though as seen above one can’t assume that hemes from the two enzymes will exhibit comparable potentiometric behavior, despite their structural similarity.
It is perhaps instructive to rationalize some aspects about the order of heme reduction for S. oneidensis ccNiR on the basis of the following simple coulombic argument. First, when electrons are added to hemes 1, 2 and 4, the reduced hemes are separated from each other by the oxidized hemes 3 and 5 (Fig. 1). This arrangement will lead to lower coulombic repulsions between reduced hemes than any permutation in which three electrons are added to each protomer so as to reduce either heme 3 or heme 5; such permutations all force electrons to go on adjacent hemes. Once three electrons have been added to each protomer, the fourth electron will have to go to either heme 3 or heme 5. Both options will put reduced hemes in direct contact with each other. However, heme 3 sits at the branch point between hemes 1, 2 and 4 within one protomer, and so will be surrounded by three reduced hemes, whereas heme 5 will be surrounded by two: heme 4 from the same protomer, and heme 5 from the adjacent one (Fig. 1). Clearly an electron added to heme 5 would experience less repulsion, so one would predict this heme to reduce before heme 3, as is observed experimentally. A similar pattern in the order of heme reduction was observed for HDH(36, 39), which as mentioned before shares many similarities with ccNiR in regard to heme arrangement(10, 40). In the case of HDH, the coulombic rationale was supported by a computational study(36). Note also that this rationale doesn’t contradict anything that has been confirmed so far for the order of heme reduction in E. coli ccNiR: hemes 1 and 2 are among the first reduced, even if in a different order than seen for the S. oneidensis enzyme, and heme 5 may be among the last reduced(7, 35).
The observed difference in order of heme reduction between the S. oneidensis and E. coli ccNiRs suggests that a specific order is not critical to ccNiR function, since the two enzymes exhibit virtually identical specific activities(10). This might seem surprising, but one should bear in mind that differences in midpoint potentials measured experimentally in a protein with multiple redox-active sites are typically much larger than the differences felt by a single electron moving from site to site in an otherwise fully oxidized protein. The latter differences, which are likely to be small in ccNiR, are more physiologically relevant. The reason for the aforementioned phenomenon is that it is impossible to measure the midpoint potential of a low potential redox-active site until one has reduced the higher-potential sites in the same protein, and each additional electron added to the protein will decrease the midpoint potentials of the remaining sites due to increased coulombic repulsion(36). An extraordinary example of this is observed for the midpoint potentials of HDH(34, 36, 39). The midpoint potentials of the 8 HDH hemes from each protomer were resolved using spectropotentiometry, and found to span a dramatically wide range of 700 mV, from +288 mV to −412 mV(34, 39). However, in a computational study wherein a single electron was moved from heme to heme in fully oxidized HDH, the heme midpoint potentials spanned a range of only 417 mV, from +264 mV to −153 mV(36). The 417 mV difference reflects the effects of the local environment on the individual HDH hemes, while the additional ~300 mV difference observed in the spectropotentiometric titrations arises because the lower potential hemes are reduced after the higher potential ones, and their midpoint potentials are affected by these prior reductions. In the case of ccNiR most of the dramatic difference in heme 2′s midpoint potential value between the E. coli and S. oneidensis enzymes probably arises from the fact that this heme reduces after hemes 1 and 4 in S. oneidensis, but is the first to reduce in E. coli.
Probably the most important result from the present study is the fact that the strong field ligand cyanide causes such a large positive shift in the active site’s midpoint potential. Nitrite, the physiological substrate for ccNiR, is also a strong-field ligand when N-bound, and might be expected to provoke a similar shift in midpoint potential(3). We have now verified this conjecture in a series of experiments that provided important new insights into the mechanism of ccNiR-catalyzed nitrite reduction. These experiments will be presented in an upcoming article.
Supplementary Material
Acknowledgments
Funding Sources: Supported by National Science Foundation Grants MCB-1121770 and MCB-1330809. D.L. gratefully acknowledges support from UWM’s Office of Undergraduate Research.
ABBREVIATIONS
- ccNiR
cytochrome c nitrite reductase
- HDH, hydroxylamine
ferricytochrome-c oxidoreductase
- UV/Vis
ultraviolet/visible
- EPR
electron paramagnetic resonance
- SHE
standard hydrogen electrode
- EDTA
ethylenediaminetetraacetic acid disodium salt
- HEPES
2-[4-(2-hydroxyethyl)-piperazin-1-yl]ethanesulfonic acid sodium salt
- Diquat
6,7-dihydrodipyrido[1,2-a:2′,1′-c]pyrazinediium dibromide
- SVD
singular value decomposition
- HALS
highly axial low-spin
Footnotes
In the past this enzyme has been more commonly referred to as hydroxylamine oxidase (or oxidoreductase), abbreviated as HAO. However, the currently accepted name for the enzyme (EC 1.7.2.6) is hydroxylamine dehydrogenase, while its correct systematic name is hydroxylamine:ferricytochrome-c oxidoreductase.
The quantity g′, or g′-value, is used to denote the effective g-value of a resonance in the EPR spectrum that is not necessarily determined by the Landé g-factor, whereas g, or g-value, implies the Landé g-factor. In the case of high-spin systems (with S > ½), the g′-value is often largely a function of the zero-field splitting constant, D. For and g = 2, the usual case for high-spin Fe(III), g′ ≤ 10; if g′ > 10, then either , if non-integer, or else S has an integer value (see ref. 28. Hagen, W. R. (1992) EPR spectroscopy of iron-sulfur proteins, Adv. Inorg. Chem. 38, 165–222.).
Supporting Information. Spectropotentiometric titration of ccNiR in the absence of cyanide: spectral changes and calculated intermediate concentrations; Expanded EPR spectrum of ccNiR during spectropotentiometric titration; Analysis of the UV/Vis spectropotentiometric titration of ccNiRH268M. “This material is available free of charge via the Internet at http://pubs.acs.org.”
Notes
The authors declare no competing financial interest.
References
- 1.Simon J. Enzymology and bioenergetics of respiratory nitrite ammonification. FEMS Microbiol Rev. 2002;26:285–309. doi: 10.1111/j.1574-6976.2002.tb00616.x. [DOI] [PubMed] [Google Scholar]
- 2.Poock S, Leach E, Moir J, Cole J, Richardson D. Respiratory Detoxification of Nitric Oxide by the Cytochrome c Nitrite Reductase of Escherichia coli. J Biol Chem. 2002;277:23664–23669. doi: 10.1074/jbc.M200731200. [DOI] [PubMed] [Google Scholar]
- 3.Einsle O, Messerschmidt A, Huber R, Kroneck PMH, Neese F. Mechanism of the six-electron reduction of nitrite to ammonia by cytochrome c nitrite reductase. J Am Chem Soc. 2002;124:11737–11745. doi: 10.1021/ja0206487. [DOI] [PubMed] [Google Scholar]
- 4.Einsle O, Messerschmidt A, Stach P, Bourenkov GP, Bartunik HD, Huber R, Kroneck PMH. Structure of cytochrome c nitrite reductase. Nature. 1999;400:476–480. doi: 10.1038/22802. [DOI] [PubMed] [Google Scholar]
- 5.Einsle O, Stach P, Messerschmidt A, Simon J, Kroger A, Huber R, Kroneck PMH. Cytochrome c nitrite reductase from Wolinella succinogenes - Structure at 1.6 angstrom resolution, inhibitor binding, and heme-packing motifs. J Biol Chem. 2000;275:39608–39616. doi: 10.1074/jbc.M006188200. [DOI] [PubMed] [Google Scholar]
- 6.Pereira I, LeGall J, Xavier A, Teixeira M. Characterization of a heme c nitrite reductase from a non-ammonifying microorganism. Desulfovibrio vulgaris Hildenborough, Biochim Biophys Acta. 2000;1481:119–130. doi: 10.1016/s0167-4838(00)00111-4. [DOI] [PubMed] [Google Scholar]
- 7.Bamford VA, Angove HC, Seward HE, Thomson AJ, Cole JA, Butt JN, Hemmings AM, Richardson DJ. Structure and spectroscopy of the periplasmic cytochrome c nitrite reductase from Escherichia coli. Biochemistry. 2002;41:2921–2931. doi: 10.1021/bi015765d. [DOI] [PubMed] [Google Scholar]
- 8.Cunha CA, Macieira S, Dias JM, Almeida G, Goncalves LL, Costa C, Lampreia J, Huber R, Moura JJG, Moura I, Romao MJ. Cytochrome c nitrite reductase from Desulfovibrio desulfuricans ATCC 27774 - The relevance of the two calcium sites in the structure of the catalytic subunit (NrfA) J Biol Chem. 2003;278:17455–17465. doi: 10.1074/jbc.M211777200. [DOI] [PubMed] [Google Scholar]
- 9.Rodrigues M, Oliveira T, Pereira I, Archer M. X-ray structure of the membrane-bound cytochrome c quinol dehydrogenase NrfH reveals novel haem coordination. EMBO Journal. 2006;25:5951–5960. doi: 10.1038/sj.emboj.7601439. [DOI] [PMC free article] [PubMed] [Google Scholar]
- 10.Youngblut M, Judd ET, Srajer V, Sayyed B, Goelzer T, Elliott SJ, Schmidt M, Pacheco AA. Laue crystal structure of Shewanella oneidensis cytochrome c nitrite reductase from a high-yield expression system. J Biol Inorg Chem. 2012;17:647–662. doi: 10.1007/s00775-012-0885-0. [DOI] [PMC free article] [PubMed] [Google Scholar]
- 11.Ehrlich HL. Geomicrobiology. 4th. Marcel Dekker, Inc; New York, NY: 2002. [Google Scholar]
- 12.Fenchel T, King GM, Blackburn TH. Bacterial Biogeochemistry. 2nd. Academic Press; London: 1998. [Google Scholar]
- 13.Kern M, Volz J, Simon J. The oxidative and nitrosative stress defense network of Wollinella succinogenes: cytochrome c nitrite reductase mediates the stress response to nitrite, nitric oxide, hydroxylamine and hydrogen peroxide. Environ Microbiol. 2011;13:2478–2494. doi: 10.1111/j.1462-2920.2011.02520.x. [DOI] [PubMed] [Google Scholar]
- 14.Tikhonova T, Tikhonov A, Trofimov A, Polyakov K, Boyko K, Cherkashin E, Rakitina T, Sorokin D, Popov V. Comparative structural and functional analysis of two octaheme nitrite reductases from closely related Thioalkalovibrio species. FEBS J. 2012;279:4052–4061. doi: 10.1111/j.1742-4658.2012.08811.x. [DOI] [PubMed] [Google Scholar]
- 15.Mowat CG, Chapman SJ. Multi-heme cytochromes - new structures, new chemistry. J Chem Soc Dalton Trans. 2005;21:3381–3389. doi: 10.1039/b505184c. [DOI] [PubMed] [Google Scholar]
- 16.Bewley KD, Ellis KE, Firer-Sherwood MA, Elliott SJ. Multi-heme proteins: nature’s electronic multi-purpose tool. Biochim Biophys Acta. 2013;1827:938–948. doi: 10.1016/j.bbabio.2013.03.010. [DOI] [PMC free article] [PubMed] [Google Scholar]
- 17.Youngblut M, Pauly DJ, Stein N, Walters D, Conrad JA, Moran GR, Bennett B, Pacheco AA. Shewanella oneidensis cytochrome c nitrite reductase (ccNiR) does not disproportionate hydroxylamine to ammonia and nitrite, despite a strongly favorable driving force. Biochemistry. 2014;53:2136–2144. doi: 10.1021/bi401705d. [DOI] [PMC free article] [PubMed] [Google Scholar]
- 18.Kostera J, McGarry JM, Pacheco AA. Enzymatic Interconversion of Ammonia and Nitrite: the Right Tool for the Job. Biochemistry. 2010;49:8546–8553. doi: 10.1021/bi1006783. [DOI] [PubMed] [Google Scholar]
- 19.Kostera J, Youngblut MD, Slosarczyk JM, Pacheco AA. Kinetic and product distribution analysis of NO reductase activity in Nitrosomonas europaea hydroxylamine oxidoreductase. J Biol Inorg Chem. 2008;13:1073–1083. doi: 10.1007/s00775-008-0393-4. [DOI] [PubMed] [Google Scholar]
- 20.Homer RF, Tomlinson TE. The stereochemistry of the bridged quaternary salts of 2,2′-bipyridyl. J Chem Soc. 1960:2498–2503. [Google Scholar]
- 21.Stein N. Department of Chemistry and Biochemistry. University of Wisconsin-Milwaukee; 2014. Spectroscopic and electrochemical studies of shewanella oneidensis cytochrome c nitrite reductase, and improving c-heme expression systems. [Google Scholar]
- 22.Judd ET, Stein N, Pacheco AA, Elliott SJ. Hydrogen bonding networks tune proton-coupled redox steps during the enzymatic six-electron conversion of nitrite to ammonia. Biochemistry. 2014;53:5638–5646. doi: 10.1021/bi500854p. [DOI] [PMC free article] [PubMed] [Google Scholar]
- 23.Heineman WR, Norris BJ, Goelz JF. Measurement of enzyme E0′ values by optically transparent thin layer electrochemical cells. Anal Chem. 1975;47:79–84. doi: 10.1021/ac60351a001. [DOI] [PubMed] [Google Scholar]
- 24.Pilkington MBG, Coles BA, Compton RG. Construction of an optically transparent thin layer electrode cell for use with oxygen-sensitive species in aqueous and non-aqueous solvents. Anal Chem. 1989;61:1787–1789. [Google Scholar]
- 25.Watanabe T, Honda K. Measurement of the extinction coefficient of the methyl viologen cation radical and the efficiency of its formation by semiconductor photocatalysis. J Phys Chem. 1982;86:2617–2619. [Google Scholar]
- 26.Press WH, Teukolsky SA, Vetterling WT, Flannery BP. Numerical Recipes the art of scientific computing. 3rd. Cambridge University Press; New York, NY: 2007. pp. 65–75. [Google Scholar]
- 27.Henry ER, Hofrichter J. Singular Value Decomposition: Application to Analysis of Experimental Data. In: Brand L, Johnson ML, editors. Meth Enzymol. Academic Press; San Diego: 1992. pp. 129–192. [Google Scholar]
- 28.Hagen WR. EPR spectroscopy of iron-sulfur proteins. Adv Inorg Chem. 1992;38:165–222. [Google Scholar]
- 29.Walker FA. Magnetic spectroscopic (EPR, ESEEM, Mossbauer, MCD and NMR) studies of low-spin ferriheme centers nad their corresponding heme proteins. Coord Chem Rev. 1999;186:471–534. [Google Scholar]
- 30.Spinner F, Cheesman MR, Thomson AJ, Kaysser T, Gennis RB, Peng Q, Peterson J. The haem b558 component of the cytochrome bd quinol oxidase complex from Escherichia coli has histidine-methionine axial ligation. Biochem J. 1995;308:641–644. doi: 10.1042/bj3080641. [DOI] [PMC free article] [PubMed] [Google Scholar]
- 31.Walker FA, Huynh BH, Scheidt WR, Osvath SR. Models of the cytochromes b. Effect of axial ligand plane orientation on the EPR and Mossbauer spectra of low-spin ferrihemes. J Am Chem Soc. 1986;108:5288–5297. [Google Scholar]
- 32.Shokhirev NV, Walker FA. Co- and counterrotation of magnetic axes and axial ligands in low-spin ferriheme systems. J Am Chem Soc. 1998;120:981–990. [Google Scholar]
- 33.Li J, Noll BC, Schultz CE, Scheidt WR. New insights on the electronic and molecular structure of cyanide-ligated iron(III) porphyrinates. Inorg Chem. 2007;46:2286–2298. doi: 10.1021/ic061463u. [DOI] [PMC free article] [PubMed] [Google Scholar]
- 34.Hendrich MP, Petasis D, Arciero DM, Hooper AB. Correlations of structure and electronic properties from EPR spectroscopy of hydroxylamine oxidoreductase. J Am Chem Soc. 2001;123:2997–3005. doi: 10.1021/ja002982d. [DOI] [PubMed] [Google Scholar]
- 35.Marritt SJ, Kemp GL, Xiaoe L, Durrant JR, Cheesman MR, Butt JN. Spectroelectrochemical characterization of a pentaheme cytochrome in solution and as electrocatalytically active films on nanocrystalline metal-oxide electrodes. J Am Chem Soc. 2008;130:8588–8589. doi: 10.1021/ja802641a. [DOI] [PubMed] [Google Scholar]
- 36.Kurnikov IV, Ratner MA, Pacheco AA. Redox equilibria in hydroxylamine oxidoreductase. Electrostatic control of electron redistribution in multielectron oxidative processes. Biochemistry. 2005;44:1856–1863. doi: 10.1021/bi048060v. [DOI] [PubMed] [Google Scholar]
- 37.Rivera M, Seetharaman R, Girdhar D, Wirtz M, Zhang XJ, Wang XQ, White S. The reduction potential of cytochrome b(5) is modulated by its exposed heme edge. Biochemistry. 1998;37:1485–1494. doi: 10.1021/bi972390g. [DOI] [PubMed] [Google Scholar]
- 38.Wirtz M, Oganesyan V, Zhang XJ, Studer J, Rivera M. Modulation of redox potential in electron transfer proteins: Effects of complex formation on the active site microenvironment of cytochrome b(5) Faraday Discussions. 2000:221–234. doi: 10.1039/b001520m. [DOI] [PubMed] [Google Scholar]
- 39.Collins MJ, Arciero DM, Hooper AB. Optical Spectropotentiometric Resolution of the Hemes of Hydroxylamine Oxidoreductase - Heme Quantitation and Ph-Dependence of Em. J Biol Chem. 1993;268:14655–14662. [PubMed] [Google Scholar]
- 40.Igarashi N, Moriyama H, Fujiwara T, Fukumori Y, Tanaka N. The 2.8 angstrom structure of hydroxylamine oxidoreductase from a nitrifying chemoautotrophic bacterium, Nitrosomonas europaea. Nat Struct Biol. 1997;4:276–284. doi: 10.1038/nsb0497-276. [DOI] [PubMed] [Google Scholar]
Associated Data
This section collects any data citations, data availability statements, or supplementary materials included in this article.