Abstract
Objective:
To evaluate the ability of dynamic post-contrast sequence to specify indeterminate ovarian masses with inconclusive MR features of malignancy. Since management is dramatically different, special focus on the ability to differentiate borderline from invasive malignancy was considered.
Methods:
150 ovarian masses were detected by pelvic ultrasound in 124 patients. Masses had been considered for dynamic post-contrast MRI. We expressed the kinetic parameters (i.e. enhancement amplitude, time peak of maximal uptake and maximal slope) in the form of maximum relative enhancement percentage (MRE%), time of maximal peak of contrast uptake (Tmax) and slope enhancement ratio (SER) curves. Histological findings were the gold standard of reference.
Results:
Malignant ovarian masses showed higher MRE% than benign and borderline masses (p < 0.001). Tmax was shorter for malignant than benign (p < 0.01) and borderline (p < 0.001) ovarian masses. SER curves were the most suggestive of malignancy with a specificity and accuracy of 85.7% and 84.7%, respectively.
Conclusion:
Dynamic contrast-enhanced MRI could be a specific sequence to differentiate ovarian masses with indeterminate MR morphology with a special discrimination for low potential from invasive ovarian malignancy.
Advances in knowledge:
The study evaluated the diagnostic performance of the individual parameters of dynamic post-contrast MR sequence in evaluating ovarian masses. Management divert between benign, borderline and invasive malignant masses; our work presented a cut-off value for the peak of contrast uptake of 120%, which helped in the differentiation between benign and malignant tumours; the SER curves with Type III (early washout) pattern that was indicative of invasive malignancy was more specific than borderline malignancy.
INTRODUCTION
Characterization of an ovarian mass is of the utmost importance in the pre-operative evaluation of an ovarian neoplasm so that adequate procedures can be planned.1
The optimal management strategy is determined according to the nature of the ovarian masses, which is often applicable by performing intraoperative frozen sections for the pathological analysis.2,3 The reliability of such diagnostic procedure is questionable and is largely depending on the pathologist's experience and the representative degree of the sections examined.4,5
It is very important to distinguish frankly malignant tumours from borderline tumours as the latter have a much better prognosis and, because they are non-invasive, they are to be treated in a conservative way. On the other side, the optimal treatment of Stage I ovarian cancer is total abdominal hysterectomy, bilateral salpingo-oophorectomy and surgical staging.6
Because of the paucity of specific early symptoms, two-thirds of females have advanced disease at the time of diagnosis.7 Changes in the level of CA-125 and other laboratory workup can be used as a reliable indicator of response or progression, but these do not, yet, have a clear place in diagnosis or prognosis.8,9 Ultrasound (US) is the first-line imaging investigation in the detection and characterization of ovarian tumours, but on the other hand, it is an operator-dependent technique, less panoramic than MRI and shows less distinction of solid soft-tissue components.10
MRI can distinguish several types of tissue and fluid from their signal intensity (SI) patterns.11
Several previous studies have proved the usefulness of dynamic contrast-enhanced MRI (DCE-MRI) in distinguishing malignant from benign tumours, on the basis of differences in contrast agent behaviour, owing to changes in the microcirculation induced by neoangiogenesis.12–14 On the other hand, there are few articles added to the body of literature on the use of DCE-MRI for the characterization of ovarian tumours.15
The purpose of this work was: first, to evaluate the added value of DCE sequence in enhancing the diagnostic performance of the classic MR examination of indeterminate ovarian masses; second, to check the ability of DCE-MRI to differentiate borderline from invasive malignant tumours, since management in both situations will be dramatically different.
METHODS AND MATERIALS
Patients
This work is a retrospective study Ethics committee approved by the Faculty of Medicine, Cairo University, and cases had been supplied by Kasr El Aini Hospital. Included cases gave informed consent to use their data for analysis and research. We evaluated 150 pelvic masses with solid components either complex or purely solid masses in 124 female patients who presented to the Cairo University's Gynaecology Department's outpatient clinic from September 2013 to August 2014. The original complaints of the patients were accidentally discovered adnexal mass during routine clinical examination, progressive swelling of the abdomen, vaginal bleeding or lower abdominal pain. Studied ovarian masses were located first by preliminary pelvic ultrasound in the adnexal and ovarian regions. Patients were referred to the Radiology Department and scheduled for dynamic post-contrast MR examination.
Included ovarian masses were considered “indeterminate” when their morphology was not typical to place them with confidence into either the benign or malignant category, even after thorough interrogation with the routine MR examination.
In our selection, we followed:
(1) Valentini et al10 criteria of suspicious complex ovarian masses: (1) a thick, irregular wall; (2) thick septa; and (3) a large soft-tissue component with necrosis
(2) both borderline and invasive malignant tumours are usually complex, multilocular with significant solid elements6
(3) profuse papillary projections in cystic tumours are commonly seen with borderline and often present in invasive tumours1
(4) predominantly or uniformly low SI within a lesion is a feature of benign tumours.11,16
In view of the pervious data, inclusion criteria were:
complex cystic or solid ovarian masses
purely solid masses with atypical SI (i.e. intermediate or intermediate–high) on T2 weighted images.
Excluded masses were those with (i) typical benign MR features whether they were purely cystic or purely solid with low T2 weighted SI, (ii) tiny solid component not applicable for region of interest (ROI) placement (≤2 mm), (iii) non-enhancing solid component, (iv) no secondary signs of malignancy (i.e. peritoneal implants, bowel infiltration and distant metastases) and (v) no available pathology report data.
Ovarian masses proved to be benign (n = 42) in 38 female patients (Figure 1), and their ages ranged from 17 to 40 years [mean age = 28.8 years; standard deviation (SD) = 7.8]. Proved borderline tumours (Figures 2 and 3); those with low potential of malignancy (n = 26), detected in 21 cases with age range of 30–55 years (mean age = 38.5 years; SD = 5.7) and proved malignant ones (n = 82) found in 65 cases (Figures 4–6); patient's age ranged from 20 to 65 years (mean age = 45.6 years, SD = 8.6).
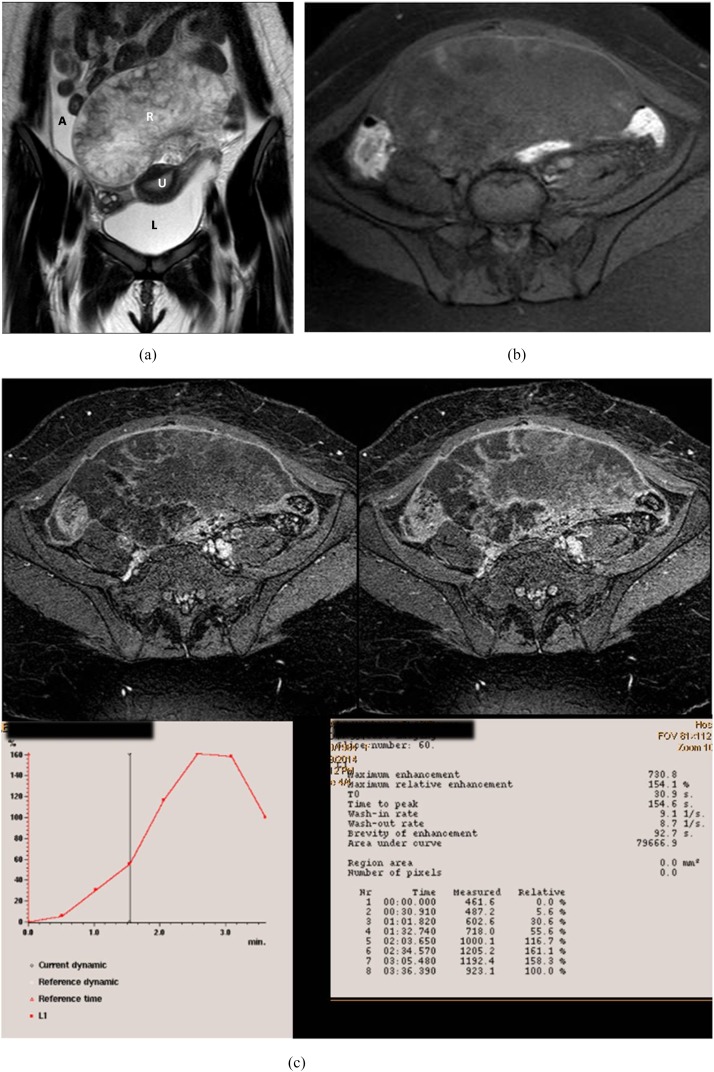
Figure 1.
An 18-year-old female with bilateral ovarian masses. Right luteinized thecoma and left simple cyst. (a) Coronal T2 weighted fast spin echo shows the uterus sandwiched between large anteriorly located pelvic solid mass of heterogeneous high signal intensity (SI) and simple cyst related to the left ovary seen at the cul-de-sac. Note the presence of ascetic fluid at the right iliac region. (b) Presence of high SI areas in the periphery of the mass on axial T1 weighted spectral pre-saturation inversion recovery image suggestive of haemorrhagic infarction. (c) Early and delayed post-contrast T1 high-resolution isotropic volumetric examination images show delayed contrast uptake of the mass with no appreciable enhancement at the infracted periphery. Kinetics was initial enhancement peak at 154 s with corresponding maximum relative enhancement percentage of 154% and Type I benign curve pattern. A, ascites; L, left; R, right; U, uterus.
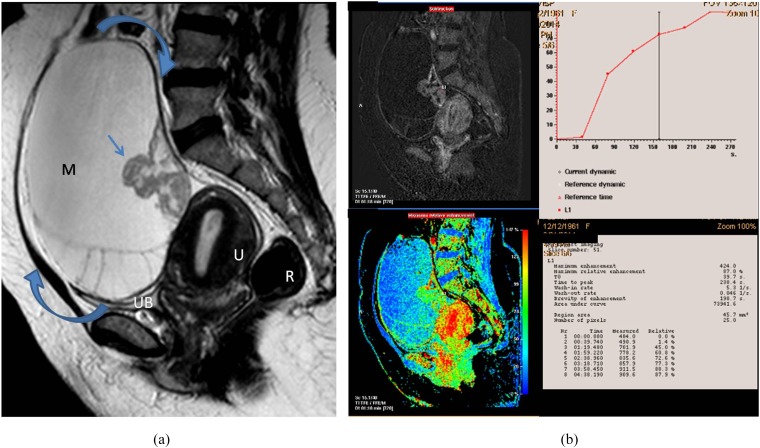
Figure 2.
A 55-year-old female presented with right ovarian borderline serous cystadenoma. (a) Sagittal T2 weighted fast spin echo shows large complex cystic, mass (M; curved arrows) with septations and posterior wall-based cauliflower soft tissue (straight arrow). Note the vaginal prolapse and intussusception of the cervix. (b) A collective figure: the left column represents sagittal post-contrast T1 high-resolution isotropic volumetric examination image and the colour mapping images (that could detect the most vascular portion of the tumour). The right column represents the kinetic analysis of delayed initial peak of contrast uptake at 288 s with corresponding maximum relative enhancement percentage of 87% and Type I (benign) curve pattern. The morphological features were in favour of invasive malignancy, yet the post-contrast dynamic parameters were more towards benign kinetics. The latter finding was explained by the tumour pathology being a borderline tumour. R, rectum; U, uterus; UB, urinary bladder.
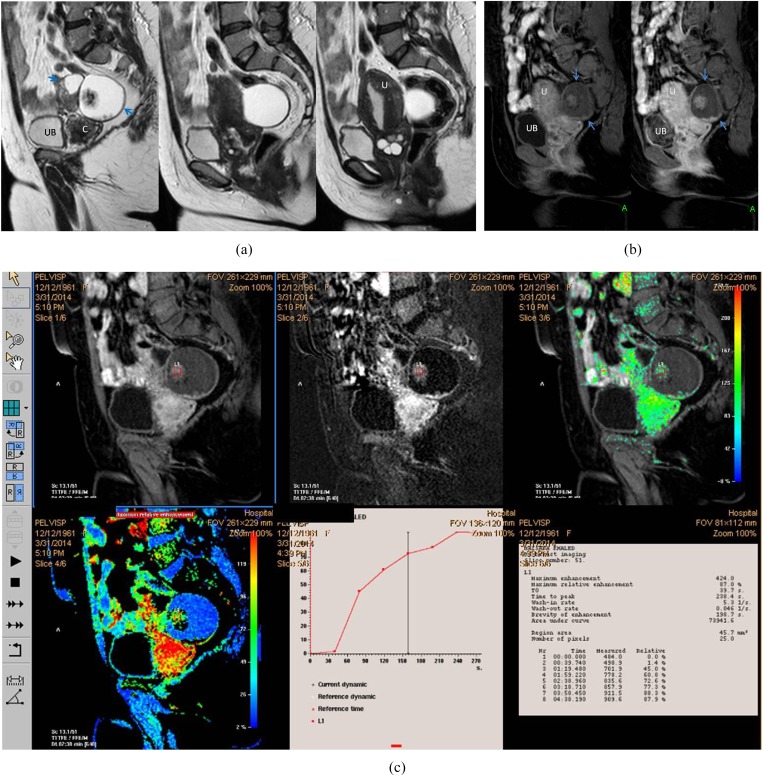
Figure 3.
A 54-year-old female patient with right ovarian borderline cystadenofibroma. (a) Sagittal T2 weighted fast spin echo shows complex ovarian mass with small solid component (blue arrows). Note the marked cervistis in the form of multiple nabothian cysts. (b) Three-dimensional sagittal oblique multiplanar reformatting reconstructed post-contrast image shows the right ovarian mass and the uterus along its whole length, the solid component of the mass displayed uptake in a comparable timing to the uterine myometrium. (c) Semi-quantitative parameters display delayed Tmax at 238 s, maximum relative enhancement percentage of 87% and Type I progressively rising curve pattern. The suspicious complex features of the ovarian mass and the age of the patient favour invasive malignant pathology, yet the kinetics were towards benign neoangiogenesis that coincided with the pathology being a borderline mass. C, cervix; U, uterus; UB, urinary bladder. For colour image see online.
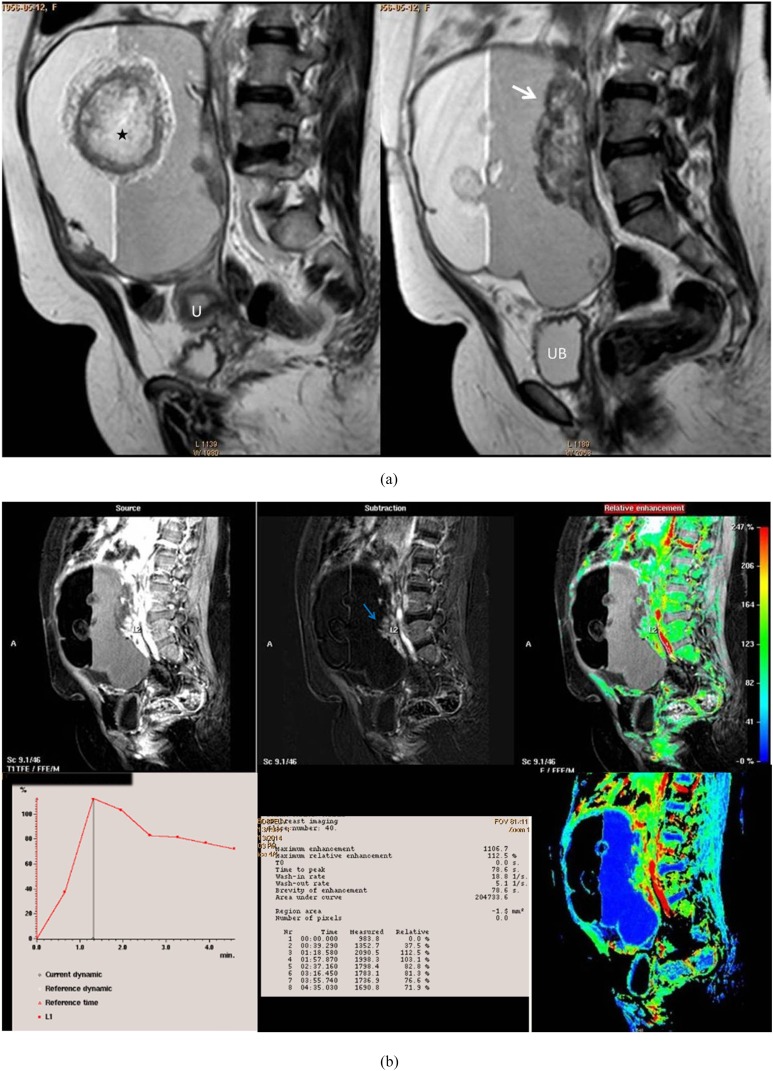
Figure 4.
A post-menopausal nulliparous 45-year-old female with right ovarian squamous cell carcinoma arising on the top of immature cystic teratoma. (a) Sagittal T2 weighted fast spin echo shows large adnexal complex mass with rounded matted tuft of hair seen centred on fluid sedimentation levelling (black star). Associate mural-based lobulated soft-tissue component (white arrow). (b) A collective figure included in the upper row from left to right: sagittal post-contrast T1 high-resolution isotropic volumetric examination (source) image, subtraction post-contrast image (best distinction of the enhancing soft tissue seen adherent to the posterior wall) and colour-coded image. The lower row represented the kinetic analysis of early initial peak of contrast uptake at 78 s with corresponding maximum relative enhancement percentage of 112% and Type III malignant curve pattern. The last image in the lower row represented a colour mapping image (rapid and strongly enhancing areas are displayed in red or yellow, while areas of slow or weak enhancement appear green). U, uterus; UB, urinary bladder. For colour image see online.
Figure 6.
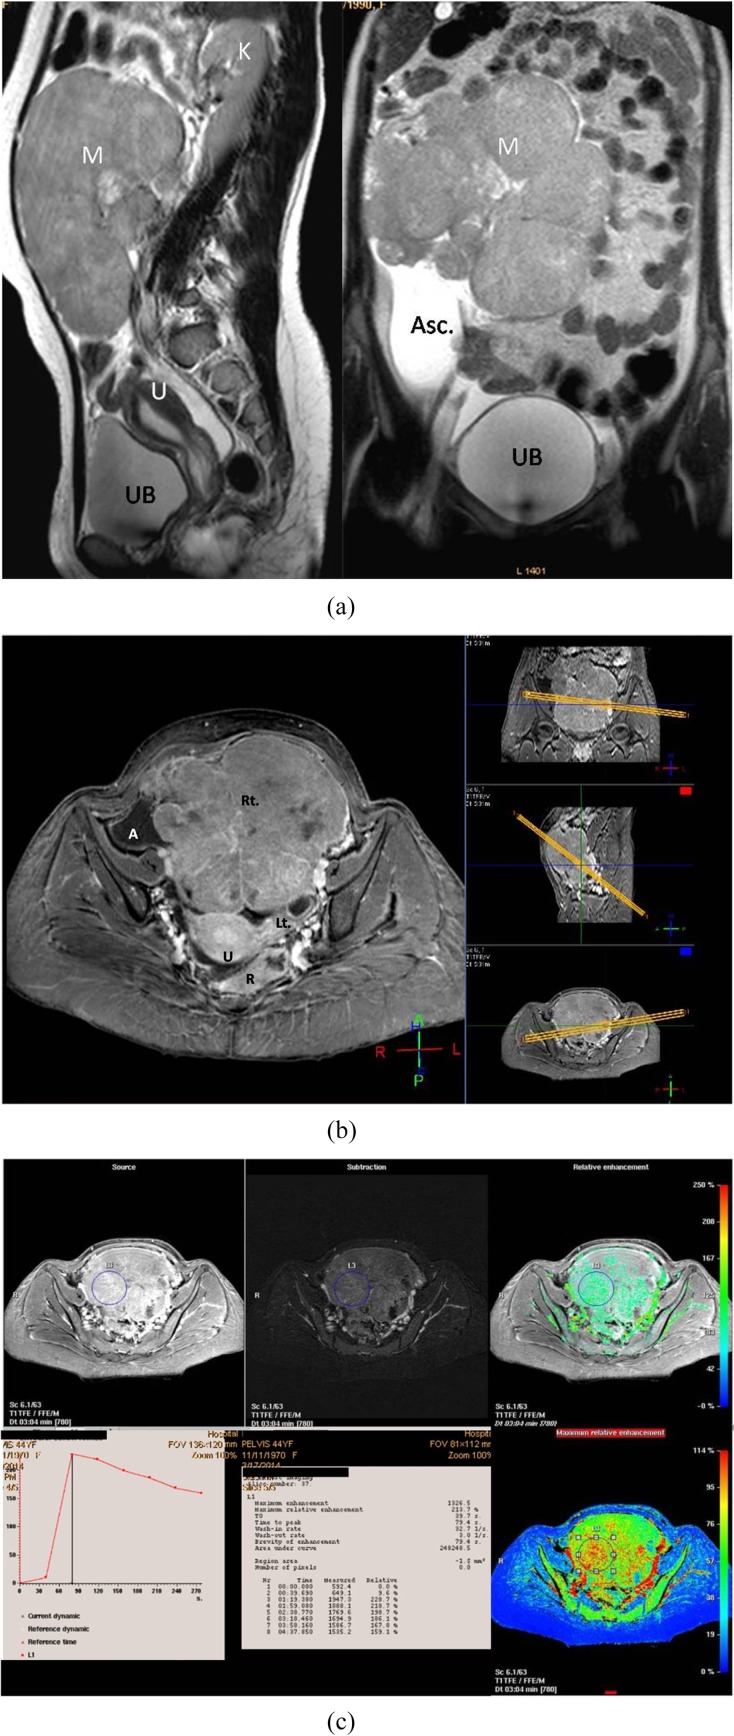
A 44-year-old female patient with right ovarian granulosa cell tumour. (a) Sagittal (right) and coronal (left) T2 weighted fast spin echo shows large pelvic predominantly solid mass (M) of intermediate to high signal intensity. Some scattered tiny cysts are seen within. (b) Three-dimensional axial oblique MPR reconstructed post-contrast image shows the large right ovarian mass, the uterus (U), right iliac region ascites (A), the normal left ovary and the rectum (R), all in one image. (c) Kinetic analysis of the right ovarian mass displays early Tmax at 78 s with corresponding maximum relative enhancement percentage of 213% and Type III malignant curve pattern. Asc., ascites; K, kidney; Lt., left; Rt., right; U, uterus; UB, urinary bladder.
Included patients were referred for surgery: (i) ovarian cystectomy was performed in 38 cases, (ii) salpingo-oophorectomy in 21 cases and (iii) bilateral salpingo-oophorectomy with hysterectomy, omentectomy and peritoneal sampling in 65 cases.
Some patients had bilateral ovarian masses, which explains the discrepancy between the number of patients and tumours managed.
Methods
All subjects were initially managed according to the Obstetrics and Gynaecology Department protocols. Certain points of relevance in the medical history (including gravidity, parity, past menstrual patterns, prior hormonal use and any previous genital or breast disease) and in the family history were recorded. In addition, the values of tumour markers requested for the patients (namely CA-125, CA-15-3, inhibin, alpha-fetoprotein) were noted.
All cases had undergone preliminary transabdominal pelvic and transvaginal ultrasound, using 3.5- to 5.0-MHz sector and 9-MHz endoluminal probes, respectively, on 2LOGIQ 7 PRO (General Electric Medical System) ultrasound machine in the Gynaecology Department by a qualified consultant (EY).
Routine MRI examination of the pelvis was performed for all cases using a 1.5-T magnet (Gyroscan Entra; Philips Healthcare, Netherlands).
Cases were examined first by pre-contrast sequences: sagittal, axial and coronal T2 weighted sequences fast spin echo (SE) [repetition time (TR)/echo time (TE) = 5000/100 ms], axial T1 weighted SE (TR/TE = 460/10 ms) and axial T1 weighted spectral pre-saturation inversion recovery (TR/TE = 532/8 ms). For all the aforementioned sequences, slice thickness = 4 mm with 0.5- to 1.0-mm gap, matrix = 256 × 192 pixels, flip angle = 90° and field of view (FOV) = 340–370 mm.
Dynamic post-contrast MR sequence was performed to make use of the kinetic criteria and check the possibility of providing more accurate information about the nature of the included masses. The chosen FOV included the entire mass and the surrounding pelvic structures and not only the solid component of the desired ovarian masses.
Dynamic sequence used was three-dimensional (3D) T1 high-resolution isotropic volumetric examination (THRIVE) of eight acquisitions, one before and seven after power injection of 0.1 mmol kg−1 body weight of contrast (Gd-DTPA) at a rate of 2 ml s−1, which was then followed by an injection of 20 ml of normal saline to help contrast dispersion. The parameters of each acquisition were TR/TE = 2.8/9.0 ms, matrix = 512 × 192, slice thickness = 1.5 mm and FOV = 370–400 mm. The duration per acquisition was 40–48 s (varying according to the size of the scanned mass), and the whole dynamic study lasted for an average of 5 min 30 s.
Image analysis
MR image interpretation and quantitative analysis were performed by two qualified consultants of radiology (SMM and SS of 15 and 12 years' experience in pelvic MRI, respectively). The authors were blinded regarding the MR image analysis performed by each of them, and initial evaluation was performed without knowledge of the ovarian masses pathology, tumour markers or suggested pelvic US diagnosis.
Dynamic imaging parameters included: (a) enhancement amplitude (EA), (b) time of initial peak of maximal uptake (Tmax) and (c) maximal slope (MS). Kinetic analysis was applicable using a Philips Advantage windows workstation 4.4 with functional tool software (IntelliVue XDS software; Philips Healthcare, Netherlands). We used Breast Analysis software for image post-processing. We placed ROI manually on the abnormally and significantly enhancing areas to determine the lesion enhancement rate peak and time. To minimize variability, ROI size varied from 15 to 150 mm2. The post-contrast subtracted sequence was the standard sequence for proper ROI placement. In the subtraction images, there was better localization of the enhanced viable tumour tissue, which is seen clearly against a background of signal suppression from the surrounding bowel, fat and ±ascites. Also in complex ovarian masses with cystic areas that contain blood, mucin or thick debris (of bright SI on T1WI), the enhancing solid component could be easily demarcated in the subtraction images. Multiple ROIs were applied to masses with large or multiple discrete solid components to minimize the risk of signal-to-noise (SNR) ratio.
Following previous dynamic post-contrast studies in breast and uterus,17–20 the concept of strong and early lesion enhancement represents doubling (or more) of the SI within the first post-contrast minute. The previously mentioned dynamic imaging parameters were expressed by the post-processing analysis as follows:
(1) “EA” in the form of maximum relative enhancement percentage (MRE%) automatically calculated using the MR software formula: 100 × (SI post-CM − SI pre-CM)/SI pre-CM, where “SI post-CM” is the signal intensity at the initial peak of contrast uptake and “SI pre-CM” is the raw signal intensity before injection of contrast material.21
(2) “Tmax” presented by early (two phases post uptake, ≤120 s) and delayed (three phases prior to the end of examination, ≥200 s) peaks of contrast uptake.
(3) “MS” presented by slope enhancement ratio (SER) curves—time/relative SI curves—automatically graphed at the workstation post imaging.
There are three patterns of plotted SER curves: (I) continuous rise, (II) plateau and (III) early washout. These patterns suggest the behaviour of contrast uptake by the examined masses in the form of graphed curves.
MS is calculated at the point of abrupt decline in the Tmax elicited by the SER curves. “Early washout” is the decrease in the post-contrast SI by >10% following the initial peak of contrast uptake.
Cases that showed delayed washout also belonged to Type I pattern (Figure 1).
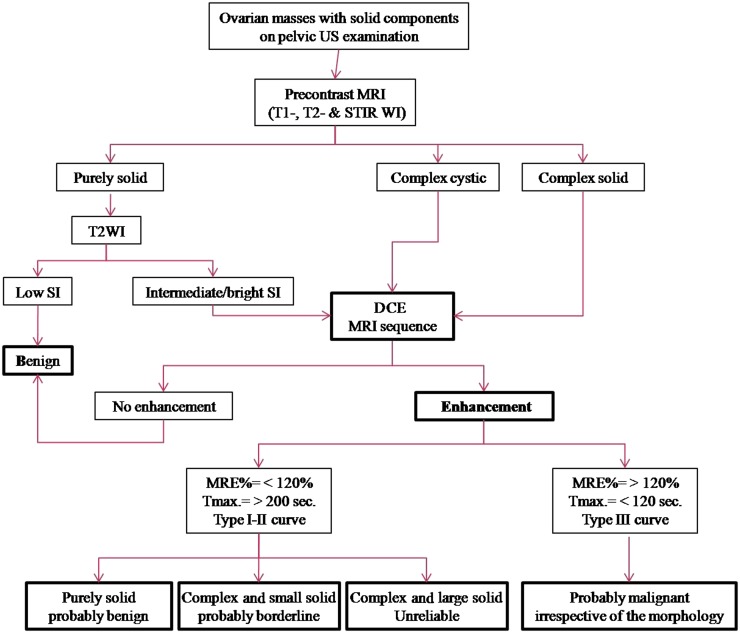
The pathology of ovarian tumours suggested by the MR examination aided with the DCE sequence, whether benign, borderline or invasive malignant (Figure 7), was correlated with histopathology being the gold standard of reference.
Figure 7.
A suggested MRI algorithm in the assessment of indeterminate ovarian masses with solid components detected on pelvic US examination. DCE, dynamic contrast-enhanced; MRE%, maximum relative enhancement percentage; SI, signal intensity.
Data were statistically described in terms of range, mean ± SD, median, frequencies (number of cases) and percentages when appropriate. For comparing categorical data, χ2 test was performed. Accuracy of the studied diagnostic marker in predicting malignancy was represented using the terms sensitivity, specificity and overall accuracy. A probability value (p-value) < 0.05 was considered statistically significant. Statistical analysis was performed using the SPSS® software for Windows v. 16 (SPSS Inc., Chicago, IL).
RESULTS
150 complex or purely solid ovarian masses were detected in 124 patients. The study included 42 benign and 108 malignant (26 borderline and 82 invasive malignant) masses. The histological types of ovarian tumours included in the study are listed in Table 1.
Table 1.
Histological types and category of ovarian tumours included in the study
| Histological type (n = 150) | Benign (n = 42; 28%) | Borderline (n = 26; 17.3%) | Malignant (n = 82; 54.7%) |
|---|---|---|---|
| Epithelial tumours (n = 92; 61.3%) | Cystadenofibroma (3; 2%) Brenner tumour (5; 3.3%) |
Serous cystadenoma (12; 8%) Mucinous cystadenoma (13; 8.7%) Cystadenofibroma (1; 0.7%) |
Serous cystadenocarcinoma (34; 22.7%) Mucinous cystadenocarcinoma (19; 12.7%) Endometrioid adenocarcinoma (3; 2%) Clear cell adenocarcinoma (1; 0.7%) Undifferentiated carcinoma (1; 0.7%) |
| Germ cell tumours (n = 18; 12%) | Mature teratoma (11; 7.3%) | Dysgerminoma (2; 1.3%) Immature teratoma (5; 3.3%) |
|
| Sex cord-stromal tumours (n = 24; 16%) | Fibrothecoma/thecoma (17; 11.3%) Sclerosing stromal tumour (1; 0.7%) |
– | Granulosa cell tumour (5; 3.3%) Poorly differentiated Sertoli–Leydig cell tumour (1; 0.7%) |
| Metastatic (n = 7; 4.7%) | – | – | Krukenberg tumour (7; 4.7%) |
| Others (n = 9; 6%) | Collusion tumour (5; 3.3%) (teratoma and cystadenoma) | – | Non-Hodgkin lymphoma (2; 1.3%) Squamous cell carcinoma on top of immature teratoma (2; 1.3%) |
Data are reported as (number; percent).
Semi-quantitative analysis was applied as follows:
(1) MRE% ranged between 65% and 158% with median value 98.5% for benign ovarian masses, between 81% and 124% with median value of 100% for borderline masses and between 144.5% and 222.5% with median value of 150.5% for invasive malignant masses. MRE% was higher for malignant than for benign and borderline masses (p < 0.001), but no significant difference was noted between benign and borderline ones (p > 0.05).
(2) Tmax was early (≤120-s post-contrast injection) in 59.7% (n = 49/82) of malignant invasive masses and 27% (n = 7/26) and 4.7% (n = 2/42) in borderline and benign masses, respectively. Tmax was of shorter duration in malignant than in benign (p < 0.01) and borderline (p < 0.001) masses. Borderline masses showed shorter time than benign (p < 0.05) masses.
Benign masses displayed median time value of 278 s, borderline masses showed median value of 222 s and invasive malignant masses showed median value of 138.5 s.
Table 2 represents the comparison of MRE% and Tmax for the evaluated ovarian masses.
Table 2.
Comparison of maximum relative enhancement percentage (MRE%) and time of initial peak of maximal uptake (Tmax) for the evaluated ovarian masses
| Dynamic contrast-enhanced MRI parameter | Included ovarian tumours (n = 150) |
p-value |
||||
|---|---|---|---|---|---|---|
| Benign (n = 42) | Borderline (n = 26) | Malignant (n = 82) | Benign vs borderline | Benign vs malignant | Borderline vs malignant | |
| MRE% | 98.5 (65–185) | 100 (81–124) | 150.5 (144.5–222.5) | >0.05 | <0.001 | <0.001 |
| Tmax (s) | 278 (218.5–346) | 222 (183.5–302) | 138.5 (78–178.5) | <0.05 | <0.01 | <0.001 |
Data are reported as median value (first and third interquartile range).
Patterns of plotted SER curves represented (I) continuous rise, (II) plateau and (III) early washout. Multiple ROIs were applied for ovarian masses with large solid component with resultant multiple and different curve patterns; in such situations, the worst curve was the one considered in the statistical analysis.
Type I (continuous rise) curve pattern (suggestive of benign kinetics) was detected in 35.3% (n = 53/150) of the examined ovarian masses: 68% of them (n = 36/53) were proved to be benign, 15% (n = 8/53) were low potentially malignant (borderline) and 17% (n = 9/53) were invasive malignant.
Type II (plateau-indeterminate) curve pattern was noted in 24% (n = 36/150) of the masses. Benign masses displayed 16.7% (n = 6/36), borderline masses displayed 22.2% (n = 8/36) (Figure 2) and malignant masses displayed 61.1% (n = 22/36).
Type III (early washout) curve pattern (suggestive of pathological circulation) was found in 40.7% (n = 61/150) as follows: 16.4% (n = 10/61) for borderline and 83.6% (n = 51/61) for malignant ovarian masses. None of the pathologically proved benign ovarian masses showed Type III curve pattern.
The accuracy of the classic MRI examination in evaluating each pathological entity of the included ovarian tumours was 69% for benign (n = 29/42), 7.7% for borderline (n = 2/26) and 71.9% for malignant (n = 59/82) tumours.
The classic pelvic MR misinterpreted 7 masses as benign and 17 masses as malignant where the pathological specimen revealed borderline entity. Moreover, nine proved malignant and six proved benign masses showed misleading morphology with consequent improper radiological diagnosis.
Dynamic contrast MR examination depending on the quantitative criteria of the included masses was able to predict accurate diagnosis and improve performance of the classic MRI pelvic examination in evaluation of 76.2% of benign (n = 32/42) and 96.3% of malignant (n = 79/82) masses with a special focus on borderline pathology that was suggested in 20 out of 26 masses with an estimated value of 77% (compared with only 7.7% with the classic MRI).
Statistical analysis was performed for each of the dynamic post-contrast parameters to assess its ability in discriminating benign from malignant (borderline/invasive) ovarian masses (Table 3).
Table 3.
Diagnostic performance of the individual dynamic contrast-enhanced MR (DCE-MR) parameters in differentiating ovarian masses in the present study
| DCE-MR parameter | Ovarian masses (n = 150) |
Sensitivity (%) | Specificity (%) | Accuracy (%) | Likelihood ratio |
||
|---|---|---|---|---|---|---|---|
| Benign 42 (28) | Borderline and Malignant 108 (72) | Positive | Negative | ||||
| Maximum relative enhancement percentage | |||||||
| <120 | 30 (20) | 13 (8.7) | 88 | 71.4 | 83.3 | 1.25 | 1.21 |
| >120 | 12 (8) | 95 (63.3) | |||||
| Time of initial peak of maximal uptake (s) | |||||||
| >200 | 34 (22.7) | 37 (24.7) | 65.7 | 80.1 | 70 | 0.83 | 0.80 |
| <120 | 8 (5.3) | 71 (47.3) | |||||
| Slope enhancement ratio curves | |||||||
| Type I | 36 (24) | 17 (11.3) | 84.2 | 85.7 | 84.7 | 1 | 0.97 |
| Type II–III | 6 (4) | 91 (60.7) | |||||
Data are reported as number (percent).
For the sake of statistical simplification, we performed a special analysis between borderline masses considered as the negative pathology and the invasive malignant masses as the positive pathology regarding each parameter of the semi-quantitative evaluation of the DCE sequence (Table 4).
Table 4.
Diagnostic performance of the individual dynamic contrast-enhanced MR (DCE-MR) parameters in differentiating malignant ovarian masses in the present study
| DCE-MR parameter | Malignant ovarian masses (n = 108) |
Sensitivity (%) | Specificity (%) | Accuracy (%) | |
|---|---|---|---|---|---|
| Borderline 26 (24) | Invasive malignant 82 (76) | ||||
| Maximum relative enhancement percentage | |||||
| <120 | 7 (6.4) | 23 (21.3) | 72 | 73 | 72.2 |
| >120 | 19 (17.6) | 59 (54.6) | |||
| Time of initial peak of maximal uptake (s) | |||||
| >200 | 15 (13.9) | 33 (30.5) | 59.7 | 57.7 | 59.2 |
| <120 | 11 (10.2) | 49 (45.4) | |||
| Slope enhancement ratio curves | |||||
| Type I–II | 16 (14.8) | 31 (28.7) | 62.2 | 61.6 | 62 |
| Type III | 10 (9.3) | 51 (47.2) | |||
Data are reported as number (percent).
According to us, the MRE% cut-off value between benign and malignant entities was 120%; such value presented maximum sensitivity of 88% (n = 95/108) and specificity of 71.4% (n = 30/42). Early Tmax showed sensitivity of 65.7% (n = 71/108) and specificity of 80.1% (n = 34/42). MRE% was more accurate (83.3%, n = 125/150) than Tmax (70%, n = 105/150) in the context of detecting malignancy in the examined ovarian masses. Early washout SER curve pattern showed sensitivity of 84.2% (n = 91/108), specificity of 85.7% (n = 36/42) and accuracy of 84.7% (n = 91/108). The MRE% had the highest sensitivity (88%), whereas the SER curves had the highest specificity (85.7%) and accuracy (84.7%).
DISCUSSION
Pre-operative differentiation of complex ovarian masses, whether it is benign or malignant, is often difficult. Inaccurate diagnosis subjects patients with benign ovarian tumours to excessive unnecessary surgical procedures.22 Moreover, some masses could be diagnosed, and managed, intraoperatively as benign, to be discovered later as being malignant or borderline malignant.
In an attempt to solve this problem, several modalities were resorted to; the tumour marker levels, ultrasonography morphologic criteria, the intraoperative frozen section examinations or the intraoperative criteria and surgical staging, but still, we are repeatedly faced by the “pathological surprises” with the results contradicting the surgical procedure performed.
In 2006, Gundogdu et al23 evaluated DCE-MR imaging performance on normal ovaries. Other studies24,25 declared that early enhancement on post-contrast MRI is one of the diagnostic factors in distinguishing borderline and malignant from benign ovarian masses. But, they have not focused on the kinetic parameters as a valued criterion in their evaluation.
In a way to consider enhancement kinetics, Dilks et al26 in 2010 stated that quantitative DCE-MRI provides an accurate method for the prediction of malignancy, especially in indeterminate ovarian masses, but in 2012, Bernardin et al27 found that borderline tumours demonstrate a significant overlap with benign masses if DCE-MRI threshold criteria were used.
In our work, we tried to make use of the DCE-MRI parameters as a specific method in evaluating ovarian masses with suspicious or malignant features on imaging and thus help in achieving proper management guidance.
In 2008, Thomassin-Naggara et al15 performed an initial experiment to study the correlation between DCE-MR parameters and angiogenesis biomarkers. They found that invasive tumours showed the highest EA and the MS of these tumours were steeper than benign and borderline tumours. Benign tumours showed the longest T1/2max.
We obtained comparable results as the EA (expressed as MRE%) was higher for malignant than for benign masses in our study, and in cases of malignant and borderline masses, it showed even more significant difference (p < 0.001). Regarding Tmax, there was significant difference in respect to benign, borderline and malignant masses (malignant vs benign, p < 0.01; malignant vs borderline, p < 0.001; and borderline vs benign, p < 0.05).
Several studies6,15,23 that had dealt with dynamic MR parameters in epithelial ovarian tumours mentioned an EA% cut-off of 114% in differentiating benign from invasive ovarian masses. Such cut-off displayed maximum sensitivity of 83% and specificity of 72%.15 According to us, EA% cut-off was 120%, which is a higher value than estimated in previous studies; this may be attributed to the inclusion of different histological types not just the epithelial sector (as previously demonstrated in other literature), with some of these masses (benign = 11 and malignant = 12) found to be functioning ones (i.e. hormone-dependent tumours) (Figures 1, 5 and 6). This finding can justify the unexpected high EA% observed in the study elicited by some benign solid ovarian masses as explained by previous references: “tumours with functioning ovarian stroma show intense enhancement on MRI, reflecting the hypervascularity”.28,24
Figure 5.
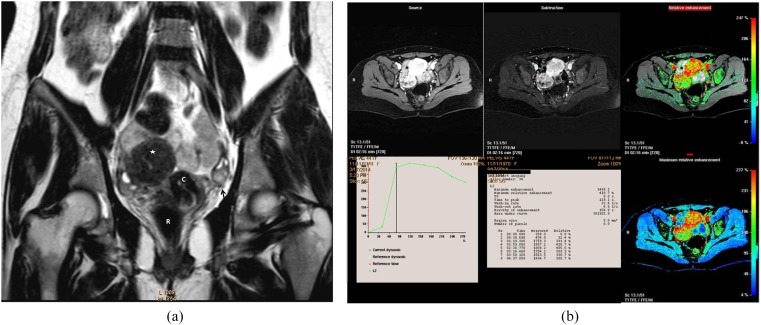
Right ovarian poorly differentiated Sertoli–Leydig tumour in a 44-year-old female, amenorrhoeic since 7 months. (a) Coronal T2 weighted fast spin echo shows right ovary purely solid pelvic mass of intermediate signal intensity (star). Note that the right ovary shows few follicles. Normal left ovary (black arrow). (b) Quantitative assessment of the right ovarian mass displayed a high maximum relative enhancement percentage of 418%, Tmax of 119 s, and Type III malignant curve pattern seen demonstrated in a collective figure that included T1 high-resolution isotropic volumetric examination source image, subtraction, colour-coded and colour mapping images. C, cervix; R, rectum.
Previous studies considered early uptake to be at 60 s after injection of contrast,1,24 provided that each series of the dynamic sequence takes 22–30 s duration. Other researchers even mentioned 30 s after contrast injection.15,29 In such studies, the dynamic sequence was two-dimensional gradient-echo fast low angle shot sequence that was performed through the tumour at the level of presumed solid tissue observed on non-enhanced MR images. We used the dynamic sequence (3D THRIVE); here, the FOV included was not only the solid portion of the involved ovary but the whole pelvis. This condition required longer acquisition time per series with the advantages of acquiring large FOV and small slice thickness without suffering from aliasing and Zebra artefacts; also, it allowed the possibility of 3D multiplanar reformatting (MPR) that permitted the evaluation of (1) ovarian masses even the large ones whether unilateral or bilateral, (2) the uterus, (3) the urinary bladder, (4) the pelvic lymph nodes and (5) ascites (if present), all in a solitary image that could be orientated in the straight or oblique: sagittal, axial and coronal views irrespective of the original orientation taken at the time of initial acquisition (Figure 6).
Yet, we have to admit that this long acquisition time of the individual series in the dynamic post-contrast sequence had affected the considered early Tmax duration (≤120 s from the start of the dynamic sequence) to be longer than prior publications.
According to Thomassin-Naggara et al,15 the MS was the best criterion for distinguishing invasive from non-invasive (benign and borderline) ovarian masses. Bernardin et al27 considered curve Type III to be specific for invasive ovarian tumours.
During routine work with the usual post-contrast series, possible diagnostic overlap could happen between benign functioning tumours with complex appearance and malignant ovarian ones.
Such serious drawback was eliminated in the present study by the use of post-contrast dynamic sequence that expresses contrast/tumour behaviour not only by the time peak of contrast uptake but also by the SER.
In our opinion, plotted SER curves especially “early washout” pattern are the best parameter to predict the proper diagnosis of ovarian masses with likelihood ratio (LR) positive = 1 and LR negative = 0.97.
Type III “early washout” pattern enhanced the suggestion of proper diagnosis in 51 out of 82 proved invasive malignant masses (Figures 4–6), and its absence was a common feature of benign masses (n = 42/42). On the other hand, Type I curve pattern suggest benignity of the purely solid masses and borderline pathology in complex masses with small solid component (Figure 7).
The SER suggestion was sometimes more in concordance with the pathology outcome than the tumour morphology (Figures 2, 4 and 5). In Figure 4, MR morphology of the ovarian mass presumed immature teratoma with the characteristic Rokahtinushy nodule and the fat signal; yet, the plotted SER presented a washout curve pattern, and actually, it turned out to be squamous cell carcinoma on the top of the immature teratoma. In Figures 2 and 3, morphology suggested invasive ovarian malignancy, but the elicited curve showed delayed peak of contrast uptake and progressively rising pattern. Such kinetics matched with the borderline pathology that required just conservative salpingo-oophorectomy instead of aggressive surgery. In Figure 5, the assumption was benign likely ovarian fibroma, yet the curve was of malignant pattern and the pathology was poorly differentiated Sertoli–Leydig tumour.
The graphed SER curves had another advantage, they can eliminate the risk of the SNR effect in the subtracted images used for ROI placement and kinetic analysis. The placement of ROIs on areas of misregistration artefact instead of actual enhancing tumour tissue showed non-pattern curves with multiple peaks and declines (artificial curves) not following any of the logic curve patterns.
Few limitations of the study were found: (1) the patient selection may have been biased as masses were determined by preliminary pelvic ultrasound and then referred for MRI; this raises the possibility of missing some ovarian masses with small solid components; and (2) in the present work, the kinetic criteria of the included masses were subjected to semi-quantitative analysis that supplied enhancement descriptors with no consideration for the patients' physical and physiological variabilities.
On the other hand, strengths included: (1) the ability to analyse dynamic post-contrast MRI in predicting the proper diagnosis of ovarian masses with solid components prior to surgical intervention and/or chemoradiotherapy. Such ability is very important for proper management planning especially in cases of masses with low potential malignancy. The study could highly discriminate between borderline and invasive cancer, and this saves the patients from hazards of unsuitable excessive surgery, aggressive management and of course unnecessary anxiety. (2) An individual analysis was performed for each dynamic MR parameter to find out the best criterion to rely upon in the assessment. (3) We have analysed dynamic post-contrast MRI of ovarian masses with different histological types not just the epithelial group, and therefore, a broader and rather fulfilled analysis was provided. To our knowledge, the present study is the first one to state a cut-off value for initial peak of contrast uptake regarding different pathologies of ovarian tumours.
CONCLUSION
Contrast-enhanced MRI using dynamic sequence can supply valuable information about the vascularity changes in complex and purely solid ovarian masses, which enhanced the differentiation of indeterminate ovarian tumours. In cases of complex solid masses, such sequences especially with the SER curves provided quantitative data that increased the specificity for distinguishing borderline from invasive malignant tumours.
Contributor Information
S M Mansour, Email: sahar_mnsr@yahoo.com.
S Saraya, Email: samsaraya@hotmail.com.
Y El-faissal, Email: yahiaelfaissal@gmail.com.
REFERENCES
- 1.Jung SE, Lee JM, Rha SE, Byun JY, Jung JI, Hahn ST. CT and MR imaging of ovarian tumours with emphasis on differential diagnosis. Radiographics 2002; 22: 1305–25. doi: 10.1148/rg.226025033 [DOI] [PubMed] [Google Scholar]
- 2.Berek JS, Hacker NF. Practical gynecologic oncology. 4th edn. Philadelphia, PA: Lippincott Williams & Wilkins; 2005. pp. 443–54. [Google Scholar]
- 3.Berek JS, Hacker NF. Staging and second-look operations in ovarian cancer. In: Alberts DS, Surwit EA, eds. Ovarian cancer. Boston, MA: Martinus Nijhoff; 1985. pp. 109–27. [Google Scholar]
- 4.Gultekin E, Gultekin OE, Cingillioglu B, Sayhan S, Sancil M, Yildirim Y. The value of frozen section evaluation in the management of borderline ovarian tumours. J Cancer Res Ther 2011; 7: 416–20. doi: 10.4103/0973-1482.92005 [DOI] [PubMed] [Google Scholar]
- 5.Gupta N, Rajpal T, Sharma S. Evaluating the accuracy of frozen section in borderline ovarian tumours. J Clin Oncol 2013; 31(Suppl.): Abstract 5564. [Google Scholar]
- 6.DeSouza NM, O'Neill R, McIndoe GA, Dina R, Soutter WP. Borderline tumors of the ovary: CT and MRI features and tumour markers in differentiation from stage I disease. AJR Am J Roentgenol 2005; 184: 999–1003. doi: 10.2214/ajr.184.3.01840999 [DOI] [PubMed] [Google Scholar]
- 7.American Cancer Society. Cancer facts and figures 2007. Atlanta, GA: American Cancer Society; 2007. [Updated 3 August 2009; accessed 30 October 2013.] Available from: http://www.cancer.org/downloads/STT/CAFF2007PWSecured.pdf [Google Scholar]
- 8.Meyer T, Rustin GSJ. Role of tumour markers in monitoring epithelial ovarian cancer. Br J Cancer 2000; 82: 1535–8. doi: 10.1054/bjoc.2000.1174 [DOI] [PMC free article] [PubMed] [Google Scholar]
- 9.Healy DL, Burger HG, Mamers P, Jobling T, Bangah M, Quinn M, et al. Elevated serum inhibin concentrations in postmenopausal women with ovarian tumors. N Engl J Med 1993; 329: 1539–42. doi: 10.1056/NEJM199311183292104 [DOI] [PubMed] [Google Scholar]
- 10.Valentini AL, Gui B, Miccò M, Mingote MC, De Gaetano AM, Ninivaggi V, et al. Benign and suspicious ovarian masses—MR imaging criteria for characterization: pictorial review. J Oncol 2012; 2012: 481806. doi: 10.1155/2012/481806 [DOI] [PMC free article] [PubMed] [Google Scholar]
- 11.Sohaib SA, Sahdev A, Van Trappen PO, Jacobs IJ, Reznek RH. Characterization of adnexal mass lesions on MR imaging. AJR Am J Roentgenol 2003; 180: 1297–304. doi: 10.2214/ajr.180.5.1801297 [DOI] [PubMed] [Google Scholar]
- 12.Brasch RC, Li KC, Husband JE, Keogan MT, Neeman M, Padhani AR, et al. In vivo monitoring of tumour angiogenesis with MR imaging. Acad Radiol 2000; 7: 812–23. doi: 10.1016/S1076-6332(00)80630-3 [DOI] [PubMed] [Google Scholar]
- 13.Padhani AR, Dzik-Jurasz A. Perfusion MR imaging of extracranial tumour angiogenesis. Top Magn Reson Imaging 2004; 15: 41–57. doi: 10.1097/00002142-200402000-00005 [DOI] [PubMed] [Google Scholar]
- 14.Cuenod CA, Fournier L, Balvay D, Guinebretière JM. Tumour angiogenesis: pathophysiology and implications for contrast-enhanced MRI and CT assessment. Abdom Imaging 2006; 31: 188–93. doi: 10.1007/s00261-005-0386-5 [DOI] [PubMed] [Google Scholar]
- 15.Thomassin-Naggara I, Bazot M, Daraï E, Callard P, Thomassin J, Cuenod CA. Epithelial ovarian tumours: value of dynamic contrast-enhanced MR imaging and correlation with tumour angiogenesis. Radiology 2008; 248: 148–59. doi: 10.1148/radiol.2481071120 [DOI] [PubMed] [Google Scholar]
- 16.Imaoka I, Wada A, Kaji Y, Hayashi T, Hayashi M, Matsuo M, et al. Developing an MR imaging strategy for diagnosis of ovarian masses. Radiographics 2006; 26: 1431–48. doi: 10.1148/rg.265045206 [DOI] [PubMed] [Google Scholar]
- 17.Kuhl CK, Schild HH. Dynamic image interpretation of MRI of the breast. J Magn Reson Imaging 2000; 12: 965–74. doi: [DOI] [PubMed] [Google Scholar]
- 18.Kuhl CK, Mielcareck P, Klaschik S, Leutner C, Wardelmann E, Gieseke J, et al. Dynamic breast MR imaging: are signal intensity time course data useful for differential diagnosis of enhancing lesions? Radiology 1999; 211: 101–10. doi: 10.1148/radiology.211.1.r99ap38101 [DOI] [PubMed] [Google Scholar]
- 19.Manfredi R, Mirk P, Maresca G, Margariti PA, Testa A, Zannoni GF, et al. Local-regional staging of endometrial carcinoma: role of MR imaging in surgical planning. Radiology 2004; 231: 372–8. doi: 10.1148/radiol.2312021184 [DOI] [PubMed] [Google Scholar]
- 20.Sala E, Wakely S, Senior E, Lomas D. MRI of malignant neoplasms of the uterine corpus and cervix. AJR Am J Roentgenol 2007; 188: 1577–87. doi: 10.2214/AJR.06.1196 [DOI] [PubMed] [Google Scholar]
- 21.Mussurakis S, Buckley DL, Bowsley SJ, Carleton PJ, Fox JN, Turnbull LW, et al. Dynamic contrast-enhanced magnetic resonance imaging of the breast combined with pharmacokinetic analysis of gadolinium-DTPA uptake in the diagnosis of local recurrence of early stage breast carcinoma. Invest Radiol 1995; 30: 650–62. doi: 10.1097/00004424-199511000-00005 [DOI] [PubMed] [Google Scholar]
- 22.Kim KA, Park CM, Lee JH, Kim KH, Cho SM, Kim B, et al. Benign ovarian tumours with solid and cystic components that mimic malignancy. AJR Am J Roentgenol 2004; 182: 1259–65. doi: 10.2214/ajr.182.5.1821259 [DOI] [PubMed] [Google Scholar]
- 23.Gundogdu S, Erdem CZ, Erdem LO, Bayar U. Enhancement kinetics of normal ovaries on dynamic contrast-enhanced MR imaging. Eur J Obstet Gynecol Reprod Biol 2006; 129: 60–4. doi: 10.1016/j.ejogrb.2006.03.017 [DOI] [PubMed] [Google Scholar]
- 24.Stevens SK, Hricak H, Stern JL. Ovarian lesions: detection and characterization with gadolinium-enhanced MR imaging at 1.5 T. Radiology 1991; 181: 481–8. doi: 10.1148/radiology.181.2.1924792 [DOI] [PubMed] [Google Scholar]
- 25.Van Vierzen PB, Massuger LF, Ruys SH, Barentsz JO. Borderline ovarian malignancy: ultrasound and fast dynamic MR findings. Eur J Radiol 1998; 28: 136–42. doi: 10.1016/S0720-048X(97)00122-8 [DOI] [PubMed] [Google Scholar]
- 26.Dilks P, Narayanan P, Reznek R, Sahdev A, Rockall A. Can quantitative dynamic contrast enhanced MRI independently characterize an ovarian mass? Eur J Radiol 2010; 20: 2176–83. doi: 10.1007/s00330-010-1795-6 [DOI] [PubMed] [Google Scholar]
- 27.Bernardin L, Dilks P, Liyanage S, Miquel ME, Sahdev A, Rockall A. Effectiveness of semiquantitative multiphase dynamic contrast-enhanced MRI as a predictor of malignancy in complex adnexal masses: radiological and pathological correlation. Eur J Radiol 2012; 22: 880–90. doi: 10.1007/s00330-011-2331-z [DOI] [PubMed] [Google Scholar]
- 28.Saida T, Tanaka Y, Minami M. Steroid cell tumour of the ovary, not otherwise specified: CT and MR findings. AJR Am J Roentgenol 2007; 188: W393–4. doi: 10.2214/AJR.06.0867 [DOI] [PubMed] [Google Scholar]
- 29.Thomassin-Naggara I, Bazot M, Daraï E, Callard P, Marsault C, Cuenod CA. Can DCE-MRI predict the nature of ovarian tumours? A correlation between DCE-MRI and angiogenesis biomarkers. Angiogenesis 2006; 7: 2310. [Google Scholar]


