Abstract
Objective:
Determination of an optimal clinical target volume (CTV) is complex and remains uncertain. The aim of this study was to develop a glioblastoma multiforme (GBM) model to be used for evaluation of current CTV practices for external radiotherapy.
Methods:
The GBM model was structured as follows: (1) a Geant4 cellular model was developed to calculate the absorbed dose in individual cells represented by cubic voxels of 20 μm sides. The system was irradiated with opposing 6 MV X-ray beams. The beams encompassed planning target volumes corresponding to 2.0- and 2.5-cm CTV margins; (2) microscopic extension probability (MEP) models were developed using MATLAB® 2012a (MathWorks®, Natick, MA), based on clinical studies reporting on GBM clonogenic spread; (3) the cellular dose distribution was convolved with the MEP models to evaluate cellular survival fractions (SFs) for both CTV margins.
Results:
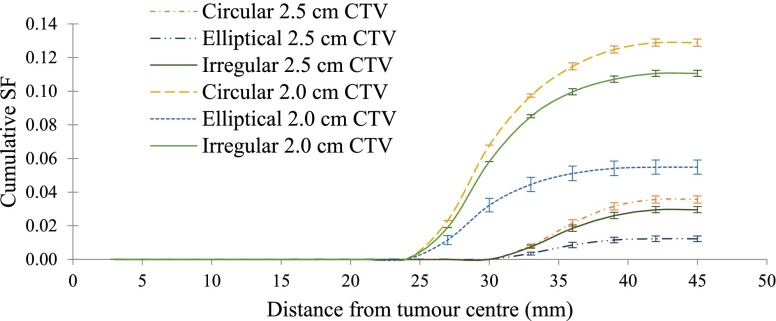
A CTV margin of 2.5 cm, compared to a 2.0-cm CTV margin, resulted in a reduced total SF from 12.9% ± 0.9% to 3.6% ± 0.2%, 5.5% ± 0.4% to 1.2% ± 0.1% and 11.1% ± 0.7% to 3.0% ± 0.2% for circular, elliptical and irregular MEP distributions, respectively.
Conclusion:
A Monte Carlo model was developed to quantitatively evaluate the impact of GBM CTV margins on total and penumbral SF. The results suggest that the reduction in total SF ranges from 3.5 to 5, when the CTV is extended by 0.5 cm.
Advances in knowledge:
The model provides a quantitative tool for evaluation of different CTV margins in terms of cell kill efficacy. Cellular platform of the tool allows future incorporation of cellular properties of GBM.
INTRODUCTION
Gliomas are the most common types of brain tumours and are known for their aggressive proliferation and extensive invasion into normal tissue. Glioblastoma multiforme (GBM) is the most aggressive form of glioma with a very low survival rate (i.e. 27.2% at 2 years when concomitant or adjuvant chemotherapy and radiotherapy are administered1).
When applying external beam radiotherapy to treat GBM, determination of optimal clinical target volume (CTV) margins [i.e. “volume encompassing visible gross tumour volume (GTV) and subclinical malignant disease”2] can be generally problematic, since the exact extent of microscopic disease to be covered by the CTV cannot be fully visualized using current imaging techniques and therefore remains uncertain. This extent may also vary in different directions and be patient specific. This is of particular concern in radiation treatment of GBMs which are notorious for their extensive diffusion and poor prognosis. In addition, large discrepancies between the outcomes of histopathological studies on the extent of tumour cell infiltration into normal tissue, beyond the macroscopic tumour boundary, exist for this tumour type.3 A list of clinical studies addressing the extent of GBM infiltration into normal brain tissue is summarized in Table 1. As indicated in Table 1, there is no clear consensus on what imaging modality should be used or whether the CTV is applied to the GTV2 or includes oedema. Additionally, for the most generous CTV margin proposed (i.e. 2.0 cm from oedema), according to the study of Bondiau et al,15 15.1% and 2.1% of tumour clonogenic cells were predicted to be outside of the CTV margin for high diffusion–low proliferation and high proliferation–low diffusion types of GBM, respectively. The underlying reason for this variation in applied margins stems from the lack of information and the uncertainty in the extent of clonogenic cell infiltration. This microscopic extension (ME) uncertainty has been reported to be responsible for marginal and distant GBM recurrences.18,19 Intrinsic radioresistance of GBM stem cells is another major cause of tumour relapse which explains the high in-field recurrences following radiotherapy treatment for GBM.20 Therefore, to be able to enhance tumour control, further clinical investigations are required to improve understanding of the dynamics of GBM ME beyond the GTV. Mathematical models, governed by clinical observations, can be of assistance if they can simulate biological systems as well as treatment regimens, to predict treatment outcomes in terms of cell kill efficiency.
Table 1.
Conventional and proposed margins of clinical target volume (CTV) for brain tumour
| Study | Number of patients | Diagnosis | Conventional CTV margin | Range of microscopic extension | Comments |
|---|---|---|---|---|---|
| Burger et al4 | 15 | GBM | CT + 2 cm | 0–5 cm | 20% of cases, 2–3 cm infiltration; 13% of cases, 3–5 cm infiltration |
| Halperin et al5 | 15 | GBM | CT + 1 cm | 0–3 cm | Proposed CTV margin: T2 MRI + 3 cm |
| Wallner et al6 | 34 | GBM and astrocytoma | CT + 3–4 cm | 0–9.3 cm | NA |
| Gaspar et al7 | 70 | GBM | CT + 2 cm | 0–4 cm | Proposed CTV margin: CT + 4 cm |
| Hess et al8 | 66 | GBM | CT + 2 cm | NA | Planning target volume = CT + 2 cm |
| Jansen et al9 | 1283 | High-grade glioma | CT + 2–3 cm | NA | Proposed CTV margin: CT + 2 cm |
| Aydin et al10 | 46 | High-grade glioma | CT + 2–3 cm | 0.2–4.8 cm | Proposed CTV margin: CT + 3 cm |
| Chang et al11 | 48 | GBM | NA | NA | Proposed CTV margin: T1 MRI + 2 cm |
| Lee et al12 | 16 | GBM | T1 MRI + 1.5 cma | NA | 43% non-central recurrence |
| Matsuo et al13 | 32 | GBM | NA | NA | Proposed CTV margin: T2 MRI + 2 cm |
| Minniti et al14 | 105 | GBM | NA | NA | Proposed CTV margin: T1 MRI + 2 cm |
| Bondiau et al15 | NA | GBM; high diffusion–low proliferation | T2 MRI + 2 cmb | NA | 15.1% (cells outside margin) |
| Bondiau et al15 | NA | GBM; high proliferation–low diffusion | T2 MRI + 2 cm | NA | 2.1% (cells outside margin) |
| McDonald et al16 | 62 | GBM | T2 MRI + 2 cm | NA | T2 MRI + 0.5 cm |
| Trepanier et al17 | 9 | GBM | T1 MRI + 2 cm | NA | 44% non-central recurrence |
GBM, glioblastoma; GTV, gross tumour volume; NA, not applicable.
T1 MRI used for GTV delineation.
T2 MRI used to delineate both the GTV and oedema.
Biomathematical modelling is a valuable tool in providing qualitative and quantitative predictions of oncogenesis and treatment outcomes for a variety of circumstances, for instance, the application of different CTV margins or therapeutic regimens. In a previous report,21 a comprehensive review was presented on mathematical models developed for tumour growth and invasion. Two approaches are generally used for modelling: deterministic and stochastic, with stochastic modelling [i.e. Monte Carlo (MC)] being more promising to simulate oncogenesis and tumour response to treatment. This is due to its use of probability distributions which more realistically depict the intrinsically probabilistic nature of radiobiological and physical processes.21 Furthermore, analytical models are only capable of describing tumour behaviour at the macroscopic level and fail to provide predictions at the cellular and subcellular (i.e. microscopic) scale.21
In this study, a comprehensive and flexible GBM treatment modelling framework has been developed, consisting of (1) ME probability models, simulating GBM and its ME based on clinical studies investigating GBM infiltration (i.e. a range of infiltration types was simulated); (2) a MC cellular model, predicting the dose delivered to each cell in the GBM model; (3) survival fraction (SF) calculation algorithm using microscopic extension probability (MEP) models and cellular dose calculation based on specific radiobiological properties of individual cells (in this work two gene types were compared).
The aim of the present work was to utilize this model for quantitative evaluation of current CTV practices applied in external beam radiotherapy in terms of the surviving fraction of GBM tumour cells after treatment with 6 MV photon beam. This work concentrates on the SF within the CTV margin and its dependence on the ME extension rather than that within the GTV. This cellular-based model represents a novel and flexible toolkit which enables incorporation of radiobiological characteristics of individual GBM cells.
METHODS AND MATERIALS
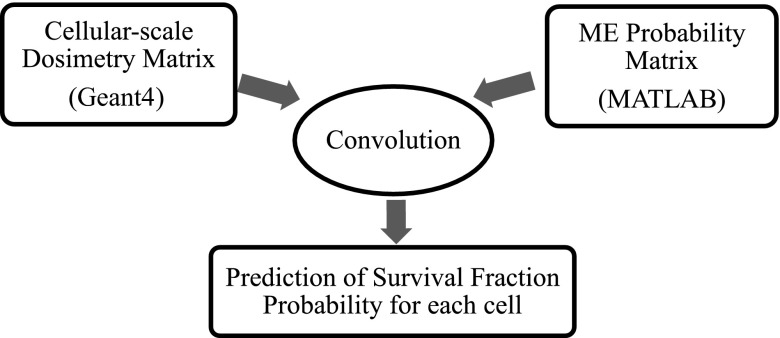
The mathematical model in this work was developed in three steps. Firstly, the MC toolkit “Geant4” v. 4.9.6.p01 (https://geant4.cern.ch/) was used to calculate the absorbed dose in each cell within a brain and GBM model using a 6-MV photon beam and standard fractionation scheme (i.e. 30 fractions of 2 Gy, 60 Gy in total).22 Secondly, various MEP models were developed in MATLAB® (MathWorks®, Natick, MA) to simulate the infiltration of clonogenic cells within healthy brain. Finally, the dose matrices calculated in Geant4 were exported into MATLAB and individually convolved with the MEP models to obtain cellular-based SFs. This methodology is illustrated in Figure 1, and the components of the model are discussed in following sections.
Figure 1.
A flowchart illustrating the mathematical model structure developed in this work. MATLAB®; MathWorks®, Natick, MA. ME, microscopic extension.
Cell-based dosimetry in Geant4
As the goal of this study was to predict and summate the survival probability of all individual cells following ionizing radiation treatment, a cell-based dosimetry module was designed in Geant4 to calculate the absorbed dose in each cell/voxel. Macroscopic dose matrices, obtained, for example, from commercial treatment planning systems, cannot be used for this purpose as the absorbed dose in each voxel (i.e. approximately 1 mm3) is an average over many cells (i.e. 2500 GBM cells in 1 mm3 voxel) and is therefore insufficient to investigate survival of individual cells. The cellular level platform developed in this work will ultimately allow to assign individual cells with their genetic characteristics, such as α and β parameters, oxygen level, signalling and others.
Three components were needed in the simulation: external 6 MV photon beam source (Appendix A), the geometry of a GBM tumour and its ME, and a cross-section library appropriate for particle tracking at the microdosimetric level.
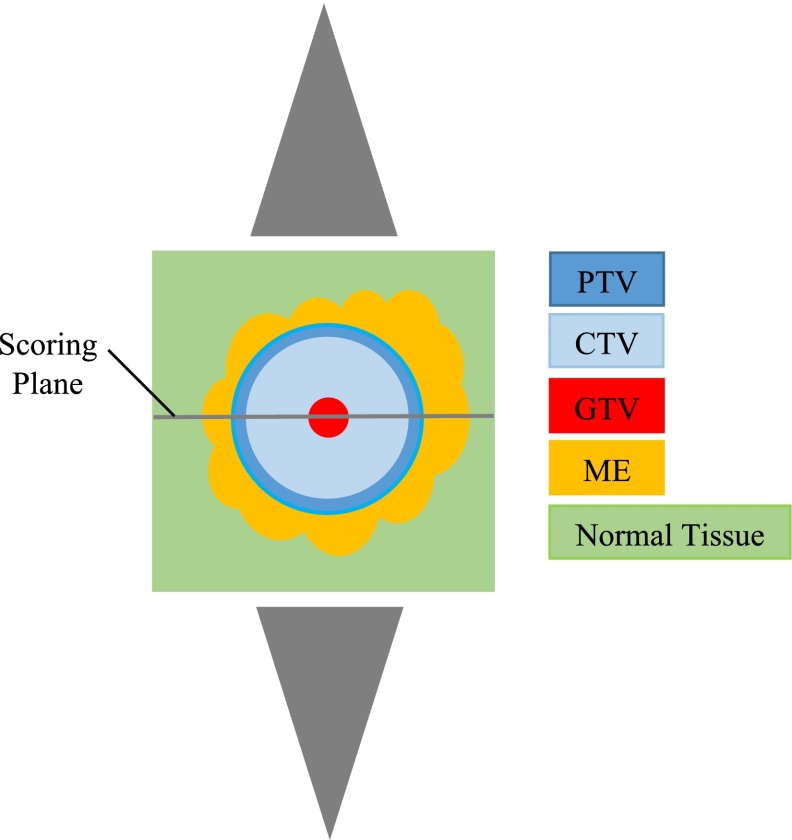
The GBM geometry simulated was a 9 × 9 × 9 cm3 cubic water phantom consisting of a spherical GTV enclosed by regions of ME embedded in normal tissue, as illustrated in Figure 2. The size of the GBM model allows evaluating the entire range of GBM's ME in all directions, which is approximately 4 cm from the gross tumour (i.e. Table 1 and the Clinical data-based microscopic extension probability models section). In order to acquire dose data at the cellular level, the volume was divided into voxels with 20 μm side, which is the average size of glioma cells.23,24
Figure 2.
Simulation geometry: tumour and its microscopic extension, surrounded by normal tissue, the middle dose scoring slice (9 cm× 9 cm × 20 μm) perpendicular to the beam axis and parallel-opposed cone X-ray beams. CTV, clinical target volume; GTV, gross tumour volume; ME, microscopic extension; PTV, planning target volume.
The GBM model was then irradiated using two parallel-opposed 6 MV photon beams. The radiation field size used was 2.5 cm in radius, to encompass the GTV (1 mm), the CTV [2.0-cm (standard margin used clinically)] and a 0.4-cm extra margin to account for set-up and patient movement (i.e. a planning target volume (PTV) margin which is generally between 0.3 and 0.5 cm14,16). The size of the GTV in the present work was limited to 1 mm, as the goal of this work was to investigate the dependence of the SF on the size of CTV margin, which is meant to encompass ME, and how the SF in this region varies for different types of infiltration. As this study does not specifically address SF within the GTV, selecting a larger GTV would only increase the length of processing time required to achieve reasonable statistics [i.e. 45 days on 3 × 20-central processing unit (CPU) Linux clusters for 3 × 10⁸ particles for current geometry] without adding any additional information for the purpose of the present work.
Penelope physics list library, which includes low-energy models (100 eV to approximately GeV) for electrons, positrons and photons, was implemented for dosimetry calculations. To guarantee high precision of calculations, further conditions were set: (1) a limit of 5 μm (1/4 of voxel size) on step size for electrons and positrons; (2) a cut-off value of 5 μm. A threshold/cut-off value is defined such that when the cut is equal to a certain value in range, secondary particles, with a range smaller than the cut, are not originated and their energy is deposited locally. The reason is that while in Geant4 particles are tracked down to zero energy, below a certain energy threshold, the tracking should not be through discrete energy loss for two main reasons: (1) the physics models are not reliable below a certain energy and should be adopted in the energy range recommended by the authors of the models (i.e. 100 eV for Penelope); (2) some processes include infrared divergence increasing the CPU time enormously. In modelling scenarios where more detailed results are required (e.g. ionization damage of DNA itself), the Geant4 DNA package should be used. These details, however, are not required for the resolution required for a cellular level developed in this work. Parallel simulations on 3 × 20-CPU 64-bit Linux clusters were performed for a total number of 3 × 10⁸ particles. While the particle tracking was carried out in the entire GBM volume, the dose was scored in a single middle slice of 9 cm × 9 cm × 20 μm (Figure 2) due to computation time limitation (i.e. up to 45 days). The output of the simulation was the absorbed dose in each voxel (each cell), irrespective of whether the cell was a normal or tumour clonogenic cell.
Microscopic extension probability models
MEP models were developed in MATLAB 2012a. It was assumed that tumour clonogen density reduces from the edge of the GTV and hence the probability that a cell was clonogenic decreased as a function of distance from the GTV. This assumption was based on several histopathological data presented in the literature, including the study of Holland et al, and other studies summarized in a review of histopathological studies by Moghaddasi et al.3 The MEP geometry was the same as the one used in the Geant4 simulation, using the voxel size of 20 μm (i.e. the size of a glioma cell). Each cell/voxel was tagged with a probability that the cell was a clonogen and as a result, a probability distribution of clonogens (i.e. ME) surrounding the GTV was generated. The following probability functions were investigated: exponential, linear and clinical (i.e. the function fitted to clinical data).
Exponential and linear microscopic extension probability models
The rationale for using an exponential MEP function was based on the observed exponential distributions of histological disease in breast and lung carcinomas.25 Here, it was assumed that the MEP is spherical and isotropically reduces from the edge of visible tumour as:
| (1) |
where ri−r0 is the radial distance of ith voxel from the gross tumour surface and the parameter γ (i.e. γ = 1.162) is determined so that MEP complies with boundary conditions based on clinical data observed for GBM.
In order to set an upper limit for the gradient of the clonogenic probability function, a generic linear MEP function was also investigated. Likewise, it was assumed that MEP is spherical and isotropically reduces from the edge of visible tumour as:
| (2) |
Likewise, the parameter γ (i.e. γ = 0.2476) is determined so that MEP complies with boundary conditions based on clinical data observed for GBM.
Clinical data-based microscopic extension probability models
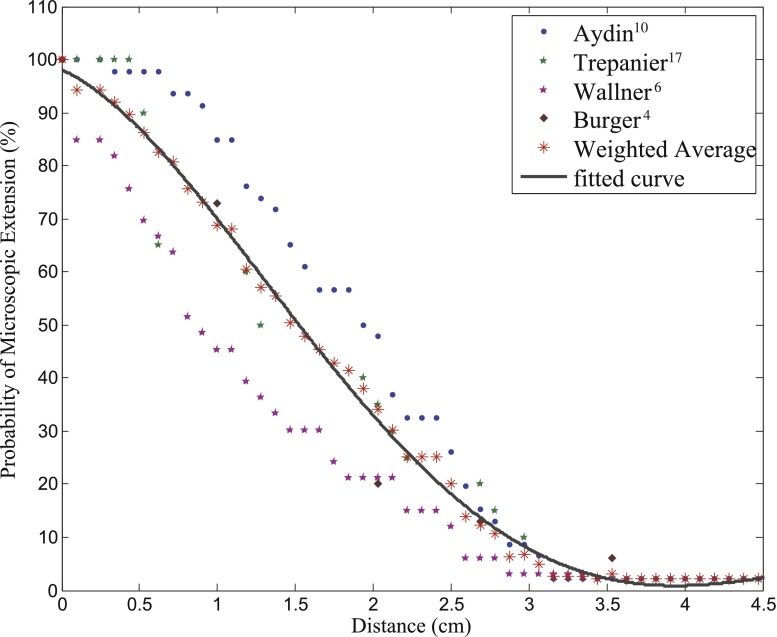
In order to develop a clinically plausible MEP function, the literature was reviewed for studies addressing recurrence patterns of GBM in terms of maximal distance between recurrent and primary tumours,6,10 hispathological analysis of post-mortem GBM specimens,4 and MC-based investigation of recurrence patterns.17 The information from these studies was interpreted in terms of a variable called MEPd which was the probability that diffusion/microscopic disease extended beyond a distance “d”. Data from different studies were combined, as shown in Figure 3, and an average derived, weighted according to the number of patients in each study, for each individual distance.
Figure 3.
Aggregation of clinical studies investigating the extent of infiltration in patients with glioblastoma.
The function fitted to the combined clinical studies was a three-term gaussian:
| (3) |
where
represents the radial distance of the ith voxel from the GTV surface. The individual parameters were determined so that MEP fitted the weighted average of clinical studies. Using the clinical function, the following two-dimensional (2D) MEP patterns were considered: isotropic (i.e. circular) and anisotropic (i.e. elliptical and irregular).
An isotropic 2D distribution of ME was investigated as this assumption is made in clinics for delineation of CTV margins. For this pattern (i.e. circular-clinical MEP), both the tumour and its ME were considered spherical. However, the hypothesis that cell diffusion occurs with an equal probability in every direction is not supported by post-mortem studies of human glioma.4 It was noted from literature that tumour cell diffusion in the brain is highly anisotropic and cancer cells have preferential movement along the paths with the least resistance as determined by MR diffusion tensor imaging26 and modelling studies.19 Given this behaviour of microscopic spread, MEP models with anisotropic distributions generated in the present work were (1) an elliptical distribution (i.e. to capture the preferential diffusion behaviour along white matter fibre tracts19) and (2) a randomly irregular distribution.
In both anisotropic MEP models, elliptical and irregular, the tumour remained spherical and ME was anisotropically propagated. For the elliptical MEP, the parameters of Equation (3) were changed at each polar angle direction of the ellipse. In order to generate a randomly irregular distribution, an algorithm was developed in this work using two random generators for radial extension of proliferation and polar angle direction. As a result, microscopic disease was extended randomly (i.e. random extensions range from 2.0 to 4.5 cm from the GTV based on the combined clinical studies) at random directions. At each direction, the parameters of Equation (3) were adjusted to fit the corresponding radial extension.
Convolution of dose distribution matrix with microscopic extension probability matrix
As mentioned in previous sections, the output of the Geant4 model was the absorbed dose in each individual cell located in a cuboid section of the brain and tumour model. The MEP models provided a clonogenic probability distribution for all cells enclosed in this cuboid section with the volume and voxel size identical to that used in Geant4.
The Geant4 dosimetry matrix was exported to MATLAB and convolved with the MEP model. Survival probability for each cell was then predicted based on the linear quadratic (LQ) model:
| (4) |
where SFi, MEPi, di are the survival probability of the cell located in ith voxel, the probability that the cell in question is a clonogen and the absorbed dose in that cell, respectively. A standard fractionation scheme (i.e. 30 fractions of 2 Gy) was simulated (i.e. n = 30). The tumour response to ionizing radiation also depends highly on the oxygenation level of cells (i.e. oxic vs hypoxic). At this stage of the study, hypoxic cells were not considered. Also, the deformation of ME pattern as a result of tumour shrinkage was not taken into account. Cellular response to radiation and carcinogenesis are modulated mainly by two types of genes: tumour suppressor (TS) genes (e.g. p53) and oncogenes. Any DNA mutation, including loss of functionality/inactivation of TS genes may result in increased radioresistance. GBM cells can express either functional wild-type p53 (wt-p53) or mutant type lacking p53 function (mt-p53). The influence of p53 TS gene function (i.e. wild vs mutant) in GBM radiation response was investigated in an in vitro study of Hass-Kogan et al,27 and α and β values corresponding to each p53 status were obtained from their work. Accordingly, the LQ parameters were assumed as follows: α = 0.17; β = 0.02 for a GBM with mutant p53 (mt-p53) gene expression and α = 0.6; β = 0.06 for a GBM with wild-type p53 (wt-p53) gene expression.27 With respect to α and β values for the wild-type p53, given the high standard deviations in in vitro results, and due to a minimal impact of β value on SF, we assumed a typical tumour α/β ratio of 10. As a result the assumed β value for the wild-type deviates from the study of Hass-Kogan et al;27 this assumption has been made in other similar modelling works.28 The SF within the beam region [i.e. PTV (>90% dose coverage)], the SFs within the penumbra region (defined in this study as the region extending 5.0 mm beyond 90% dose) and the total SFs [i.e. including in-beam, penumbra region and out of field (<1% dose coverage)] were first calculated/predicted for a 2.0-cm CTV margin. As mentioned in the Cell-based dosimetry in Geant4 section, the PTV margin was set to 0.4 cm, thus the simulated beam diameter was 5.0 cm. Convolutions (i.e. MEP with dosimetry matrix using the LQ model) were repeated for both types of p53 gene expressions.
To obtain a quantitative measure of SF reduction with increased treatment margins, the CTV margin extended to 2.5 cm compared to 2.0 cm. The radius of the GTV and the PTV margin remained 0.1 and 0.4 cm, respectively. As a result, the beam diameter was extended to 6.0 cm to encompass the PTV. The dose matrix corresponding to the extended beam was convolved with “clinical” MEP models and cumulative cell SFs were calculated for the same regions as defined above. Calculations were performed for all clinical MEP models: circular, elliptical and irregular.
RESULTS
Geant4 cell-based dosimetry matrix
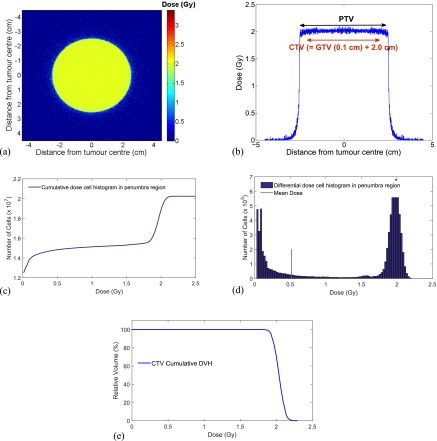
A macroscopic image of a Geant4 cellular dosimetry 2D midplane matrix resulting from the GBM model irradiation with two parallel-opposed 6 MV beams is shown in Figure A4a; the corresponding axial profile is shown in Figure A4b (geometry described in the Cell-based dosimetry in Geant4 section). The matrix contains doses in each cell/voxel (i.e. a cube with 20 μm sides). Using MC technique, the stochastic nature of radiation interactions and therefore absorbed dose in each cell was simulated and used for cell survival predictions.
Microscopic extension probability matrices
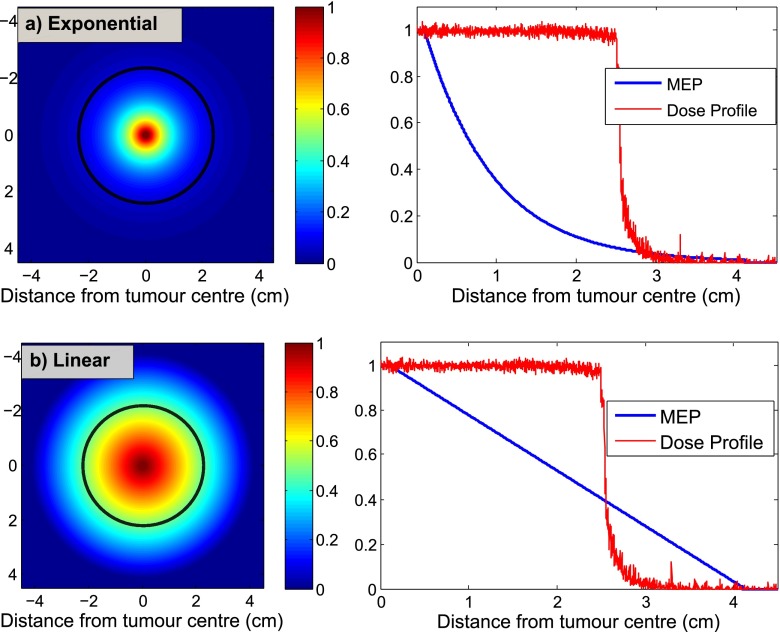
The MEP matrix (Figure 1) assigns clonogenic probability to every cell in the tumour and its surroundings. The 2D MEP distributions for the exponential and linear functions are shown in Figure 4. While exponential function can be used to model the infiltration of breast/lung cancer, it does not seem to represent the behaviour of GBM diffusion as it assigns negligible clonogenic probabilities to cells lying >3 cm from GTV (i.e. PTV covers the ME well), which contradicts clinical observations. The linear function, shown in Figure 4b, considerably increases the clonogenic probability as a function of distance from GTV, and as a result, the PTV does not fully cover the ME.
Figure 4.
Microscopic extension probability (MEP) models representing the probability that a cell is a clonogen based on the distance from the gross tumour volume: (a) exponential, (b) linear. The black contours, superimposed on MEP illustrations, represent the beam regions (i.e. planning target volume = 2.5 cm) related to a 2.0-cm clinical target volume margin receiving ≥90% dose.
As shown in 2D visualization of these models, exponential and linear functions, to an extent, represent two extreme cases, in which the clonogenic density is reduced very rapidly and very slowly, respectively.
The MEP models developed based on combined clinical observations for GBM (i.e. called “clinical”) are shown in Figure 5. Figure 5a shows the clinical MEP model with isotropic (i.e. circular) geometry, and Figures 5b,c illustrate clinical MEP models with anisotropic (i.e. elliptical and irregular, respectively) geometries. In order to illustrate how much of the microscopic disease is not encompassed (i.e. falls beyond the beam and receives <90% dose), the beam (i.e. PTV) is overlayed on the MEP illustrations (i.e. black contours).
Figure 5.
Microscopic extension probability (MEP) distribution models of type “clinical”: (a) circular isotropic, (b) elliptical anisotropic, (c) irregular anisotropic. The black contours, superimposed on MEP illustrations, represent the beam regions (i.e. planning target volume = 2.5 cm) related to a 2.0-cm clinical target volume margin receiving ≥90% dose.
Assessment of survival fractions for 2.0-cm clinical target volume margin
Survival fraction dependence on the microscopic extension geometry and p53 gene status
The results in this section are presented in terms of (a) SF within the beam (>90% dose coverage), (b) SF within penumbra region (i.e. 5.0 mm beyond 90% dose), (c) total SF [including out of beam (<1%), within the beam and penumbra region] and (d) SFs for different p53 gene statuses.
SFs within the beam region utilizing various MEP models for a GBM consisting of cells expressing mt-p53 genes are listed in the first column of Table 2. Based on the assumptions made in this modelling work (i.e. homogeneous cellular composition and normal oxygenation of tumour cells), it was not expected that any surviving cells would exist within beam region; however, non-negligible SF, while minimal, was predicted within the beam (>90% coverage). This in-beam survival could be related to lack of radiosensitivity of tumour cells expressing mt-p53 gene (i.e. α = 0.17; β = 0.02) and stochastic nature of radiation absorbed dose. No statistically significant differences (see p-values in Table 2) were observed between MEP models in terms of SFs within the beam region for a GBM consisting only of clonogens expressing the mt-p53.
Table 2.
Survival fractions (SFs) in different regions and p53 gene statuses using all microscopic extension probability (MEP) models
| MEP model | SF within the beam (%) |
SF in penumbra region (%) |
Total SF (%) |
|||||
|---|---|---|---|---|---|---|---|---|
| mt-p53a (×10−4) | wt-p53b (×10−16) | mt-p53 | wt-p53 | p-value | mt-p53 | wt-p53 | p-value | |
| Circular (2908500/299420)c | 3.68 ± 0.38 | 1.09 ± 0.59 | 6.78 ± 0.82 | 6.45 ± 1.12 | 0.355 | 12.89 ± 0.88 | 12.51 ± 1.22 | 0.352 |
| Elliptical (2511400/125480)c | 4.04 ± 0.40 | 1.16 ± 0.63 | 3.22 ± 0.40 | 3.05 ± 0.54 | 0.349 | 5.49 ± 0.43 | 5.31 ± 0.58 | 0.354 |
| Irregular (2504200/217450)c | 3.75 ± 0.37 | 1.08 ± 0.58 | 5.81 ± 0.68 | 5.51 ± 0.93 | 0.349 | 11.06 ± 0.75 | 10.74 ± 1.01 | 0.351 |
| Exponential (1242100/99864)c | 3.55 ± 0.37 | 0.97 ± 0.52 | 5.51 ± 0.62 | 5.24 ± 0.84 | 0.348 | 14.83 ± 0.85 | 14.31 ± 0.98 | 0.287 |
| Linear (4594200/738690)c | 2.93 ± 0.31 | 0.91 ± 0.49 | 11.26 ± 1.27 | 10.73 ± 1.67 | 0.350 | 29.44 ± 1.39 | 28.84 ± 2.02 | 0.354 |
mt-p53: α = 0.17; β = 0.02.
wt-p53: α = 0.6; β = 0.06.
The numbers in parentheses are the total number of clonogens/the number of clonogens in the penumbra region before treatment for each MEP model.
SFs within the beam penumbra region compared to total SFs for tumours only expressing mt-p53 gene were then investigated applying various MEP models. The comparison of these two SF values served to evaluate the impact of local invasion in close proximity to the PTV on the total SF. The results are summarized in Table 2. As shown, the contribution of clonogenic cells lying directly beyond the beam area to the total SF is considerable. This indicates that if the CTV margin could be extended by 0.5 cm, this considerable contribution could be avoided.
The information regarding SFs associated with each p53 status in different regions is summarized in Table 2 for “clinical” MEP models. As expected, SFs within the beam region markedly decreased (i.e. 10−4 vs 10−16) for all MEP models when the GBM was composed homogeneously of clonogens expressing the wt-p53 gene.
Irrespective of the MEP model applied, no significant difference between tumours expressing different p53 gene statuses was observed with respect to both total and penumbra region SFs (Table 2). In addition, while the wt-p53-expressing tumour is more radiosensitive than the mt-p53-expressing tumour (Table 2), the total SFs associated with these tumour types are not significantly different for all of the clonogenic infiltration distributions considered in this work. These predictions imply that the total SFs are affected mostly by the presence of clonogens in the penumbra region and beyond and to a lesser extent by tumour cells radiosensitivity. Consequently, the cells surviving in the penumbra region are predicted to be the key reason for treatment failure. Therefore, a larger CTV margin could have a positive impact on tumour control. It should be noted that this simulation overestimates the number of surviving cells in the penumbra and the results presented in Table 2 for SF in penumbra region may exaggerate the real number of surviving cells. However, as this study is primarily a sensitivity study looking at ratios, i.e. looking at relative differences between gene statuses, two CTV margin extensions and/or MEP shapes, the conclusions are valid within the standard deviations of the results for both sharper and more realistic penumbras.
Quantification of survival fraction reduction following clinical target volume margin extension
A comparison of the cumulative SFs associated with 2.0-cm CTV margin (i.e. 5.0-cm PTV) and 2.5-cm CTV margin (i.e. 6.0-cm PTV) is shown in Figure 6. As suggested by these results (Table 3), the SFs were reduced by 72.4% ± 3.2%, 77.7% ± 3.8% and 73.3% ± 3.1% assuming circular, elliptical and irregular MEP distributions, respectively.
Figure 6.
Cumulative survival fractions (SFs) vs distance from the tumour centre using a 5.0-cm beam [i.e. 2.0-cm clinical target volume (CTV) margin] and 6.0-cm beam (i.e. 2.5-cm CTV margin) using three “clinical” microscopic extension probability models: circular, elliptical and irregular.
Table 3.
Improvement of survival fraction (SF) as a result of clinical target volume (CTV) extension by 5 mm using microscopic extension probability (MEP) models of type “clinical”
| SF improvement due to CTV extension | |||
|---|---|---|---|
| MEP model | SFa with 2 cm CTV (%) | SF with 2.5 cm CTV (%) | SF improvementb (%) |
| Circular | 12.9 ± 0.9 | 3.6 ± 0.2 | 72.4 ± 3.2 |
| Elliptical | 5.5 ± 0.4 | 1.2 ± 0.1 | 77.7 ± 3.8 |
| Irregular | 11.1 ± 0.7 | 3.0 ± 0.2 | 73.3 ± 3.1 |
SF = total number of surviving cells/initial number of tumour cells in one tumour slice.
.
DISCUSSION
Prognosis for GBM is poor. Survival rates associated with GBM indicate that the disease is not curable by current standard care which consists of post-operative external beam radiation therapy with/without adjuvant and concomitant chemotherapy. The treatment failure in external beam radiotherapy could be related to the fact that GBM cells are highly diffusive, introducing a high uncertainty in delineation of CTV in the course of radiotherapy planning. With reference to the CTV margin definition for GBM, published reports show limited agreement between studies and clinics. In this study, a cellular level MC code (i.e. absorbed dose in each cell) was developed to predict the treatment outcome for modelled GBM tumour and its ME.
The SFs within the beam region (i.e. ≥90% dose) markedly decreased, irrespective of the MEP model applied, when the p53 gene expression of the MEP model cells was switched from mt-p53 to wt-p53 (Table 2). However, it was shown that there was no significant difference in SF in the penumbra region and total SFs between tumours consisting of these two gene types (Table 2). In other words, the total SF, which is an indication of tumour control, does not significantly improve when the tumour and its infiltration is composed of more radiosensitive gene type cells. Therefore, it can be deduced that the presence of clonogens outside the target volume is the dominant effect and hence there is a high probability that treatment failure is related to inadequacy of CTV margins. For the remaining sensitivity analysis, the cells of MEP models were considered to express mt-p53 gene (i.e. radioresistant) to investigate the worst case scenario.
Along with total SFs, SFs within the penumbra region (i.e. 100 × surviving cells in the region extending 5.0 mm beyond 90% dose/total number of tumour cells before treatment) were also calculated to allow quantification of the contribution of local invasion, located in close proximity of irradiation margins, compared to the total SFs. The rationale for the comparison of total SF with SF in the penumbra region was to determine the amount of reduction in SF, had the CTV margin been slightly extended (i.e. by 0.5 cm). It was demonstrated, based on our simulation results, that the contribution of surviving cells in the penumbra region to the total SF was non-negligible and can contribute to recurrence (Table 2).
It is clearly evident that increasing the beam size will reduce the SF, and of course, simultaneously increase normal tissue toxicity. However, a quantification of the reduction of SF when the CTV is extended by 0.5 cm could be valuable guidance for clinicians on their decision regarding the extent of the CTV which should be optimized to maximize tumour control while normal tissue toxicity is minimized. In order to investigate the impact of the extent of the CTV margin, the beam size was increased by 0.5 cm in radius (i.e. resulting in 2.5-cm CTV margin), and cumulative SFs were calculated and plotted vs distance from the tumour centre. The comparison of cumulative SFs associated with 2.0- and 2.5-cm CTVs serves as a quantitative evaluation of tumour control improvement. Figure 6 illustrates this comparison for all three “clinical” MEP models. The results of this simulation suggest that approximately up to half an order of magnitude improvement could be achieved if the CTV is increased by 0.5 cm. It is worth noting that it is not proposed here to use a very large margin, as 2.5-cm CTV margin is well within the range of CTV margins currently applied (Table 1). If improvement in SF was minimal, clinicians may not decide to risk the normal tissue complication by irradiating a larger volume of the brain; however, if the improvement in SF is considerable (i.e. 72.37–77.73%), which is the case here, it could be beneficial to opt for larger CTV margins (close to higher range of CTVs). The major benefit of this tool is the ability to quantify potential gain in tumour cell kill when increasing margins.
It is understood that this study has utilized a simplified model of tumour and its ME. The authors acknowledge that cancer systems, particularly GBM, are complex and dynamic systems. An infiltrating neoplasm undergoes several stages during its progression, and transition between these stages is influenced by factors such as the microenvironmental changes (e.g. oxygen level), immune system response and cellular phenotype conversions. An important area of future development of the present work will be to incorporate hypoxia and genetic heterogeneity in cellular composition of the MEP model, to enable a more realistic representation of GBM and its infiltration. This is a major advantage of development of microscopic model rather than using macroscopic analytical function as biological information (e.g. genetic heterogeneity and hypoxia) can be readily implemented. In order to improve the accuracy of calculated absorbed dose in the penumbra, the incorporation of linac head components into the beam model will also be subject of future development of the current MC model.
CONCLUSION
A novel quantitative tool was developed to evaluate different CTV margin extensions for a range of MEP functions and cellular properties for GBM of the brain. The model is flexible and adaptable to apply different radiation sources and different radiobiological cell properties. SFs after photon beam radiotherapy have been estimated for various simulation set-ups including different cellular p53 gene status, CTV margin extensions and ME propagations (i.e. isotropic vs anisotropic). The simulation results suggest that while there is a large difference between cells expressing two p53 gene statues (i.e. mt-p53 and wt-p53) in terms of radiosensitivity (α, β values), the total SF is not sensitive to the gene status.
With respect to the extent of the CTV margin, the improvement in SF due to extension of the CTV has been quantified for all MEP models and showed a slight variation between different ME distributions. It has been demonstrated that the SF is greatly sensitive to the extent of the CTV margin and the reduction in total SF approximately ranges from 3.5 to 5.0 times when the CTV is extended by 0.5 cm. As a result, it can be concluded that a 5-mm CTV increase may be beneficial to extend time to recurrence (not tumour control) for patients with GBM.
The two main outcomes of this study include (a) development of a useful quantification tool for evaluation of SF depending on the tumour clonogenic and infiltration distributions (e.g. Figure 6); and (b) establishment of a cell-based simulation platform that allows for incorporation of individual cell parameters such as genetic heterogeneity and hypoxia (subject of the future work). Using this cellular structure, targeted therapies as well as boron neutron capture therapy will be also investigated in future studies.
APPENDIX A BEAM MODEL: DEVELOPMENT AND VERIFICATION
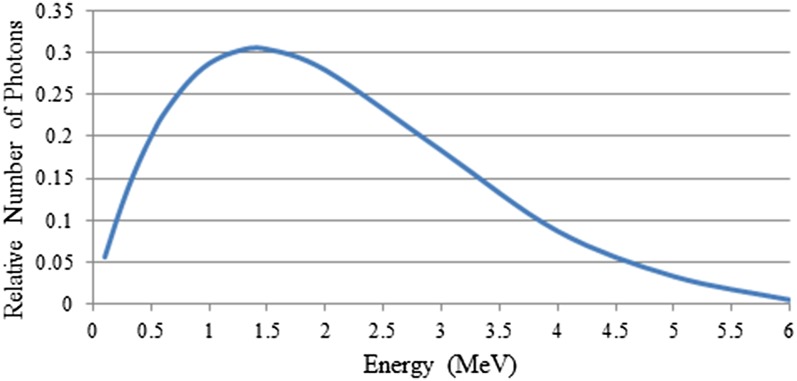
In order to develop a beam model, the general particle source (GPS) was used in Geant4 as the primary radiation particle generator, because the GPS has a large degree of flexibility to allow specification of more sophisticated sources, particularly beams with energy spectra, and randomized spatial and angular distributions, with relatively simple implementation. A circular cone 6 MV photon beam was simulated and fired into a water phantom (i.e. detector in Geant4 terminology). The beam energy spectrum, coming directly from the linac head, was acquired from the Pinnacle3TM treatment planning system v. 9.0 (Philips Medical System, Milpitas, CA) for a 6 MV photon beam from a Varian iX linear accelerator (Varian® Medical System, Palo Alto, CA) for a 100-cm source-to-surface distance set-up. This energy distribution was implemented in the form of an energy histogram using linear interpolation, see Figure A1. Cartesian coordinates were used with z as the beam direction, and x and y as the lateral directions. The linac head components were not simulated in the present work.
Figure A1.
Energy spectrum of 6-MV photon beam from the Pinnacle3TM treatment planning system v. 9.0 (Philips Medical System, Milpitas, CA) for a 6-MV photon beam from a Varian iX linear accelerator (Varian® Medical System, Palo Alto, CA).
At this stage of the simulation, the detector was defined to represent the reference conditions set-up, as defined by TRS-398 (International Atomic Energy Agency. Absorbed dose determination in external beam radiotherapy: an international code of practice for dosimetry based on standards of absorbed dose to water. Vienna, Austria: IAEA; 2001) for percentage depth dose (PDD) measurements in a 20 ×20 × 20 cm3 water phantom to enable beam model verification. The scoring of the total absorbed dose was performed in the central x–z plane of the water phantom using 1 mm3 voxels.
The low-energy electromagnetic, Penelope Physics list, was used for cross-section libraries. The production threshold for secondary particles is a known concept in Monte Carlo programming. Due to CPU computation time limitations, particles cannot be tracked down to zero energy through discrete energy loss because some processes have infrared divergence which increases CPU time enormously. In order to avoid this problem, a threshold is defined below which no secondary particles are produced (i.e. discrete energy loss stops when the energy of particle becomes smaller or equal to threshold) and then the particle is tracked down to zero using continuous energy loss formalism. The production threshold/cut-off value for the beam model was set to 0.1 mm (1/10 of voxel size) in this work.
Parallel simulation using Geant4 code v. 4.9.6.p01 on an 8-CPU Linux computer cluster was performed for a total of 4 × 10⁸ particles. As a result, the dose distribution at the central plane along the beam direction was obtained. In order to verify the validity of the beam model, the calculated results were compared with experimental PDD data for four different field sizes: 2, 5, 10, and 20 cm diameters.
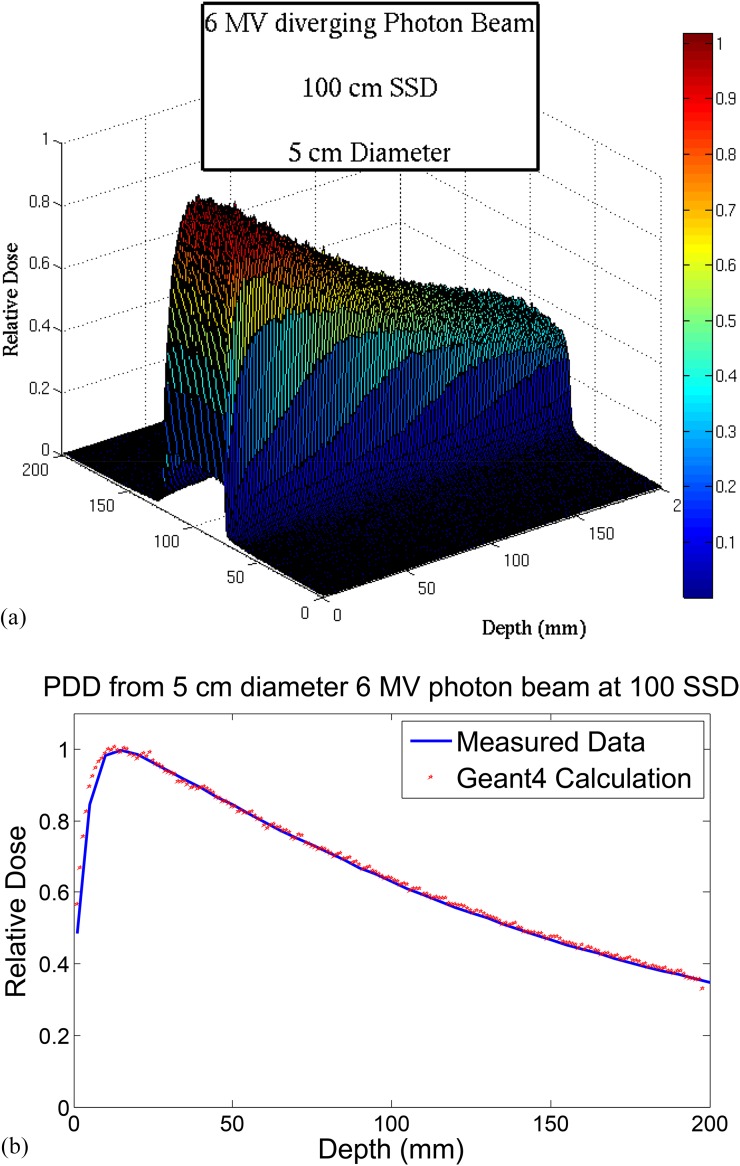
For beam model verification, the dose distribution was first calculated for a 5 cm diameter photon beam. The calculated PDDs by Geant4 agreed with measured PDDs with an average difference of 0.9 ± 0.4% (i.e. beyond build-up region), shown in Figure A2b. The underestimation of the calculated dose in the build-up region is due to the fact that the linac head components, which contribute to scatter dose in this region, have not been considered in this model. This study, however, is only concerned about the dose beyond build-up region and the inaccuracy in this region will not affect the results.
Figure A2.
(a) Calculated dose distribution at the midplane along the beam direction; (b) comparison between calculated and measured (i.e. using ion chamber) percentage depth dose (PDD) data for a 5-cm diameter field for a 6-MV beam.
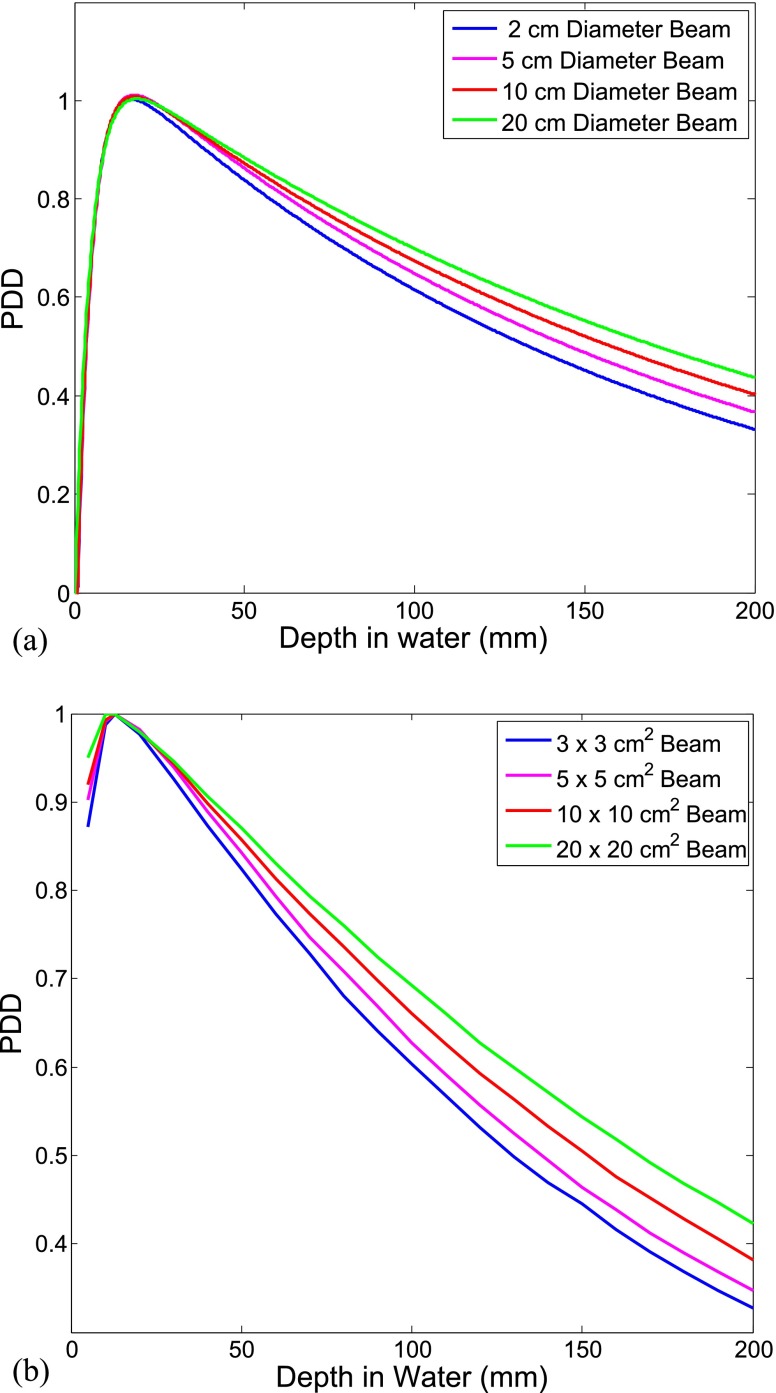
The simulation was repeated for different beam sizes to confirm the accuracy of the scattered dose calculation. Figure A3 illustrates the agreement between simulation results and experimental data in a qualitative comparison. As shown, for the same beam energy, the dose at a depth below the surface increases as the field size is enlarged. This is due to the fact that while the dose from primary radiation remains the same for the same beam energy, the lateral scatter radiation contributing to the dose in the central region of the beam increases as the beam size is increased.
Figure A3.
percentage depth dose (PDD) profiles of 6-MV diverging photon beam for different field sizes; (a) Geant4 simulation predictions; (b) measured data.
APPENDIX B GEANT4 CELLULAR-SCALE DOSIMETRY OUTPUT
The output of the simulation was the absorbed dose in each voxel (each cell), irrespective of whether the cell was a normal or tumour clonogenic cell. The calculated dose distribution, which was of order of approximately 10−4 Gy, was summed up to the clinically relevant dose (i.e. approximately 2 Gy) applying a random-propagation-based algorithm developed in this work. The algorithm divided the beam region into rectangles with infinitesimal lengths and widths which were calculated depending on the vertical distance of the rectangle from the beam centre. To take into account the stochastic behaviour of radiation interactions and ionization events leading to damage, within each infinitesimal region, the dose array was randomly rearranged in a 104 iteration loop and resulting matrices were summed up to form a scaled dose array for the corresponding area. The total dose matrix was obtained by integrating over all infinitesimal areas. Figure A4a,b shows the calculated absorbed dose matrix and the beam axial profile, respectively. As it can be seen in the Figure A4b,c,d the calculated penumbra in this simulation is sharper than what expected from a typical 6 MV photon beam as the linac treatment head has not been fully modelled. Figure A4e shows the cumulative DVH of the CTV region.
Figure A4.
Geant4-calculated dose matrix representation; (a) two dimensional dose profile on the X–Y plane perpendicular to the beam axis, the colour bar represents the deposited dose in Gy, (b) axial beam profile associated with 2.5-cm radius beam [i.e. gross tumour volume (GTV) = 0.1 cm, clinical target volume (CTV) = 2.1 cm, planning target volume (PTV) = 2.5 cm radii], (c) cumulative dose cell histogram in the penumbra region, (d) differential dose cell histogram in the penumbra region (the mean value is overlapped on the graph for illustration), (e) dose–volume histogram (DVH) for CTV region.
Contributor Information
L Moghaddasi, Email: leyla.moghaddasi@health.sa.gov.au.
E Bezak, Email: eva.bezak@health.sa.gov.au.
W Harriss-Phillips, Email: Wendy.Harriss@health.sa.gov.au.
REFERENCES
- 1.Stupp R, Hegi ME, Mason WP, van den Bent MJ, Taphoorn MJ, Janzer RC, et al. Effects of radiotherapy with concomitant and adjuvant temozolomide versus radiotherapy alone on survival in glioblastoma in a randomised phase III study: 5-year analysis of the EORTC-NCIC trial. Lancet Oncol 2009; 10: 459–66. doi: 10.1016/S1470-2045(09)70025-7 [DOI] [PubMed] [Google Scholar]
- 2.International Commission of Radiation Units and Measurements. Prescribing, recording and reporting photon beam therapy, (supplement to ICRU report 50), ICRU report 62. Bethesda, MD: ICRU; 1999. [Google Scholar]
- 3.Moghaddasi L, Bezak E, Marcu LG. Current challenges in clinical target volume definition: tumour margins and microscopic extensions. Acta Oncol 2012; 51: 984–95. doi: 10.3109/0284186X.2012.720381 [DOI] [PubMed] [Google Scholar]
- 4.Burger PC, Heinz ER, Shibata T, Kleihues P. Topographic anatomy and CT correlations in the untreated glioblastoma multiforme. J Neurosurg 1988; 68: 698–704. doi: 10.3171/jns.1988.68.5.0698 [DOI] [PubMed] [Google Scholar]
- 5.Halperin EC, Bentel G, Heinz ER, Burger PC. Radiation therapy treatment planning in supratentorial glioblastoma multiforme: an analysis based on post mortem topographic anatomy with CT correlations. Int J Radiat Oncol Biol Phys 1989; 17: 1347–50. doi: 10.1016/0360-3016(89)90548-8 [DOI] [PubMed] [Google Scholar]
- 6.Wallner KE, Galicich JH, Krol G, Arbit E, Malkin MG. Patterns of failure following treatment for glioblastoma multiforme and anaplastic astrocytoma. Int J Radiat Oncol Biol Phys 1989; 16: 1405–9. doi: 10.1016/0360-3016(89)90941-3 [DOI] [PubMed] [Google Scholar]
- 7.Gaspar LE, Fisher BJ, Macdonald DR, LeBer DV, Halperin EC, Schold SC, Jr, et al. Supratentorial malignant glioma: patterns of recurrence and implications for external beam local treatment. Int J Radiat Oncol Biol Phys 1992; 24: 55–7. doi: 10.1016/0360-3016(92)91021-E [DOI] [PubMed] [Google Scholar]
- 8.Hess CF, Schaaf JC, Kortmann RD, Schabet M, Bamberg M. Malignant glioma: patterns of failure following individually tailored limited volume irradiation. Radiother Oncol 1994; 30: 146–9. doi: 10.1016/0167-8140(94)90044-2 [DOI] [PubMed] [Google Scholar]
- 9.Jansen EP, Dewit LG, van Herk M, Bartelink H. Target volumes in radiotherapy for high-grade malignant glioma of the brain. Radiother Oncol 2000; 56: 151–6. doi: 10.1016/S0167-8140(00)00216-4 [DOI] [PubMed] [Google Scholar]
- 10.Aydin H, Sillenberg I, von Lieven H. Patterns of failure following CT-based 3-D irradiation for malignant glioma. Strahlenther Onkol 2001; 177: 424–31. [DOI] [PubMed] [Google Scholar]
- 11.Chang EL, Akyurek S, Avalos T, Rebueno N, Spicer C, Garcia J, et al. Evaluation of peritumoral edema in the delineation of radiotherapy clinical target volumes for glioblastoma. Int J Radiat Oncol Biol Phys 2007; 68: 144–50. doi: 10.1016/j.ijrobp.2006.12.009 [DOI] [PubMed] [Google Scholar]
- 12.Lee IH, Piert M, Gomez-Hassan D, Junck L, Rogers L, Hayman J, et al. Association of 11C-methionine PET uptake with site of failure after concurrent temozolomide and radiation for primary glioblastoma multiforme. Int J Radiat Oncol Biol Phys 2009; 73: 479–85. doi: 10.1016/j.ijrobp.2008.04.050 [DOI] [PMC free article] [PubMed] [Google Scholar]
- 13.Matsuo M, Miwa K, Tanaka O, Shinoda J, Nishibori H, Tsuge Y, et al. Impact of [11C]methionine positron emission tomography for target definition of glioblastoma multiforme in radiation therapy planning. Int J Radiat Oncol Biol Phys 2012; 82: 83–9. doi: 10.1016/j.ijrobp.2010.09.020 [DOI] [PubMed] [Google Scholar]
- 14.Minniti G, Amelio D, Amichetti M, Salvati M, Muni R, Bozzao A, et al. Patterns of failure and comparison of different target volume delineations in patients with glioblastoma treated with conformal radiotherapy plus concomitant and adjuvant temozolomide. Radiother Oncol 2010; 97: 377–81. doi: 10.1016/j.radonc.2010.08.020 [DOI] [PubMed] [Google Scholar]
- 15.Bondiau PY, Konukoglu E, Clatz O, Delingette H, Frenay M, Paquis P. Biocomputing: numerical simulation of glioblastoma growth and comparison with conventional irradiation margins. Phys Med 2011; 27: 103–8. doi: 10.1016/j.ejmp.2010.05.002 [DOI] [PubMed] [Google Scholar]
- 16.McDonald MW, Shu HK, Curran WJ, Jr, Crocker IR. Pattern of failure after limited margin radiotherapy and temozolomide for glioblastoma. Int J Radiat Oncol Biol Phys 2011; 79: 130–6. doi: 10.1016/j.ijrobp.2009.10.048 [DOI] [PubMed] [Google Scholar]
- 17.Trepanier PY, Fortin I, Lambert C, Lacroix F. A Monte Carlo based formalism to identify potential locations at high risk of tumour recurrence with a numerical model for glioblastoma multiforme. Med Phys 2012; 39: 6682–91. doi: 10.1118/1.4757972 [DOI] [PubMed] [Google Scholar]
- 18.Lee SW, Fraass BA, Marsh LH, Herbort K, Gebarski SS, Martel MK, et al. Patterns of failure following high-dose 3-D conformal radiotherapy for high-grade astrocytomas: a quantitative dosimetric study. Int J Radiat Oncol Biol Phys 1999; 43: 79–88. doi: 10.1016/S0360-3016(98)00266-1 [DOI] [PubMed] [Google Scholar]
- 19.Unkelbach J, Menze BH, Konukoglu E, Dittmann F, Le M, Ayache N, et al. Radiotherapy planning for glioblastoma based on a tumour growth model: improving target volume delineation. Phys Med Biol 2014; 59: 747–70. doi: 10.1088/0031-9155/59/3/747 [DOI] [PubMed] [Google Scholar]
- 20.Taghian A, Suit H, Pardo F, Gioioso D, Tomkinson K, DuBois W, et al. In vitro intrinsic radiation sensitivity of glioblastoma multiforme. Int J Radiat Oncol Biol Phys 1992; 23: 55–62. doi: 10.1016/0360-3016(92)90543-Q [DOI] [PubMed] [Google Scholar]
- 21.Moghaddasi FL, Bezak E, Marcu L. In silico modelling of tumour margin diffusion and infiltration: review of current status. Comput Math Methods Med 2012; 2012: 672895. doi: 10.1155/2012/672895 [DOI] [PMC free article] [PubMed] [Google Scholar]
- 22.Antipas VP, Stamatakos GS, Uzunoglu NK, Dionysiou DD, Dale RG. A spatio-temporal simulation model of the response of solid tumours to radiotherapy in vivo: parametric validation concerning oxygen enhancement ratio and cell cycle duration. Phys Med Biol 2004; 49: 1485–504. doi: 10.1088/0031-9155/49/8/008 [DOI] [PubMed] [Google Scholar]
- 23.Nafe R, Franz K, Schlote W, Schneider B. Morphology of tumour cell nuclei is significantly related with survival time of patients with glioblastomas. Clin Cancer Res 2005; 11: 2141–8. doi: 10.1158/1078-0432.CCR-04-1198 [DOI] [PubMed] [Google Scholar]
- 24.Eikenberry SE, Sankar T, Preul MC, Kostelich EJ, Thalhauser CJ, Kuang Y. Virtual glioblastoma: growth, migration and treatment in a three-dimensional mathematical model. Cell Prolif 2009; 42: 511–28. doi: 10.1111/j.1365-2184.2009.00613.x [DOI] [PMC free article] [PubMed] [Google Scholar]
- 25.Chao KS, Blanco AI, Dempsey JF. A conceptual model integrating spatial information to assess target volume coverage for IMRT treatment planning. Int J Radiat Oncol Biol Phys 2003; 56: 1438–49. doi: 10.1016/S0360-3016(03)00429-2 [DOI] [PubMed] [Google Scholar]
- 26.Krishnan AP, Asher IM, Davis D, Okunieff P, O'Dell WG. Evidence that MR diffusion tensor imaging (tractography) predicts the natural history of regional progression in patients irradiated conformally for primary brain tumours. Int J Radiat Oncol Biol Phys 2008; 71: 1553–62. doi: 10.1016/j.ijrobp.2008.04.017 [DOI] [PubMed] [Google Scholar]
- 27.Haas-Kogan DA, Yount G, Haas M, Levi D, Kogan SS, Hu L, et al. p53-dependent G1 arrest and p53-independent apoptosis influence the radiobiologic response of glioblastoma. Int J Radiat Oncol Biol Phys 1996; 36: 95–103. doi: 10.1016/S0360-3016(96)00244-1 [DOI] [PubMed] [Google Scholar]
- 28.Stamatakos GS, Antipas VP, Uzunoglu NK, Dale RG. A four-dimensional computer simulation model of the in vivo response to radiotherapy of glioblastoma multiforme: studies on the effect of clonogenic cell density. Br J Radiol 2006; 79: 389–400. doi: 10.1259/bjr/30604050 [DOI] [PubMed] [Google Scholar]


