Significance
Genetic mutations of protein tyrosine phosphatase nonreceptor type 11 Ptpn11 (Shp2) are associated with childhood leukemias and solid tumors. The mechanisms by which Ptpn11 mutations induce malignancies are not fully understood. In this study, we demonstrate that Ptpn11 disease mutations disturb mitosis and cytokinesis, causing chromosomal instability and greatly increased susceptibility to DNA damage-induced malignancies. This finding reveals a novel mechanism by which deregulation of Shp2 induces malignancies and has important clinical implications. Given that Ptpn11 mutations enhance DNA damage-induced tumorigenesis, caution should be taken when considering DNA-damaging preconditioning for stem cell transplantation therapy or DNA-damaging chemotherapy for Ptpn11-associated malignancies, especially in Noonan syndrome patients with germ-line Ptpn11 mutations, as the risk of therapy-induced malignancies in these patients may be increased.
Keywords: Ptpn11, Shp2, protein tyrosine phosphatase, mitosis, chromosomal instability
Abstract
Gain-of-function (GOF) mutations of protein tyrosine phosphatase nonreceptor type 11 Ptpn11 (Shp2), a protein tyrosine phosphatase implicated in multiple cell signaling pathways, are associated with childhood leukemias and solid tumors. The underlying mechanisms are not fully understood. Here, we report that Ptpn11 GOF mutations disturb mitosis and cytokinesis, causing chromosomal instability and greatly increased susceptibility to DNA damage-induced malignancies. We find that Shp2 is distributed to the kinetochore, centrosome, spindle midzone, and midbody, all of which are known to play critical roles in chromosome segregation and cytokinesis. Mouse embryonic fibroblasts with Ptpn11 GOF mutations show a compromised mitotic checkpoint. Centrosome amplification and aberrant mitosis with misaligned or lagging chromosomes are significantly increased in Ptpn11-mutated mouse and patient cells. Abnormal cytokinesis is also markedly increased in these cells. Further mechanistic analyses reveal that GOF mutant Shp2 hyperactivates the Polo-like kinase 1 (Plk1) kinase by enhancing c-Src kinase-mediated tyrosine phosphorylation of Plk1. This study provides novel insights into the tumorigenesis associated with Ptpn11 GOF mutations and cautions that DNA-damaging treatments in Noonan syndrome patients with germ-line Ptpn11 GOF mutations could increase the risk of therapy-induced malignancies.
Src homology 2 domain-containing protein tyrosine phosphatase 2 (Shp2), a ubiquitously expressed protein tyrosine phosphatase (PTP), plays multiple roles in cellular processes. This phosphatase is best known to be involved in growth factors, cytokines, and other extracellular protein-induced signal transduction (1, 2). It is normally self-inhibited by hydrogen bonding of the backside of the N-terminal SH2 (N-SH2) domain to the deep pocket of the PTP domain. Ligands with phosphorylated tyrosine (pY) residues activate Shp2 by binding the SH2 domains (primarily N-SH2) and disrupting the inhibitory interaction between N-SH2 and PTP domains. Shp2 is involved in multiple cell signaling pathways and plays an overall positive role in transducing signals initiated from receptor and cytosolic kinases (1, 2). The underlying mechanisms are not completely understood. Shp2 interacts with a number of cell signaling intermediates. Of these signaling partners, some are the targets of its enzymatic activity. However, Shp2 can also function as an adaptor protein independent of its catalytic activity (3, 4). In addition to growth factor/cytokine-induced signaling, Shp2 regulates genotoxic stress-triggered signaling and cellular responses (5, 6). More recently, Shp2 has been found to be required for optimal activation of Polo-like kinase 1 (Plk1) and maintenance of chromosomal stability, although the detailed signaling mechanisms remain unclear (7).
The critical role of Shp2 in cell signaling and other activities is further underscored by its direct association with human diseases. Germ-line or somatic heterozygous mutations in Ptpn11 (encoding Shp2) have been identified in the developmental disorder Noonan syndrome (8), juvenile myelomonocytic leukemia (JMML) (9, 10), acute leukemias (11, 12), and sporadic solid tumors (13). These mutations cause amino acid changes at the interphase formed between N-SH2 and PTP domains, disrupting the inhibitory intramolecular interaction and leading to hyperactivation of Shp2 catalytic activity (8, 9). In addition, disease-associated Ptpn11 mutations enhance the binding of mutant Shp2 to signaling partners (14–16). Recent studies have demonstrated that these gain-of-function (GOF) mutations of Ptpn11 are sufficient to drive the development of Noonan syndrome and leukemias in mice (15, 17, 18). Nevertheless, as the biochemical basis for the role that Shp2 plays in cell signaling is not well understood, the mechanisms of the tumorigenesis induced by Ptpn11 GOF mutations remain poorly defined.
Results
Ptpn11D61G Mutation Induces Chromosomal Instability and Increases Susceptibility to DNA Damage-Induced Malignancies.
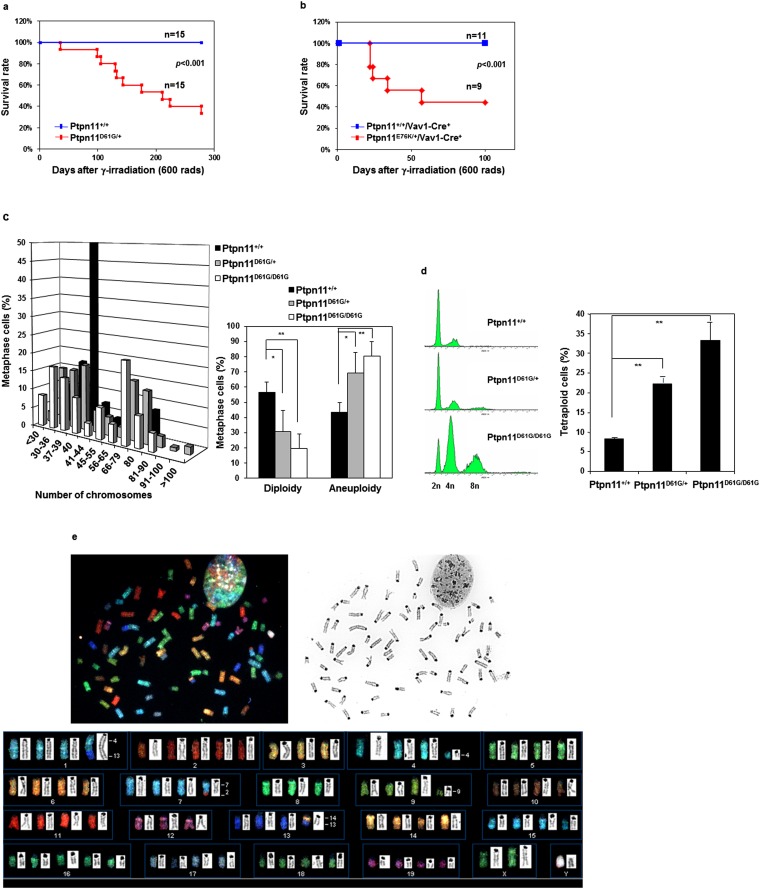
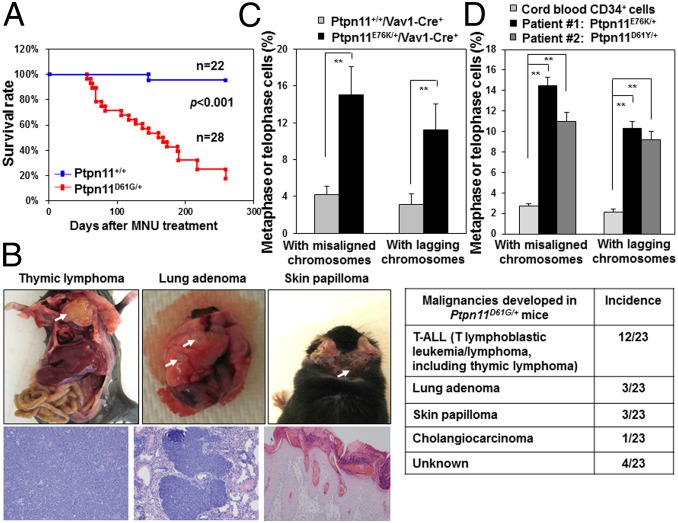
During the course of bone marrow transplantation experiments for global Ptpn11 GOF mutation D61G knock-in (Ptpn11D61G/+) mice, which develop myeloproliferative disorder (15, 19), we noticed that these animals were susceptible to tumorigenesis following whole-body γ-irradiation (11 Gy) that was used for preconditioning. To further assess responses of Ptpn11D61G/+ mice to irradiation, we irradiated the mice at a lower dose (6 Gy). During 9 mo of follow-up, 10 of 15 irradiated Ptpn11D61G/+ mice developed hematological malignancies, mainly T lymphoblastic leukemia/lymphoma, whereas none of the wild-type (WT, Ptpn11+/+) animals did (Fig. S1A). Similarly, 23 of 28 Ptpn11D61G/+ mice treated with a DNA-damaging agent Methylnitrosourea (MNU) died within 8 mo (Fig. 1A), whereas only 1 of 22 WT mice died of thymic lymphoma. In addition to leukemia/lymphoma, lung adenomas and skin papillomas were found in MNU-treated Ptpn11D61G/+ mice (Fig. 1B). Consistent with these results, conditional knock-in mice bearing another Ptpn11 GOF mutation (E76K) (18), which is stronger than the D61G mutation in activating the catalytic activity of Shp2 (9, 20), showed much accelerated evolution into acute leukemias in response to 6 Gy irradiation (Fig. S1B), suggesting that the effects of Shp2 mutants on sensitizing DNA damage-induced malignancies correlate with their enhanced catalytic activities.
Fig. S1.
Ptpn11 GOF mutations increase susceptibility to DNA damage-induced malignancy. (A) Eight to 10-wk-old Ptpn11D61G/+ mice and Ptpn11+/+ littermates were irradiated (6 Gy) (n = 15 for each group). The mice were monitored for 9 mo. Animal survival rates were determined. (B) Hematopoietic cell-specific knock-in mice Ptpn11E76K/+/Vav1-Cre+ mice (n = 9) and Ptpn11+/+/Vav1-Cre+ (n = 11) littermates at 4–5 mo old were irradiated (6 Gy). The mice were monitored for 3.5 mo for acute leukemia progression. Animal survival rates were determined. (C) Karyotypes of Ptpn11+/+, Ptpn11D61G/+, and Ptpn11D61G/D61G MEFs at passage 5 were analyzed. At least 100 metaphase cells were examined for each cell type. Cells with either more or fewer than 40 chromosomes were scored as aneuploid cells. (D) Cell cycle profiles of Ptpn11+/+, Ptpn11D61G/+, and Ptpn11D61G/D61G MEFs at passage 18–20 were determined by PI staining and FACS analyses. Polyploid cells with 8n DNA content (tetraploid) were quantified. These experiments were performed using MEFs generated from three different batches of embryos. The data shown represent the mean ± SD of three independent experiments. (E) Ptpn11D61G/D61G MEFs shown in D were examined by SKY analyses. Twelve metaphase spreads were examined for each sample. A representative result is shown.
Fig. 1.
Ptpn11 GOF mutations induce chromosomal instability and increase susceptibility to DNA damage-induced malignancy. Eight to 10-wk-old Ptpn11D61G/+ mice and Ptpn11+/+ littermates were treated with a single dose of MNU (50 mg/kg body weight) by i.p. injection. (A) Kaplan–Meier survival curves of the mice were determined. (B) Incidence of tumors in MNU-treated Ptpn11D61G/+ mice and representative photographs/histopathological images of the indicated tumors. (C) Bone marrow cells isolated from Ptpn11E76K/+/Vav1-Cre+ mice and Ptpn11+/+/Vav1-Cre+ littermates were immunostained with anti–β-tubulin antibody and counterstained with DAPI. Metaphase cells with chromosomal misalignment or anaphase/telophase cells with lagging chromosomes were counted. More than 80 mitotic cells for each cell type were examined. (D) Leukemic cells from two JMML patients with the indicated PTPN11 GOF mutations and cord blood CD34+ cells were examined as above. More than 70 mitotic cells for each sample were examined.
Tumorigenesis is highly associated with genomic instability. Genomic instability predisposes cells to malignant transformation and sensitizes the cells to DNA damage-induced malignancies (21, 22). To determine whether the Ptpn11D61G mutation might enhance tumorigenesis through disturbing genomic stability, we generated primary mouse embryonic fibroblasts (MEFs) from Ptpn11D61G knock-in mice and monitored their chromosomal stability. Ptpn11D61G/D61G and Ptpn11D61G/+ cells displayed significantly increased chromosomal instability as opposed to WT cells. Aneuploidy, a state of having abnormal numbers of chromosomes, in Ptpn11D61G/D61G and Ptpn11D61G/+ cells was readily detected at passage 3. At passage 5, the majority of these cells were aneuploid, whereas 50% of WT cells were still diploid (Fig. S1C). At passage 18, the percentage of tetraploid cells with 8n DNA content was increased substantially in Ptpn11D61G/D61G and Ptpn11D61G/+ populations (Fig. S1D), and this effect of the Ptpn11D61G/ mutation is clearly gene dosage-dependent. Spectral karyotyping (SKY) analyses validated that Ptpn11D61G/D61G cells contained prominent numerical (gain or loss of chromosomes) and structural aberrations (chromosome deletions and translocations) in chromosomes (Fig. S1E).
Ptpn11 GOF Mutations Result in a Defective Mitotic Checkpoint and Aberrant Mitosis/Cytokinesis.
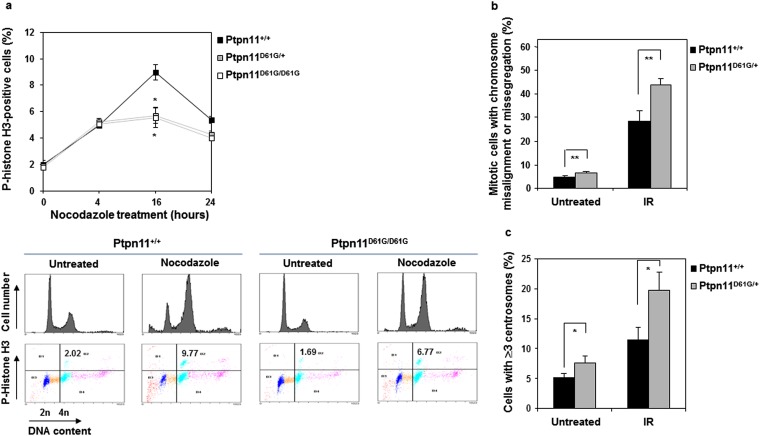
Various cellular surveillance mechanisms function to maintain the integrity of the genome. The mitotic checkpoint, also known as the spindle assembly checkpoint, is a cellular surveillance mechanism that functions to ensure faithful chromosome segregation during mitosis (23, 24). Loss of this highly conserved checkpoint function results in premature mitosis and missegregation of chromosomes, leading to aneuploidy and proneness to cancer. Ptpn11D61G/D61G and Ptpn11D61G/+ cells exhibited aneuploidy; we therefore wondered whether the mitotic checkpoint in these cells was defective. To address this question, Ptpn11D61G/D61G, Ptpn11D61G/+, and Ptpn11+/+ MEFs (at passage 3–5) were treated with nocodazole, a microtubule depolymerizing agent that triggers activation of the mitotic checkpoint and arrests cells at mitosis—in particular, prometaphase. Mitotic checkpoint function was then determined by assessing the percentage of mitotic cells identified by p-histone H3 immunostaining. As shown in Fig. S2A, 16 h following nocodazole treatment, the percentage of Ptpn11D61G/D61G and Ptpn11D61G/+ cells arrested at mitosis was decreased compared with that of Ptpn11+/+ cells. These data demonstrate that the Ptpn11D61G mutation compromises mitotic checkpoint function.
Fig. S2.
Compromised mitotic checkpoint, aberrant mitosis, and centrosome amplification in Ptpn11D61G mutant primary MEFs. (A) Ptpn11+/+, Ptpn11D61G/+, and Ptpn11D61G/D61G MEFs at passage 3–5 were treated with nocodazole (400 ng/mL) for the indicated times. Cells were collected and the percentage of mitotic cells was determined by PI and p-histone H3 double staining followed by flow cytometric analyses. Representative flow cytometric profiles of cells treated with nocodazole for 16 h are shown in the lower panel. (B) Ptpn11+/+ and Ptpn11D61G/+ MEFs at passage 3–5 were irradiated (10 Gy). Twenty-four hours later, cells were stained with anti–p-histone H3 and anti–β-tubulin antibodies and DAPI. The mitotic cells with aberrant morphology (chromosomal misalignment at metaphase and chromosome missegregation at anaphase/telophase) were counted. More than 100 cells for each cell type were examined. The data shown represent the mean ± SD of the three experiments. (C) Ptpn11+/+ and Ptpn11D61G/+ MEFs at passage 3–5 were irradiated (10 Gy). Twenty-four hours later, cells were immunostained with anti–γ-tubulin antibody, and cells with ≥3 centrosomes were scored. More than 1,000 cells for each cell type were examined. The experiments shown in all panels were performed using three different batches of cell pools. The data shown represent the mean ± SD of three cell pools.
To further determine the detrimental effects of the Ptpn11D61G mutation on mitosis, we surveyed the morphology of unperturbed mitotic cells (without nocodazole treatment) by p-histone H3 and 4′,6-diamidino-2-phenylindole (DAPI) double staining. The frequency of abnormal mitotic cells with aberrant chromatid morphology (chromosome misalignment at metaphase and chromosome missegregation at anaphase/telophase) was increased in Ptpn11D61G/+ primary cells, and this difference between WT and Ptpn11 mutant cells was exacerbated following γ-irradiation (Fig. S2B). Furthermore, centrosome amplification was observed in Ptpn11D61G/+ cells. The percentage of the cells with ≥3 centrosomes, as identified by γ-tubulin immunostaining, was increased in untreated and irradiated Ptpn11D61G/+ cells (Fig. S2C). Consistent with these results, mitotic arrest induced by nocodazole was also decreased in Ptpn11E76K/+ MEFs (Fig. S3A). Moreover, the frequency of abnormal mitotic cells with chromosome misalignment at metaphase or lagging chromosomes at anaphase/telophase in Ptpn11E76K/+ bone marrow cells (Fig. 1C) or MEFs (Fig. S3B) and in JMML patient leukemic cells with Ptpn11 GOF mutations (Fig. 1D) was greatly increased. Similar to Ptpn11D61G/+ cells, centrosome amplification in Ptpn11E76K/+ MEFs was also much more frequent than that in control cells (Fig. S3C).
Fig. S3.
Defective mitotic checkpoint and aberrant mitosis in Ptptn11E76K/+ primary MEFs. (A) Ptpn11E76K/+ and Ptpn11+/+ MEFs at passage 3–5 were treated with nocodazole (400 ng/mL) or DMSO for 16 h. The mitotic index was determined as described in Fig. S2A. The data shown represent the mean ± SD of three experiments with three different batches of cell pools. (B) Ptpn11E76K/+ and Ptpn11+/+ MEFs at passage 3–5 were stained with anti–p-histone H3 and anti–β-tubulin antibodies, and DAPI. Metaphase cells with chromosomal misalignment and telophase cells with lagging chromosomes were quantified. These experiments were performed with three different batches of cell pools, and more than 100 cells for each cell type were examined in each experiment. The data shown represent the mean ± SD of the three experiments. (C) Ptpn11E76K/+ and Ptpn11+/+ MEFs at passage 3–5 were immunostained with anti–γ-tubulin antibody, and cells with ≥3 centrosomes were scored. These experiments were performed using three different batches of cell pools, and more than 1,000 cells for each cell type were examined in each experiment. The data shown represent the mean ± SD of these experiments.
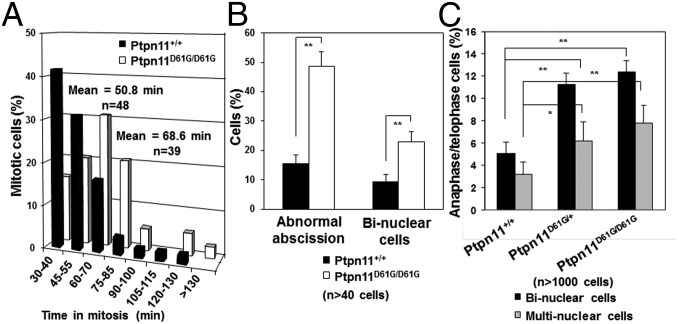
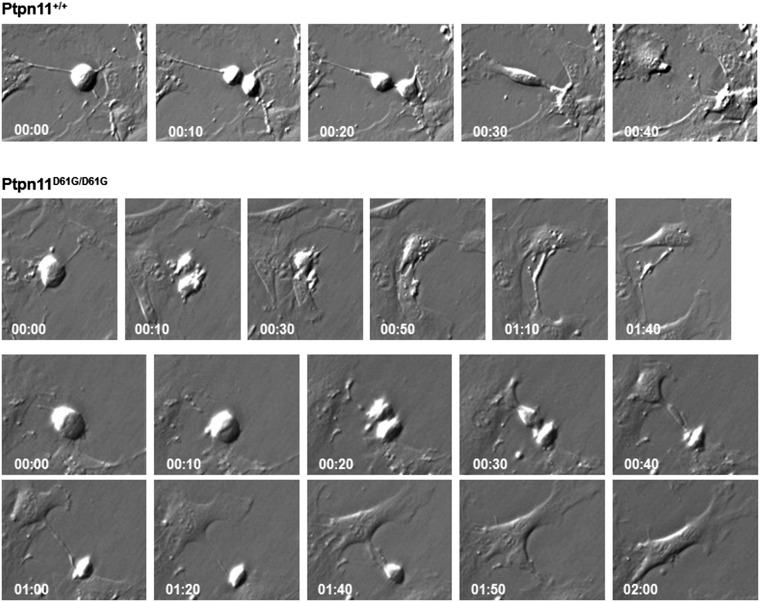
To directly visualize the impact of the Ptpn11D61G mutation on mitosis, cell division was monitored in living Ptpn11+/+ and Ptpn11D61G/D61G MEFs with a time-lapse video microscope. The duration of mitosis in Ptpn11D61G/D61G cells was prolonged (Fig. 2A and representative photomicrographs shown in Fig. S4) likely because mutant cells with chromosome misalignment needed a longer time to satisfy the mitotic checkpoint and because of amplification of centrosomes (25). Ptpn11-mutated cells still entered into anaphase with misaligned chromosomes due to the mitotic checkpoint defect, leading to increased chromosome missegregation. In addition, cytokinesis, the last stage of mitosis, was abnormal in Ptpn11D61G/D61G cells (Fig. S4). The percentage of dividing Ptpn11D61G/D61G cells with abnormal abscission was markedly increased (Fig. 2B). Some Ptpn11D61G/D61G cells could not be successfully separated, and a long bridge between two nascent daughter cells was frequently observed (Fig. S4, Upper panel of the Ptpn11D61G/D61G group), resulting in binucleate cells (Fig. S4, Lower panel of the Ptpn11D61G/D61G group). The percentage of binucleate cells in Ptpn11D61G/D61G MEFs was much higher than that in Ptpn11+/+ cells (Fig. 2B). To further confirm these results, we collected nocodazole-arrested mitotic cells and then released them to fresh regular culture medium. After 80 min, most of the Ptpn11+/+ cells reached cytokinesis and completely separated to two daughter cells, and only less than 10% of cells failed to complete this process. However, the percentage of Ptpn11D61G/D61G cells with binuclear or multinuclear cells resulting from failed cytokinesis was doubled (Fig. 2C), providing further evidence for the detrimental effect of the Ptpn11D61G mutation on cytokinesis.
Fig. 2.
Aberrant mitosis/cytokinesis in mutant cells bearing Ptpn11 GOF mutations. Mitosis and cell division in living Ptpn11+/+ and Ptpn11D61G/D61G MEFs at passage 3–5 were monitored by time-lapse video microscopy. (A) Average times of mitosis (from nuclear membrane breakdown to completion of cell division) for Ptpn11+/+ and Ptpn11D61G/D61G MEFs. (B) The percentages of the cells with abnormal abscission and the percentages of the daughter cells with two nuclei due to failed cytokinesis were quantified. (C) Mitotic Ptpn11+/+ and Ptpn11D61G/D61G MEFs (passage 5) arrested by nocodazole were collected by shake-off and then released to regular culture medium. Eighty minutes later, cells were fixed and immunostained with anti–β-tubulin antibody and counterstained with DAPI. The percentages of the cells with binuclei or multinuclei in anaphase and telophase were quantified.
Fig. S4.
Aberrant mitosis/cytokinesis in mutant cells bearing Ptptn11D61G mutations. Mitosis and cell division in living Ptpn11+/+ and Ptpn11D61G/D61G MEFs at passage 3–5 were monitored by time-lapse video microscopy, as described in Materials and Methods. Representative cells with abnormal abscission (Upper panel of the Ptpn11D61G/D61G group) and two nuclei (Lower panel of the Ptpn11D61G/D61G group) are shown.
Shp2 Is Activated and Distributed to the Kinetochore, Centrosome, Spindle Midzone, and Midbody in Mitotic Cells.
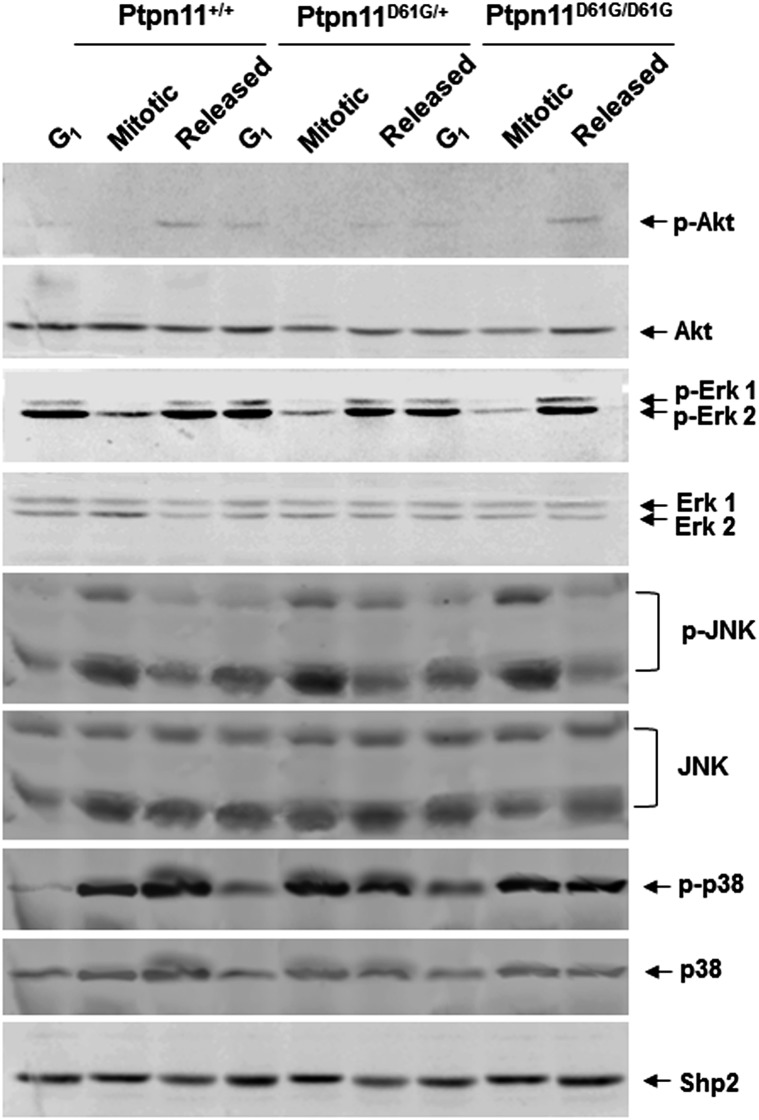
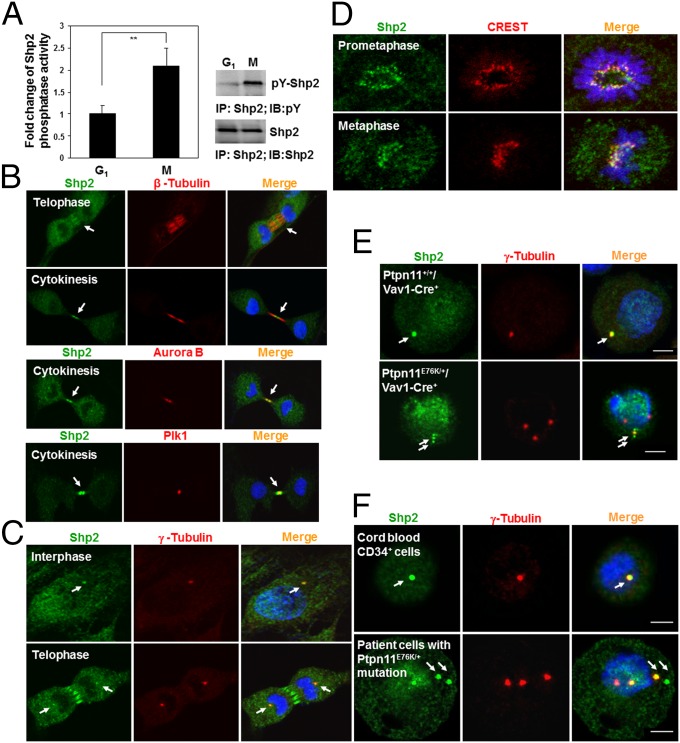
To elucidate the mechanisms by which the Ptpn11D61G mutation disturbs mitosis, we first examined cell signaling activities specifically in mitotic cells, as Shp2 is well established for its important role in cell signaling. Interestingly, no significant changes in Erk, Akt, JNK, and p38 kinase activities in mitotic or synchronized G1 Ptpn11D61G/D61G and Ptpn11D61G/+ MEFs were observed (Fig. S5), making it unlikely that aberrant mitosis and cytokinesis in Ptpn11D61G mutant cells are caused by changes in growth factor or stress signaling. We reasoned that GOF mutations of Shp2 might impact mitosis through other mechanisms. Compared with that in synchronized G1 cells, tyrosine phosphorylation of Shp2, indicative of its involvement in signaling activities, in “shake-off” mitotic cells was increased, and the catalytic activity of Shp2 was doubled (Fig. 3A), suggesting that Shp2 is more active when cells enter into mitosis. Next, we examined the subcellular distribution of Shp2, specifically in mitotic cells. Surprisingly, Shp2 was found to be distributed at the spindle midzone in telophase and concentrated at the midbody in cytokinesis, as evidenced by colocalization with β-tubulin at these mitotic apparatuses (Fig. 3B, Top panel). This dynamic localization pattern of Shp2 is remarkably similar to those of Aurora B and Plk1, two serine/threonine kinases that play critical roles in mitosis and cytokinesis (26, 27). Shp2 colocalized with Aurora B (Fig. 3B, Middle panel) and partially colocalized with Plk1 (Fig. 3B, Lower panel) at the midbody during cleavage and abscission of daughter cells. In addition, Shp2 colocalized with γ-tubulin (Fig. 3C), a centrosome-specific protein, indicating its localization at centrosomes. More importantly, Shp2 staining overlapped with CREST (Calcinosis, Raynaud phenomenon, Esophageal dysmotility, Sclerodactyly, and Telangiectasia) staining (Fig. 3D), which is restricted to the inner core of the kinetochore, the protein structure on centromeres where the spindle fibers attach, suggesting that Shp2 also is distributed to the kinetochore. Kinetochores, centrosomes, and midbodies play crucial roles in chromosomal segregation and subsequent cytokinesis (28, 29); the distribution of Shp2 to these structures implied that Shp2 might directly participate in the regulation of mitosis. In Ptpn11-mutated mouse bone marrow cells (Fig. 3E) and JMML patient leukemic cells (Fig. 3F), both of which showed greatly increased chromosome misalignment and missegregation in mitosis (Fig. 1 C and D), Shp2 was also detected in the centrosome. Interestingly, it was only detected in some but not all amplified centrosomes, supporting the hypothesis that centrosome amplification and genomic instability in these leukemic cells are associated at least in part with Ptpn11 GOF mutations in mitotic structures.
Fig. S5.
Proliferative cell signaling activities in Ptpn11D61G mutant mitotic cells are not significantly altered. Immortalized Ptpn11+/+, Ptpn11D61G/+, and Ptpn11D61G/D61G MEFs were synchronized at the G1 or M phase. In addition, mitotic cells were washed and replated in a dish with regular fresh medium for 80 min (released cells). G1, mitotic, and released cells were lysed. Cell lysates were examined by immunoblotting with anti–p-Erk, anti–p-Akt, anti–p-JNK, and anti–p-p38 antibodies. Blots were stripped and reprobed with anti–pan-Erk, anti–pan-Akt, anti–pan-JNK, and anti–pan-p38 antibodies. Experiments were repeated twice. Similar results were obtained in each.
Fig. 3.
Shp2 is activated and localized to the kinetochore, centrosome, spindle midzone, and midbody in mitotic cells. (A) Synchronized G1 and mitotic HeLa cells were lysed, and Shp2 catalytic activity in the lysates was assessed by the immunocomplex phosphatase assay. The cell lysates were also examined by immunoprecipitation and immunoblotting as indicated. (B–D) NIH 3T3 cells were immunostained with the indicated antibodies. Nuclei were counterstained with DAPI. (E) Bone marrow cells isolated from Ptpn11E76K/+/Vav1-Cre+ mice and Ptpn11+/+/Vav1-Cre+ littermates were immunostained with the indicated antibodies. (F) Leukemic cells from two JMML patients with the indicated PTPN11 mutations and cord blood CD34+ cells were immunostained as above.
GOF Mutant Shp2 Enhances Plk1 and Aurora B Activities in Mitosis.
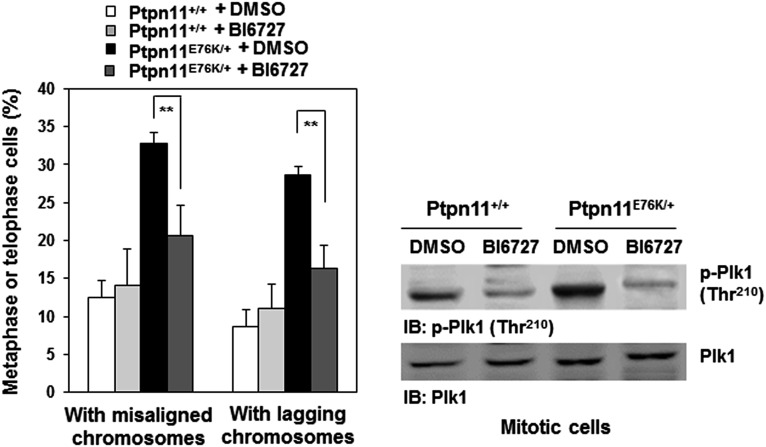
To further determine the mechanisms responsible for the pronounced effects of Ptpn11 (Shp2) GOF mutations on mitosis, we tested physical and functional interactions between Shp2 and Plk1, as our previous study demonstrated that WT Shp2 was required for optimal activation of Plk1 in mitosis (7). Shp2 and Plk1 were detected in the same immunocomplex in mitotic cells (Fig. 4A). More interestingly, D61G and E76K mutations enhanced the association between mutant Shp2 and Plk1 (Fig. 4A), likely due to the open conformation of mutant Shp2 caused by the mutations. Cotransfection of GFP-Plk1 and various Flag-tagged truncated Shp2 followed by Shp2/Plk1 interaction assays showed that full-length Shp2 (FL), Shp2 C (PTP and C-tail), and Shp2 W3 (N-SH2, C-SH2, and PTP), but not Shp2 N (N-SH2 and C-SH2), bound to GFP-Plk1, indicating that a motif in the PTP domain is required for the binding to Plk1 (Fig. S6A). Further in vitro binding assays verified that GST full-length Shp2 and Shp2 W3 but not Shp2 N pulled down Plk1 from the lysates of mitotic cells (Fig. S6B). We also transfected Flag-tagged Shp2 FL, Shp2 C, Shp2 W3, and Shp2 N into HeLa cells and examined their localization to the kinetochore. Shp2 N detected in the kinetochore was greatly decreased compared with Shp2 FL, Shp2 C, and Shp2 W3 (Fig. S6C), suggesting that the interaction of Shp2 with Plk1 is essential for Shp2 to localize to this mitotic apparatus. Notably, Plk1 kinase activity, determined by phosphorylation of Thr210 (p-Thr210), in Ptpn11D61G/D61G and Ptpn11E76K/+ mitotic cells was elevated (Fig. 4B). In addition, activity of Aurora B, determined by p-Thr232, was also significantly increased (Fig. 4C), although no physical interaction between Shp2 and Aurora B was detected. The increase in Aurora B activity might be caused by the enhanced activation of Plk1, owing to the intricate functional interplay between Plk1 and Aurora B kinases (26, 27). Furthermore, we treated Ptpn11E76K/+ mutant MEFs with the Plk1 inhibitor BI6727 at a low concentration (5 nM) and assessed its effect on reversing chromosomal instability. Indeed, BI6727 significantly reduced the percentages of metaphase cells with chromosome misalignment and anaphase/telophase cells with lagging chromosomes in these cells (Fig. S7), verifying that aberrant activation of Plk1 is responsible for the chromosomal instability induced by the Ptpn11E76K/+ mutation.
Fig. 4.
GOF mutant Shp2 enhances Plk1 activation in mitosis. (A) Whole-cell lysates prepared from synchronized G1 and mitotic Ptpn11+/+ and Ptpn11D61G/D61G MEFs (Left) or Ptpn11+/+ and Ptpn11E76K/+ MEFs (Right) were examined by immunoprecipitation and immunoblotting as indicated. Numbers shown in B and C indicate arbitrary units of p-Plk1/Plk1 or p-Aurora B/Aurora B from densitometric analyses.
Fig. S6.
Shp2 localizes to the kinetochore through binding to Plk1. (A) GFP-Plk1 and various Flag-tagged Shp2 mutant plasmids were cotransfected into 293T cells. Forty-eight hours after transfection, cells were treated with nocodazole (200 ng/mL) for 16 h. Cell lysates were immunoprecipitated with anti-Flag antibody followed by immunoblotting with anti-GFP antibody. Blots were stripped and reprobed with anti-Flag antibody to determine the expression of various Shp2 constructs. Equal GFP-Plk1 expression levels were verified by immunoblotting with anti-GFP antibody using the whole-cell lysates. (B) GST and various GST–Shp2 fusion proteins were purified by Glutathione-Sephorose 4B beads. Immobilized proteins (5 μg) on beads were incubated with whole-cell lysates (500 μg) prepared from mitotic HeLa cells. The resulting complexes were washed, resolved by SDS/PAGE, and subjected to immunoblotting with anti-Plk1 antibody. (C) Various Flag-tagged Shp2 mutant plasmids were transfected into HeLa cells. Cells were immunostained with anti-Flag antibody and CREST autoimmune serum. Nuclei were counterstained with DAPI. Kinetochores in prometaphase/metaphase cells were examined under a confocal microscope.
Fig. S7.
Inhibition of Plk1 activity reverses the chromosomal instability induced by the Ptpn11E76K mutation. Self-immortalized Ptpn11+/+ and Ptpn11E76K/+ MEFs were treated with the Plk1 inhibitor BI6727 (5 nM) for 24 h. Metaphase cells with chromosomal misalignment or anaphase/telophase cells with lagging chromosomes were counted. These experiments were performed with three batches of cell pools, and more than 100 cells for each cell type were examined in each experiment. The data shown represent the mean ± SD of three cell pools (Left). The activity of Plk1 was examined by immunoblotting with anti–p-Plk1 (Thr210) antibody (Right).
Plk1 Is Tyrosine Phosphorylated by the c-Src Kinase in Mitosis.
During the experiments analyzing the Shp2/Plk1 interaction, we unexpectedly observed tyrosine phosphorylation of Plk1 in mitotic cells (Fig. 5A). Phosphoproteomics analyses identified Tyr166 and Tyr445 as the major phosphorylation sites. To identify the tyrosine kinases that are responsible for Plk1 phosphorylation, we tested a number of tyrosine kinase inhibitors and found that the c-Src kinase inhibitor SU6656 significantly decreased tyrosine phosphorylation of Plk1 in mitosis (Fig. S8A). The same results were obtained from c-Src knockdown cells (Fig. 5B). Intriguingly, Plk1 kinase activity (p-Thr210) was also suppressed in the knockdown or inhibitor-treated cells (Fig. 5B and Fig. S8A), suggesting that tyrosine phosphorylation is required for optimal activation of Plk1. Coimmunoprecipitation analyses demonstrated that Plk1 and c-Src were present in the same immunocomplex (Fig. 5C). To further test whether the c-Src kinase can directly phosphorylate Plk1, we incubated the active c-Src kinase with purified Plk1 in kinase assay buffer. Plk1 was indeed tyrosine phosphorylated by c-Src (Fig. 5D), confirming that tyrosine phosphorylation of Plk1 is most likely carried out by the c-Src kinase.
Fig. 5.
Plk1 is tyrosine phosphorylated by the c-Src kinase in mitosis, and GOF mutant Shp2 enhances Plk1 tyrosine phosphorylation by increasing c-Src activity. (A) Synchronized G1 and mitotic HeLa cells were collected, and cell lysates were examined by immunoprecipitation and immunoblotting as indicated. (B) HeLa cells were transfected with human c-Src shRNA. Cell lysates prepared from mitotic cells were examined by immunoprecipitation and immunoblotting as indicated. (C) Whole-cell lysates prepared from synchronized G1 and mitotic HeLa cells were examined by immunoprecipitation and immunoblotting as indicated. (D) Purified c-Src kinase (5 units) and Plk1 (0.1 µg) were incubated at 37 °C for 30 min in tyrosine kinase assay buffer. The entire reaction system was analyzed by immunoblotting with the indicated antibodies. (E and F) Whole-cell lysates prepared from synchronized G1 and mitotic Ptpn11+/+ and Ptpn11E76K/+ MEFs were examined by immunoprecipitation and immunoblotting as indicated. (G and H) Synchronized G1 and mitotic HeLa cells or synchronized G1 and mitotic Ptpn11+/+ and Ptpn11E76K/+ MEFs were examined by immunoprecipitation and immunoblotting as indicated.
Fig. S8.
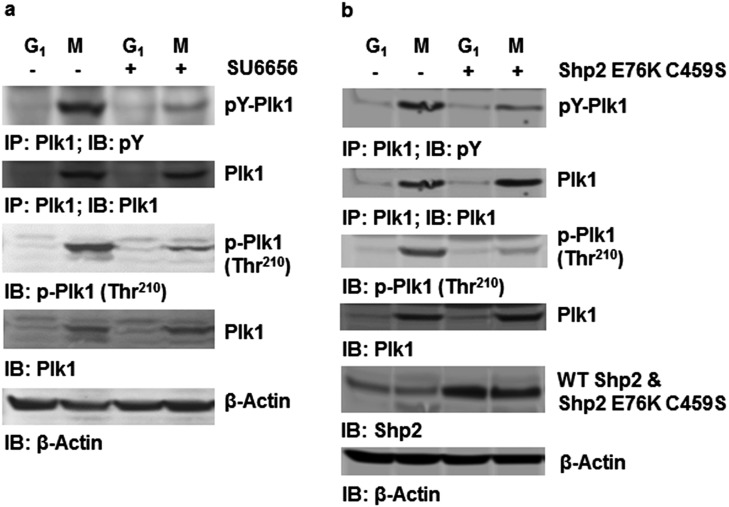
The Ptpn11E76K mutation enhances c-Src–mediated tyrosine phosphorylation and activation of Plk1 in a catalytically dependent manner. (A) HeLa cells were treated with nocodazole (200 ng/mL) for 16 h or synchronized at the G1 phase. The c-Src kinase inhibitor SU6656 (10 µM) was then added. Two hours later, shake-off mitotic cells and synchronized G1 cells were harvested. The cell lysates prepared were immunoprecipitated with anti-Plk1 antibody, followed by immunoblotting with anti-pY antibody. Whole-cell lysates were also examined for the activity of Plk1 by immunoblotting with anti–p-Plk1 (Thr210) antibody. Blots were stripped and reprobed with anti-Plk1 antibody. (B) HeLa cells were transfected with Shp2 E76K C459S cDNA and the control vector. These cells were synchronized at G1 or mitosis. Whole-cell lysates prepared from the synchronized G1 and mitotic cells were immunoprecipitated with anti-Plk1 antibody followed by immunoblotting with anti-pY antibody. Whole-cell lysates were also examined by immunoblotting with anti–p-Plk1 (Thr210) or anti-Shp2 antibodies. Blots were stripped and reprobed with anti-Plk1 and anti–β-Actin antibodies.
GOF Mutant Shp2 Enhances Plk1 Tyrosine Phosphorylation by Promoting Activation of the c-Src Kinase.
We next examined tyrosine phosphorylation of Plk1 in Ptpn11 GOF mutant mitotic cells, which displayed increased Plk1 activity (Fig. 4B). Plk1 tyrosine phosphorylation in Ptpn11E76K/+ mitotic cells was significantly increased (Fig. 5E). Coimmunoprecipitation assays showed that Shp2, c-Src, and Plk1 were present in the same protein complex and that the associations between the Shp2 E76K mutant and c-Src or Plk1 were enhanced compared with those in control cells (Fig. 5F). Previous studies suggest that Shp2 promotes c-Src activation by directly or indirectly controlling phosphorylation levels of C-terminal Tyr527 (30, 31), which negatively regulates its kinase activity (32). We thus determined tyrosine phosphorylation of c-Src in the Shp2 immunocomplex. Autophosphorylation (Tyr416) of Src, indicative of kinase activity, in the Shp2 immunocomplex was clearly increased in mitotic cells compared with G1 cells, whereas the inhibitory phosphorylation at Tyr527, the target of Shp2, was decreased in mitotic cells (Fig. 5G). Furthermore, phosphorylation levels of Tyr416 and Tyr527 of Src were increased and decreased, respectively, in Ptpn11E76K/+ cells relative to those in control cells (Fig. 5H), indicating that the activating mutation E76K of Shp2 increases Plk1 tyrosine phosphorylation by directly or indirectly enhancing dephosphorylation of the inhibitory Tyr527 of the Src kinase. Consistent with this notion, overexpression of the catalytically inactive Shp2 E76K C459S double mutant greatly decreased tyrosine phosphorylation as well as activity (p-Thr210) of Plk1 in mitotic cells (Fig. S8B). These data strongly suggest that the elevated catalytic activity is required for GOF mutant Shp2 to enhance tyrosine phosphorylation and activation of Plk1.
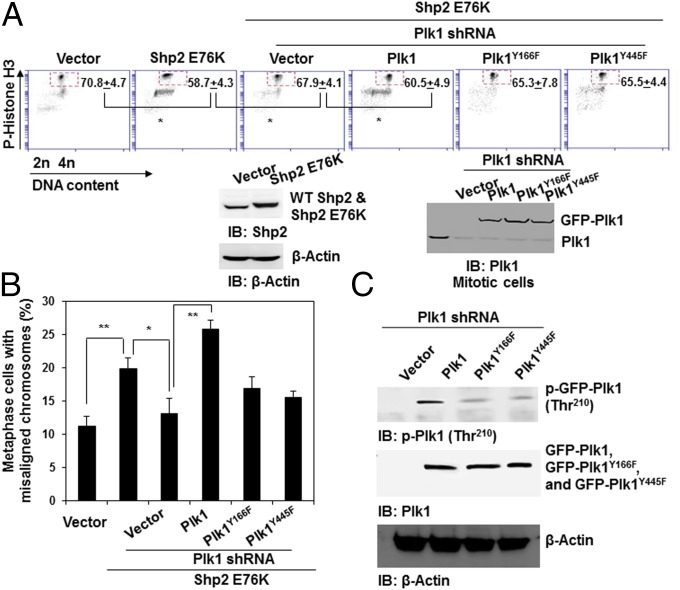
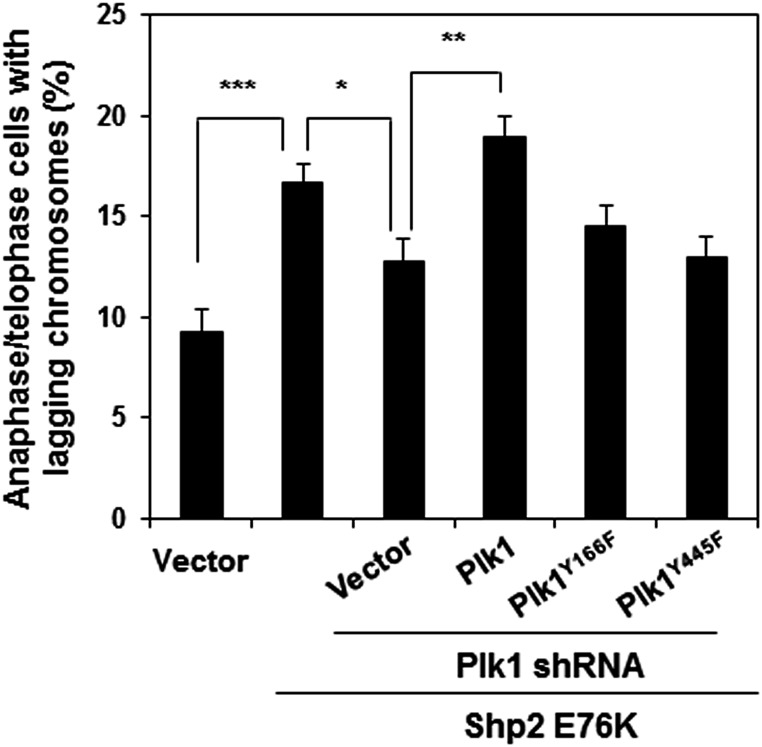
Finally, to verify the role of phosphorylation at Tyr166 and Tyr445 of Plk1 in mediating the detrimental effects of Ptpn11 GOF mutations on mitosis, we knocked down Plk1 from Shp2 E76K-expressing HeLa cells with shRNA, transfected the cells with WT Plk1 or Plk1 mutants with Y166F and Y445F mutations, and then assessed their rescue effects on the mitotic checkpoint in Plk1 knockdown cells. Shp2 E76K-expressing cells displayed a reduced mitotic checkpoint, as evidenced by the decreased mitotic arrest response to nocodazole (Fig. 6A) and increased abnormal mitosis with misaligned and lagging chromosomes (Fig. 6B and Fig. S9), similar to Ptpn11E76K/+ MEFs (Fig. S3B). Silencing Plk1 in the Shp2 E76K-expressing cells partially rescued mitotic checkpoint function (Fig. 6A) and decreased the percentages of metaphase cells with misaligned chromosomes and anaphase/telophase cells with lagging chromosomes (Fig. 6B and Fig. S9) to similar levels in WT Shp2-expressing cells. Importantly, reintroduction of WT Plk1 into the Plk1 knockdown cells restored the Shp2 E76K effect on the mitotic checkpoint (Fig. 6A) and chromosome instability (Fig. 6B and Fig. S9). However, neither Plk1Y166F nor Plk1Y445F mutants showed rescue capabilities in both assays (Fig. 6 A and B and Fig. S9), reaffirming the role of the enhanced tyrosine phosphorylation of Plk1 in mediating the detrimental effect of the Ptpn11 GOF mutation on genomic stability. Indeed, compared with WT Plk1, Plk1Y166F and Plk1Y445F mutants had greatly decreased activities, as determined by p-Thr210 levels (Fig. 6C).
Fig. 6.
Important role of phosphorylation of Y166 and Y445 for the activation of Plk1. Shp2 E76K cDNA and the control vector were transfected into HeLa cells. Shp2 E76K-overexpressing cells were then transfected with Plk1 shRNA targeting 3′UTR. These Plk1 knockdown cells were subsequently transfected with WT GFP-Plk1, GFP-Plk1 mutants with Y166F or Y445F mutations, or the control vector. (A) Forty-eight hours later, cells were treated with nocodazole (200 ng/mL) for 16 h, and the percentages of mitotic cells were determined by propidium iodide (PI) and p-histone H3 double staining followed by FACS analyses. (B) Metaphase cells with chromosomal misalignment were counted. More than 50 mitotic cells for each group were examined. (C) Whole-cell lysates prepared from mitotic cells were examined by immunoblotting as indicated.
Fig. S9.
Important role of phosphorylation of Y166 and Y445 for the activation of Plk1. Shp2 E76K cDNA and the control vector were transfected into HeLa cells. Shp2 E76K-overexpressing cells were then transfected with Plk1 shRNA targeting 3′UTR. These Plk1 knockdown cells were then transfected with WT GFP-Plk1, GFP-Plk1 mutants with Y166F or Y445F mutations (without 3′UTR), or the control vector. Anaphase/telophase cells with lagging chromosomes were counted. These experiments were performed three times, and more than 50 mitotic cells for each group were examined. Data shown are presented as mean ± SD of three independent experiments.
Discussion
In this report, we present several findings that shed light on the tumorigenesis associated with Ptpn11 (Shp2) GOF mutations. Although the overall positive role of Shp2 in growth factor/cytokine signaling has been well established (1, 2), Ptpn11 GOF mutations appear to induce tumorigenesis not only by promoting cell proliferation but also by being permissive for cancer-forming genetic alterations due to the disruption of the mitotic machinery. The role of Shp2 in cell signaling processes represents the function of Shp2 mostly in interphase cells. By specifically focusing on cells in mitosis, a very short yet critical phase in the cell life, our study now demonstrates that Shp2 GOF mutations have a significant impact on genomic stability in both mouse models and patient cells. This impact appears to be independent of their effects on growth factor signal transduction because cell signaling activities during this particular time were not significantly changed by a GOF mutation of Shp2 (Fig. S5). Rather, the increased catalytic activity (8, 9) and enhanced binding of GOF mutant Shp2 to its interacting proteins (14–16) directly disturb mitosis and cytokinesis, evoking chromosomal instability and other genetic alterations that cooperatively drive tumor cell formation. The notion that Shp2 GOF mutations induce chromosomal instability is also supported by clinical observations, in which Ptpn11 GOF mutations were frequently found in childhood leukemias with hyperdiploid DNA content (11, 33), karyotypic changes were often observed in JMML patients with Ptpn11 mutations (34, 35), and Noonan syndrome patients with Ptpn11 mutations were predisposed to hematological malignancies, relative to Ptpn11 mutation-negative cases (36).
Shp2 GOF mutations appear to induce genomic instability by directly disturbing mitosis. One of the findings in this report is that part of the Shp2 protein is localized to the mitotic apparatus, including the centrosome, spindle midzone, midbody, and the kinetochore (Fig. 3 B–F), all of which are known to play critical roles in chromosomal segregation and maintaining genome integrity (23, 28, 29). In addition, Shp2 was detected in the same protein complex with the mitotic kinase Plk1 (Fig. 4A), and the Shp2/Plk1 interaction was required for Shp2 to localize to the mitotic apparatus (Fig. S6C). More importantly, Plk1 was aberrantly activated in Ptpn11 GOF mutant cells (Fig. 4B). Plk1 plays a pleotropic role in mitotic processes. It drives the G2/M progression (26, 27). It is also localized to the centrosome, kinetochore, and spindle midzone; participates in the spindle assembly checkpoint by phosphorylating checkpoint proteins; and is required for the formation of stable kinetochore–microtubule attachments (26, 27). Elevated Plk1 activity causes kinetochore–microtubule attachment errors (37), and Plk1 is indeed overexpressed in various human cancers with poor prognosis (38). Because treatment with a Plk1 inhibitor at a low concentration restored chromosome stability in Shp2 GOF mutant cells (Fig. S7), disrupted mitosis and chromosomal missegregation in Shp2 GOF mutant cells appear to be attributed to the enhanced Plk1 activity.
Another interesting finding in this report is that Shp2 GOF mutations hyperactivate Plk1 by enhancing c-Src kinase-mediated tyrosine phosphorylation of Plk1. We discovered that Plk1 was phosphorylated on Tyr166 and Tyr445 in mitotic cells and that tyrosine phosphorylation of Plk1 correlated with the activation status of Plk1 (Fig. 5B and Fig. 6C). The mitosis-specific tyrosine phosphorylation of Plk1 was likely carried out by the c-Src kinase because tyrosine-phosphorylated Plk1 was detected in the same protein complex with c-Src (Fig. 5C), and the c-Src kinase was indeed able to directly phosphorylate Plk1 in the kinase assay (Fig. 5D). Moreover, knockdown or inhibition of c-Src substantially decreased tyrosine phosphorylation as well as activity of Plk1 (Fig. 5B and Fig. S8A). Plk1 tyrosine phosphorylation (Fig. 5E) and activity (Fig. 4B) were significantly increased in Ptpn11E76K/+ mitotic cells, in which c-Src activity was also increased (Fig. 5H). Given that the inhibitory tyrosine phosphorylation of c-Src (Tyr527) was decreased in Ptpn11E76K/+ mitotic cells expressing the hyperactive Shp2 E76K mutant (Fig. 5H), the increased c-Src activity might be caused by enhanced dephosphorylation of Tyr527 or enhanced dephosphorylation of PAG/Cbp, tyrosine phosphorylation of which is required for the Csk kinase to get access to and phosphorylate c-Src (Tyr527) (31). This notion is supported by the observation that inactivation of the catalytic activity of the Shp2 E76K mutant greatly decreased tyrosine phosphorylation and activity of Plk1 (Fig. S8B). Further studies, however, are required to determine how WT Shp2 initially gets activated in mitosis to facilitate Plk1 tyrosine phosphorylation and how elevated phosphorylation of Tyr166 and Tyr445 promotes Plk1 activation. The detailed structural basis for the physical and functional interactions among Shp2, Src, and Plk1 also needs to be determined.
Materials and Methods
To synchronize cells at the G1 phase, cells were treated with thymidine (2 mM) for 17 h, washed with PBS three times, and then incubated in fresh medium without thymidine. After 9 h, thymidine (2 mM) was added again for another 16 h. To arrest cells in mitosis, cells were treated with nocodazole (200 and 400 ng/mL for HeLa cells and MEFs, respectively) for 16 h. Mitotic cells were then collected by shake-off.
All animal procedures were approved by the Institutional Animal Care and Use Committee at Case Western Reserve University and Emory University. Deidentified patient specimens were utilized in this study. Informed consent was obtained from patients.
SI Materials and Methods
Patient Cells, Mice, and Cell Pools/Lines.
Leukemic cells from two de-identified JMML patients with Ptpn11E76K and Ptpn11D61Y mutations, respectively, were provided by Mignon L. Loh, University of California, San Francisco. Ptpn11D61G/+ mice (15) with a B6 × 129Sv hybrid background originally imported from Beth Israel Deaconess Medical Center were backcrossed with C57BL/6 mice for three generations at the Animal Resources Center, Case Western Reserve University. All animal procedures were approved by the Institutional Animal Care and Use Committee at Case Western Reserve University and Emory University. F3 Ptpn11D61G/+ mice were intercrossed for generation of Ptpn11+/+, Ptpn11D61G/+, and Ptpn11D61G/D61G MEFs. Briefly, embryonic day 12.5–14.5 embryos were dissected from timed pregnant females. Following removal of the heads and internal organs, embryos were minced, and tissue masses were plated and cultured in DMEM supplemented with 10% (vol/vol) FBS, 100 U/mL penicillin, and 100 μg/mL streptomycin. Three days later, embryonic fibroblasts were harvested and designated as passage 1. To immortalize MEFs, Ptpn11+/+, Ptpn11D61G/+, and Ptpn11D61G/D61G cells were cultured and spontaneously immortalized according to the standard 3T3 protocol. To generate Ptpn11E76K/+ and Ptpn11+/+ MEFs, Ptpn11E76K conditional knock-in (Ptpn11E76K neo/+) mice (18) were used to cross estrogen receptor promoter-driven Cre transgenic (ER-Cre+) mice. Ptpn11E76K neo/+/ER-Cre+ and Ptpn11+/+/ER-Cre+ MEFs were generated from the embryos produced by the intercrosses. These MEFs were treated with 4-hydroxytamoxifen (0.5 μM) to induce Cre expression, deletion of the loxp flanked neo cassette, and expression of Shp2 E76K in Ptpn11E76K neo/+/ER-Cre+ cells, whereas WT Shp2 expression in Ptpn11+/+/ER-Cre+ cells was intact.
Flow Cytometric Analysis.
Cells were harvested by trypsinization and fixed in ice-cold 75% (vol/vol) ethanol at –20 °C overnight. Fixed cells were treated with RNase A (20 μg/mL) at 37 °C for 30 min, washed with PBS, and then stained with PI (50 μg/mL in PBS). DNA content was analyzed by standard flow cytometric procedures. For immunofluorescence detection of p-histone H3, fixed cells were resuspended in 0.25% Triton X-100 in PBS and permeabilized on ice for 15 min. Cells were then incubated at room temperature for 3 h in 1% BSA/PBS containing anti–p-histone H3 antibody (1:100 dilution). After washing twice in 1% BSA/PBS, cells were resuspended in PBS containing 1% BSA and Alexa 488-conjugated secondary antibody (1:100 dilution) and incubated at room temperature for 0.5–1 h. The cells were then stained with PI at 37 °C for 30 min and analyzed using a Coulter EPICS XL MCL cytometer (Beckman Coulter Inc.). Data were analyzed using Expo32v1.2 software.
Karyotype and Spectral Karyotype Analyses.
To prepare metaphase spreads from MEFs, 1 × 10⁶ cells were treated with colcemid (0.10 µg/mL) at 37 °C for 4 h, harvested, resuspended in prewarmed 75 mM KCl, and incubated at 37 °C for 10 min. Cells were then fixed in Carnoy’s solution [75% (vol/vol) methanol and 25% (vol/vol) acetic acid] at room temperature for 20 min, washed twice with fixative, and finally resuspended in fixative. Aliquots of 25 µL were dropped onto prechilled microscope slides. The slides were then stained with DAPI, and chromosome numbers were counted under a microscope using a 100× oil objective. For spectral karyotype analysis, metaphase spreads were incubated with a mouse SkyPaint kit probe (Applied Spectral Imaging Inc.), followed by counterstaining with DAPI. Chromosomes were identified using a SKY SD300VDS workstation equipped with SKY View software.
Time-Lapse Microscopic Analysis.
Primary MEFs were plated on 35-mm culture dishes. Twenty-four hours after plating, cells were monitored for 16 h using a Leica DMI600B inverted microscope equipped with an environmental control chamber. Images were taken every 5 min with a Retiga EXI 12 bit camera (Q Imaging) and analyzed with MetaMorph software (Universal Imaging Corp.). Cells were followed from the onset of metaphase until the completion of cell separation.
Immunostaining and Confocal Microscopy.
For immunofluorescence analyses, cells growing on coverslips were washed with cold PBS, fixed in 100% (vol/vol) methanol at –20 °C for 10 min, and permeabilized with 0.25% Triton X-100 in PBS for 10 min. Cells were blocked with 2% (mass/vol) BSA in PBS at room temperature for 1 h and then incubated with the indicated primary antibodies at room temperature for 1 h or at 4 °C overnight. After washing three times with PBS, cells were incubated with Alexa 488 or Alexa 568-conjugated secondary antibodies at room temperature for 1 h. Nuclei were counterstained with DAPI. Stained cells were examined with a Nikon fluorescence microscope (Nikon). All confocal images were acquired using a Zeiss LSM 510 inverted laser-scanning confocal microscope (Zeiss, Germany) and analyzed with Zeiss and MetaMorph software.
Immunocomplex Phosphatase Assay.
Whole-cell lysates (500 μg) were immunoprecipitated with 2 μg of anti-Shp2 antibody. Immune complexes were washed twice with washing buffer (20 mM Hepes pH 7.4, 50 mM NaCl, 2.5 mM MgCl2, 0.1 mM EDTA, and 0.05% Triton X-100) and once with the buffer containing 20 mM Hepes pH 7.4, 50 mM DTT, and 2.5 mM EDTA. p-nitrophenyl phosphate (pNPP) (1.5 mg/mL pNPP in tyrosine phosphatase assay buffer containing 20 mM Hepes pH 7.4, 50 mM NaCl, 2.5 mM EDTA, 5 mM DTT, and 100 µg/mL BSA) was then added to each sample and incubated at 30 °C for 1 h. Supernatants were transferred to 96-well plates, and absorbance at 405 nm was measured.
GST Fusion Protein Pull-Down Assay.
GST and GST–Shp2 fusion proteins were purified by Glutathione-Sephorose 4B beads, and immobilized proteins on beads were equilibrated in the buffer containing 50 mM Tris⋅HCl pH 7.4, 1% Nonidet P-40, 0.25% Na-deoxycholate, 150 mM NaCl, 1 mM EDTA, 1 mM NaF, 2 mM Na3VO4, and 1 mM phenylmethylsulfonyl fluoride. Whole-cell lysates (500 μg) prepared from G1, mitotic cells or purified His-tagged Plk1 (Sigma) were incubated with 5 μg of immobilized GST–Shp2 fusion proteins at 4 °C for 2 h. After extensive washing, the beads were boiled in SDS/PAGE sample buffer and subjected to immunoblotting analysis using anti-Plk1 antibody.
In Vitro Kinase Assay.
Purified c-Src kinase (5 units) and Plk1 (0.1 µg) were incubated at 37 °C for 30 min in tyrosine kinase assay buffer (50 mM Hepes, 50 mM NaCl, 10 mM MgCl2, 3 mM MnCl2, 2 mM EGTA, 0.1 mM Na3VO4, 5 mM ATP, and 1 mM DTT). The kinase reaction was terminated by 2% (mass/vol) SDS. Tyrosine phosphorylation of Plk1 in the assay system was analyzed by immunoblotting with anti-pY antibody.
Statistical Analysis.
All experiments were performed using at least three different batches of MEFs or bone marrow cells isolated from three different mice. Data are presented as mean ± SD. Statistical significance was determined using unpaired two-tailed Student’s t test. *P < 0.05; **P < 0.01; ***P < 0.001.
Acknowledgments
This work was supported by National Institutes of Health Grants CA181754 and DK092722 (to C.-K.Q.).
Footnotes
The authors declare no conflict of interest.
This article is a PNAS Direct Submission.
This article contains supporting information online at www.pnas.org/lookup/suppl/doi:10.1073/pnas.1508535113/-/DCSupplemental.
References
- 1.Chan G, Kalaitzidis D, Neel BG. The tyrosine phosphatase Shp2 (PTPN11) in cancer. Cancer Metastasis Rev. 2008;27(2):179–192. doi: 10.1007/s10555-008-9126-y. [DOI] [PubMed] [Google Scholar]
- 2.Tonks NK. Protein tyrosine phosphatases--From housekeeping enzymes to master regulators of signal transduction. FEBS J. 2013;280(2):346–378. doi: 10.1111/febs.12077. [DOI] [PMC free article] [PubMed] [Google Scholar]
- 3.Bennett AM, Tang TL, Sugimoto S, Walsh CT, Neel BG. Protein-tyrosine-phosphatase SHPTP2 couples platelet-derived growth factor receptor beta to Ras. Proc Natl Acad Sci USA. 1994;91(15):7335–7339. doi: 10.1073/pnas.91.15.7335. [DOI] [PMC free article] [PubMed] [Google Scholar]
- 4.Li W, et al. A new function for a phosphotyrosine phosphatase: Linking GRB2-Sos to a receptor tyrosine kinase. Mol Cell Biol. 1994;14(1):509–517. doi: 10.1128/mcb.14.1.509. [DOI] [PMC free article] [PubMed] [Google Scholar]
- 5.Yuan L, Yu WM, Xu M, Qu CK. SHP-2 phosphatase regulates DNA damage-induced apoptosis and G2/M arrest in catalytically dependent and independent manners, respectively. J Biol Chem. 2005;280(52):42701–42706. doi: 10.1074/jbc.M506768200. [DOI] [PubMed] [Google Scholar]
- 6.Tsang YH, Han X, Man WY, Lee N, Poon RY. Novel functions of the phosphatase SHP2 in the DNA replication and damage checkpoints. PLoS One. 2012;7(11):e49943. doi: 10.1371/journal.pone.0049943. [DOI] [PMC free article] [PubMed] [Google Scholar]
- 7.Liu X, Zheng H, Qu CK. Protein tyrosine phosphatase Shp2 (Ptpn11) plays an important role in maintenance of chromosome stability. Cancer Res. 2012;72(20):5296–5306. doi: 10.1158/0008-5472.CAN-12-1495. [DOI] [PMC free article] [PubMed] [Google Scholar]
- 8.Tartaglia M, et al. Mutations in PTPN11, encoding the protein tyrosine phosphatase SHP-2, cause Noonan syndrome. Nat Genet. 2001;29(4):465–468. doi: 10.1038/ng772. [DOI] [PubMed] [Google Scholar]
- 9.Tartaglia M, et al. Somatic mutations in PTPN11 in juvenile myelomonocytic leukemia, myelodysplastic syndromes and acute myeloid leukemia. Nat Genet. 2003;34(2):148–150. doi: 10.1038/ng1156. [DOI] [PubMed] [Google Scholar]
- 10.Loh ML, et al. Mutations in PTPN11 implicate the SHP-2 phosphatase in leukemogenesis. Blood. 2004;103(6):2325–2331. doi: 10.1182/blood-2003-09-3287. [DOI] [PubMed] [Google Scholar]
- 11.Tartaglia M, et al. Genetic evidence for lineage-related and differentiation stage-related contribution of somatic PTPN11 mutations to leukemogenesis in childhood acute leukemia. Blood. 2004;104(2):307–313. doi: 10.1182/blood-2003-11-3876. [DOI] [PubMed] [Google Scholar]
- 12.Loh ML, et al. Children’s Cancer Group PTPN11 mutations in pediatric patients with acute myeloid leukemia: Results from the Children’s Cancer Group. Leukemia. 2004;18(11):1831–1834. doi: 10.1038/sj.leu.2403492. [DOI] [PubMed] [Google Scholar]
- 13.Bentires-Alj M, et al. Activating mutations of the noonan syndrome-associated SHP2/PTPN11 gene in human solid tumors and adult acute myelogenous leukemia. Cancer Res. 2004;64(24):8816–8820. doi: 10.1158/0008-5472.CAN-04-1923. [DOI] [PubMed] [Google Scholar]
- 14.Fragale A, Tartaglia M, Wu J, Gelb BD. Noonan syndrome-associated SHP2/PTPN11 mutants cause EGF-dependent prolonged GAB1 binding and sustained ERK2/MAPK1 activation. Hum Mutat. 2004;23(3):267–277. doi: 10.1002/humu.20005. [DOI] [PubMed] [Google Scholar]
- 15.Araki T, et al. Mouse model of Noonan syndrome reveals cell type- and gene dosage-dependent effects of Ptpn11 mutation. Nat Med. 2004;10(8):849–857. doi: 10.1038/nm1084. [DOI] [PubMed] [Google Scholar]
- 16.Yu WM, Daino H, Chen J, Bunting KD, Qu CK. Effects of a leukemia-associated gain-of-function mutation of SHP-2 phosphatase on interleukin-3 signaling. J Biol Chem. 2006;281(9):5426–5434. doi: 10.1074/jbc.M507622200. [DOI] [PubMed] [Google Scholar]
- 17.Chan G, et al. Leukemogenic Ptpn11 causes fatal myeloproliferative disorder via cell-autonomous effects on multiple stages of hematopoiesis. Blood. 2009;113(18):4414–4424. doi: 10.1182/blood-2008-10-182626. [DOI] [PMC free article] [PubMed] [Google Scholar]
- 18.Xu D, et al. Non-lineage/stage-restricted effects of a gain-of-function mutation in tyrosine phosphatase Ptpn11 (Shp2) on malignant transformation of hematopoietic cells. J Exp Med. 2011;208(10):1977–1988. doi: 10.1084/jem.20110450. [DOI] [PMC free article] [PubMed] [Google Scholar]
- 19.Xu D, et al. A germline gain-of-function mutation in Ptpn11 (Shp-2) phosphatase induces myeloproliferative disease by aberrant activation of hematopoietic stem cells. Blood. 2010;116(18):3611–3621. doi: 10.1182/blood-2010-01-265652. [DOI] [PMC free article] [PubMed] [Google Scholar]
- 20.Keilhack H, David FS, McGregor M, Cantley LC, Neel BG. Diverse biochemical properties of Shp2 mutants. Implications for disease phenotypes. J Biol Chem. 2005;280(35):30984–30993. doi: 10.1074/jbc.M504699200. [DOI] [PubMed] [Google Scholar]
- 21.Holland AJ, Cleveland DW. Boveri revisited: Chromosomal instability, aneuploidy and tumorigenesis. Nat Rev Mol Cell Biol. 2009;10(7):478–487. doi: 10.1038/nrm2718. [DOI] [PMC free article] [PubMed] [Google Scholar]
- 22.Schvartzman JM, Sotillo R, Benezra R. Mitotic chromosomal instability and cancer: Mouse modelling of the human disease. Nat Rev Cancer. 2010;10(2):102–115. doi: 10.1038/nrc2781. [DOI] [PMC free article] [PubMed] [Google Scholar]
- 23.Foley EA, Kapoor TM. Microtubule attachment and spindle assembly checkpoint signalling at the kinetochore. Nat Rev Mol Cell Biol. 2013;14(1):25–37. doi: 10.1038/nrm3494. [DOI] [PMC free article] [PubMed] [Google Scholar]
- 24.Ricke RM, van Deursen JM. Aneuploidy in health, disease, and aging. J Cell Biol. 2013;201(1):11–21. doi: 10.1083/jcb.201301061. [DOI] [PMC free article] [PubMed] [Google Scholar]
- 25.Yang Z, Loncarek J, Khodjakov A, Rieder CL. Extra centrosomes and/or chromosomes prolong mitosis in human cells. Nat Cell Biol. 2008;10(6):748–751. doi: 10.1038/ncb1738. [DOI] [PMC free article] [PubMed] [Google Scholar]
- 26.Lens SM, Voest EE, Medema RH. Shared and separate functions of polo-like kinases and aurora kinases in cancer. Nat Rev Cancer. 2010;10(12):825–841. doi: 10.1038/nrc2964. [DOI] [PubMed] [Google Scholar]
- 27.Archambault V, Glover DM. Polo-like kinases: Conservation and divergence in their functions and regulation. Nat Rev Mol Cell Biol. 2009;10(4):265–275. doi: 10.1038/nrm2653. [DOI] [PubMed] [Google Scholar]
- 28.Vitre BD, Cleveland DW. Centrosomes, chromosome instability (CIN) and aneuploidy. Curr Opin Cell Biol. 2012;24(6):809–815. doi: 10.1016/j.ceb.2012.10.006. [DOI] [PMC free article] [PubMed] [Google Scholar]
- 29.Fukagawa T, Earnshaw WC. The centromere: Chromatin foundation for the kinetochore machinery. Dev Cell. 2014;30(5):496–508. doi: 10.1016/j.devcel.2014.08.016. [DOI] [PMC free article] [PubMed] [Google Scholar]
- 30.Peng ZY, Cartwright CA. Regulation of the Src tyrosine kinase and Syp tyrosine phosphatase by their cellular association. Oncogene. 1995;11(10):1955–1962. [PubMed] [Google Scholar]
- 31.Zhang SQ, et al. Shp2 regulates SRC family kinase activity and Ras/Erk activation by controlling Csk recruitment. Mol Cell. 2004;13(3):341–355. doi: 10.1016/s1097-2765(04)00050-4. [DOI] [PubMed] [Google Scholar]
- 32.Bagrodia S, Chackalaparampil I, Kmiecik TE, Shalloway D. Altered tyrosine 527 phosphorylation and mitotic activation of p60c-src. Nature. 1991;349(6305):172–175. doi: 10.1038/349172a0. [DOI] [PubMed] [Google Scholar]
- 33.Paulsson K, et al. Mutations of FLT3, NRAS, KRAS, and PTPN11 are frequent and possibly mutually exclusive in high hyperdiploid childhood acute lymphoblastic leukemia. Genes Chromosomes Cancer. 2008;47(1):26–33. doi: 10.1002/gcc.20502. [DOI] [PubMed] [Google Scholar]
- 34.Shimada H, et al. Somatic PTPN11 mutation with a heterogeneous clonal origin in children with juvenile myelomonocytic leukemia. Leukemia. 2004;18(6):1142–1144. doi: 10.1038/sj.leu.2403374. [DOI] [PubMed] [Google Scholar]
- 35.Chantrain CF, et al. Therapy-related acute myeloid leukemia in a child with Noonan syndrome and clonal duplication of the germline PTPN11 mutation. Pediatr Blood Cancer. 2007;48(1):101–104. doi: 10.1002/pbc.20527. [DOI] [PubMed] [Google Scholar]
- 36.Yoshida R, et al. Protein-tyrosine phosphatase, nonreceptor type 11 mutation analysis and clinical assessment in 45 patients with Noonan syndrome. J Clin Endocrinol Metab. 2004;89(7):3359–3364. doi: 10.1210/jc.2003-032091. [DOI] [PubMed] [Google Scholar]
- 37.Liu D, Davydenko O, Lampson MA. Polo-like kinase-1 regulates kinetochore-microtubule dynamics and spindle checkpoint silencing. J Cell Biol. 2012;198(4):491–499. doi: 10.1083/jcb.201205090. [DOI] [PMC free article] [PubMed] [Google Scholar]
- 38.Strebhardt K, Ullrich A. Targeting polo-like kinase 1 for cancer therapy. Nat Rev Cancer. 2006;6(4):321–330. doi: 10.1038/nrc1841. [DOI] [PubMed] [Google Scholar]


