Significance
Cancer stem cells are cancer cells with self-renewal and tumor-growth properties and are important targets for development of anticancer therapy. We have found breast cancer stem cells can be enriched by stage-specific embryonic antigen 3 (SSEA-3) and known protein markers (CD24 and CD44), and as few as 10 such enriched cells can develop tumor in mice. Also, the enzyme galactosyltransferase (β3GalT5) for the biosynthesis of SSEA-3 is expressed in breast cancer stem cells and cancer cells but not in normal cells, and both SSEA-3 and β3GalT5 are shown to be essential for cancer cell survival. These findings have led to the development of a new anticancer strategy with a proof of principle shown in this and previous studies.
Keywords: globo-series, glycolipids, cancer-specific
Abstract
The discovery of cancer stem cells (CSCs), which are responsible for self-renewal and tumor growth in heterogeneous cancer tissues, has stimulated interests in developing new cancer therapies and early diagnosis. However, the markers currently used for isolation of CSCs are often not selective enough to enrich CSCs for the study of this special cell population. Here we show that the breast CSCs isolated with CD44+CD24-/loSSEA-3+ or ESAhiPROCRhiSSEA-3+ markers had higher tumorigenicity than those with conventional markers in vitro and in vivo. As few as 10 cells with CD44+CD24-/loSSEA-3+ formed tumor in mice, compared with more than 100 cells with CD44+CD24-/lo. Suppression of SSEA-3 expression by knockdown of the gene encoding β-1,3-galactosyltransferase 5 (β3GalT5) in the globo-series pathway, led to apoptosis in cancer cells specifically but had no effect on normal cells. This finding is further supported by the analysis of SSEA-3 and the two related globo-series epitopes SSEA4 and globo-H in stem cells (embryonic stem cells and induced pluripotent stem cells) and various normal and cancer cells, and by the antibody approach to target the globo-series glycans and the late-stage clinical trials of a breast cancer vaccine.
Cancer stem cells (CSCs), which are rare cells with the ability of self-renewal and tumor initiation, are closely related to cancer progression and specific targets for effective therapy and early diagnosis (1–5). To date, many CSCs have been identified and characterized by protein markers. Breast CSCs (BCSCs) were first discovered in 2003 by Al-Hajj et al. (6); it was demonstrated that breast cancer cells with CD44+CD24-/lo expression have higher level of tumorigenicity than others and can form tumor in animals with ∼100 of such cells. In addition, other proteins such as ALDH-1, CD133, CD326 (ESA), CD201 (PROCR), and their combinations, are also reported as BCSCs biomarkers (7–9). However, the BCSCs obtained from the enrichment process based on these markers still contain a large number of noncancer stem cells, and study of such cells would provide nonspecific characteristics of CSCs. Therefore, new markers are required to enrich and obtain better-defined BCSCs for analysis and study.
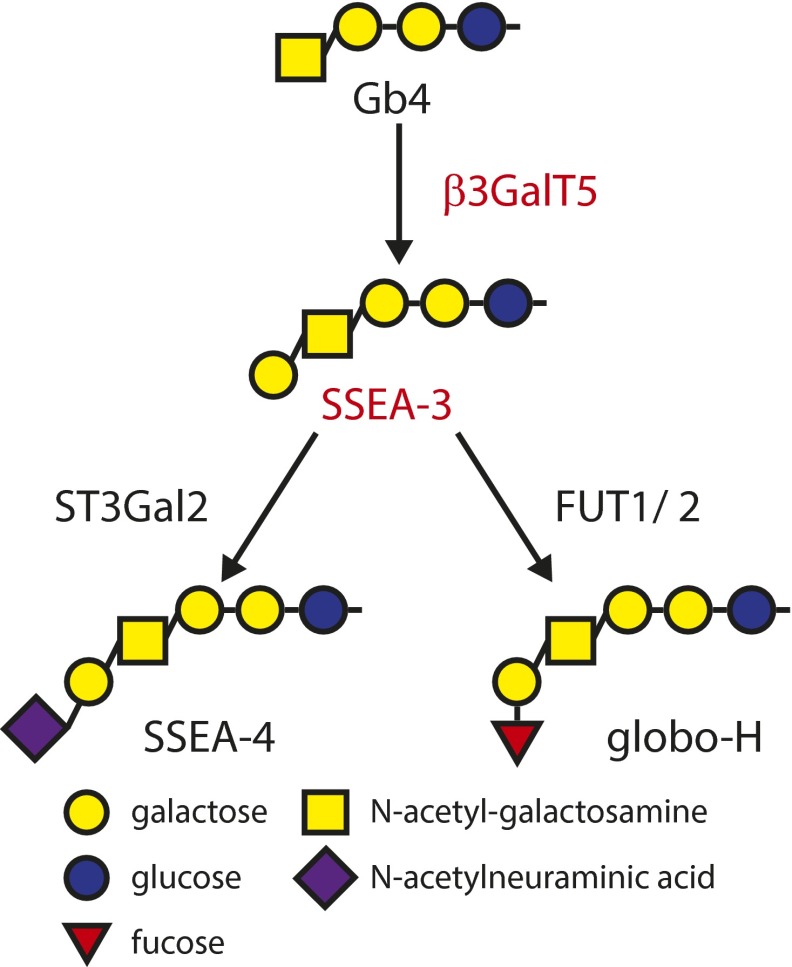
Glycolipids are known to be altered during cancer development (10–15). In our previous study, the globo-series glycans SSEA-3 (Gb5), SSEA-4 (sialyl-Gb5), and globo-H (fucosyl-Gb5) are found exclusively on the cell surface of many cancers, including breast cancer and BCSCs (16–18). We also reported that BCSCs carrying either ESAhiPROCRhi or CD44+CD24-/lo showed high expression of these globo-series epitopes (19). SSEA-3 is synthesized from Gb4 by β3GalT5 (20), and globo-H and SSEA-4 are synthesized from SSEA-3 by fucosyltransferases 1 and 2 (FUT1, FUT2) (21, 22) and ST3 β-galactoside α-2,3-sialyltransferase 2 (ST3Gal2) (23), respectively. These reports prompt us to investigate whether SSEA-3 and the related glycans and enzymes in the globo-series pathway are cancer specific and are BCSC markers.
Results and Discussion
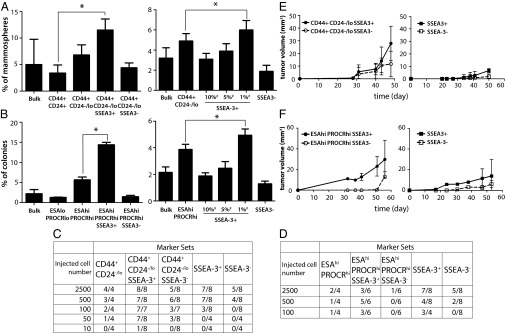
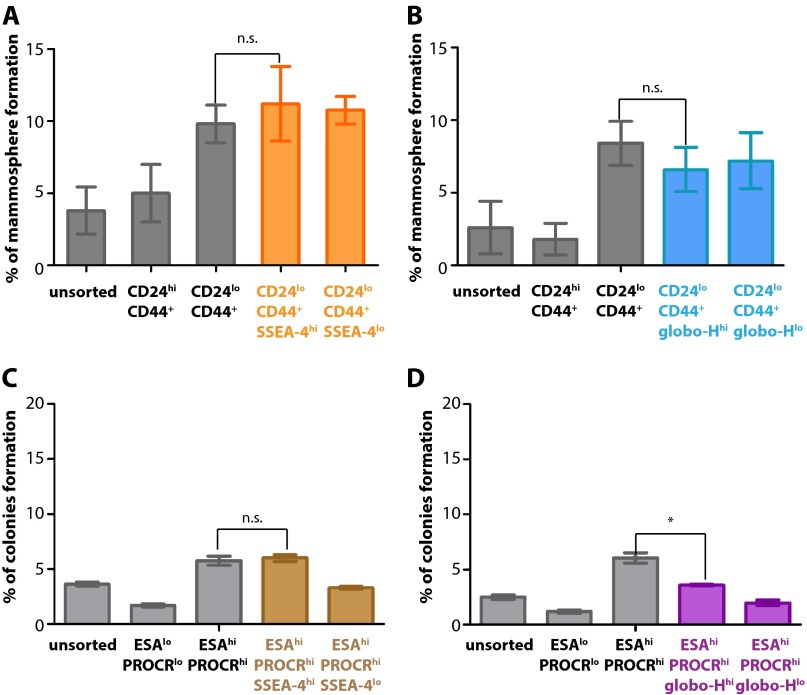
To study the tumorigenic ability of cells, cancer cells were stained with corresponding antibodies against the glycolipid molecules SSEA-3, SSEA-4, and globo-H and the known marker sets CD44/CD24 and ESA/PROCR in breast cancer cell lines MCF-7 and MDA-MB-231, respectively, for the cell sorting (Fig. S1, sorting 1). The isolated cell populations were next examined by both in vitro (24) and in vivo (8) assays (Fig. 1). In MCF-7, cancer cells expressing CD44+CD24-/loSSEA-3+ formed a higher percentage of mammospheres than those expressing CD44+CD24-/loSSEA-3− or CD44+CD24-/lo (Fig. 1A, Left). Similarly, in MDA-MB-231, the ESAhiPROCRhiSSEA-3+ subpopulation formed a higher percentage of cell colonies than ESAhiPROCRhiSSEA-3− or ESAhiPROCRhi cells in the soft agar assay (Fig. 1B, Left). However, there were no significant differences in the formation of cell colony and mammosphere using the cells isolated by the known marker sets along with the glycolipid epitopes SSEA-4 or globo-H (Fig. S2). To show the tumorigenicity in cells carrying known BCSC markers and SSEA-3, different subpopulations were inoculated into the mammary glands of NOD-SCID mice for tumor-growth. The result showed that both CD44+CD24-/loSSEA-3+ and ESAhiPROCRhiSSEA-3− effectively generated tumor in vivo with a low cell number, compared with other corresponding subpopulations (Fig. 1 C and D). Particularly for cells expressing CD44+CD24-/loSSEA-3+, as few as 10 cells were able to form tumor in mice (Fig. 1C). In terms of tumor growth, the tumor volume of CD44+CD24-/loSSEA-3+ cells was twice larger than that of CD44+CD24-/loSSEA-3− cells (Fig. 1E, Left). In addition, ESAhiPROCRhiSSEA-3+ cells developed tumors earlier and formed tumors in a greater average volume than ESAhiPROCRhiSSEA-3− cells (Fig. 1F, Left). These results indicate that SSEA-3 is a specific marker for the enrichment of BCSCs in different breast cancer cell models. Among these glycan molecules, only cells carrying SSEA-3 and known BCSC markers had a higher tumorigenicity than other subpopulations.
Fig. S1.
The subpopulations in cell lines obtained by sorting for in vitro and in vivo assays. Subpopulations including CD44+ CD24hi, CD44+ CD24-/lo, CD44+ CD24-/lo SSEA-3+, CD44+ CD24/lo SSEA-3−, various percentages of SSEA-3+ (top 1, 5, 10%), and SSEA-3− in MCF-7 (A), as well as ESAloPROCRlo, ESAhiPROCRhi, ESAhiPROCRhiSSEA-3+, ESAhiPROCRhiSSEA-3−, various percentages of SSEA-3+ (top 1, 5, 10%), and SSEA-3− in MDA-MB-231 (B), were enriched by cell staining (Materials and Methods) and flow cytometry for the further analysis.
Fig. 1.
The tumorigenicity of cells carrying conventional markers and SSEA-3 was higher than other subpopulations. (A and B) Percentage of cell colony or mammosphere formation of the subpopulation isolated by selected marker(s) for suspension culture or soft agar assay in MCF-7 or MDA-MB-231 respectively. Graphs are the triple samples from one representative experiment. (C and D) The number of tumor formed in mammary gland of NS injected with selected marker-expressing cell subpopulations from breast cancer cell lines MDA-MB-231 and MCF-7. The corresponding limiting dilution assay was done in vivo. (E and F) The tumor volume from different subpopulations of MDA-MB-231 (2500 cells/injection), and MCF-7 (500 cells per injection) was monitored and compared (n = 4 tumors per group). #, The percentage of SSEA-3+ cells sorted in the total cell population. Data represent the mean and SD. Asterisks indicate statistical significance, P < 0.05.
Fig. S2.
BCSCs were not enriched with globo-series epitopes SSEA-4 and globo-H by in vitro assays. (A–D) Percentage of cell colony formation of unsorted cells or selected marker (known marker set CD24/CD44 or ESA/PROCR, along with SSEA-4 or globo-H) expressing cell subpopulation from breast cancer cell lines MCF-7 and MDA-MB-231. Graphs are the triple samples from one representative experiment. Data represent the mean and SD. Asterisks indicate statistical significance, P < 0.05; n.s., not significant.
We next compared the stem-like properties of cancer cells with highly expressed SSEA-3 and those without SSEA-3 (Fig. S1, sorting 2). In SSEA-3+ MCF-7 cells, the top 1% of cells expressing a high level of SSEA-3 within the total population formed a higher percentage of mammosphere than the bulk population and those without SSEA-3 and CD44+CD24-/lo (Fig. 1A, Right). In addition, the top 1% of MDA-MB 231 cells with the highest SSEA-3 expression within the bulk population also formed more cell colonies than the bulk population and other subpopulations (Fig. 1B, Right). In the animal study, results showed that the cells with top 1% SSEA-3 expression had a higher potential to form tumor than SSEA-3− cells (Fig. 1 C and D), and the average tumor volume of SSEA-3+ cells was greater than that of SSEA-3− cells (Fig. 1 E and F, Right). Thus, cancer cells expressing a high level of SSEA-3 had a higher tumorigencity than those without SSEA-3 on cell surface, indicating that SSEA-3 is also an independent CSCs marker for breast cancer.
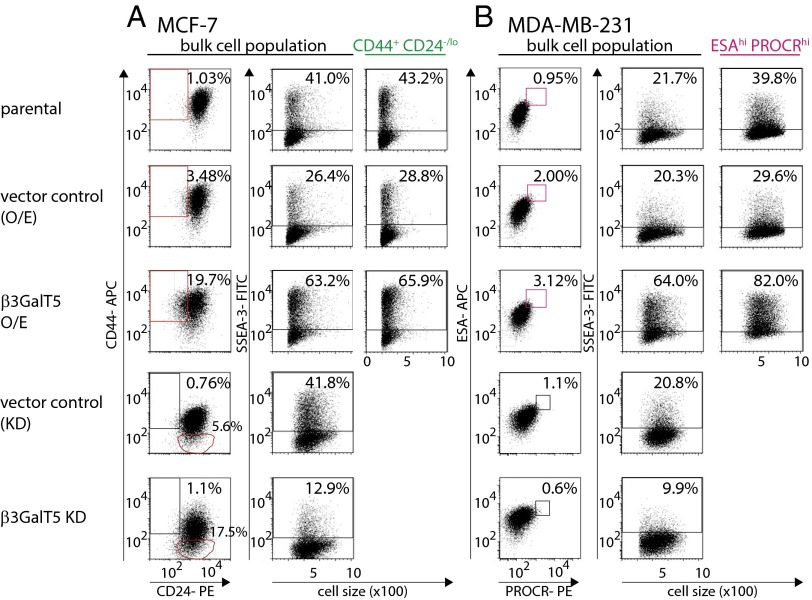
To understand the function of SSEA-3, the gene of β3GalT5 responsible for SSEA-3 biosynthesis (Fig. S3) was overexpressed or knocked down for further study. Overexpression of β3GalT5 increased the expression level of surface SSEA-3 in both MCF-7 and MDA-MB-231 cells (Fig. 2). Notably, in MCF-7 cells, the percentage of CD44+CD24-/lo cell population showed fivefold increase comparing to control (Fig. 2A); in MDA-MB-231 cells, there was no change in the percentage of ESAhiPROCRhi when β3GalT5 was overexpressed (Fig. 2B). In MCF-7 cells with β3GalT5 knockdown, comparing with control cells, the expression level of surface CD44 was reduced, and therefore the CD44−CD24+ cell population increased 10 folds (Fig. 2A). In MDA-MB-231 cells with β3GalT5 knockdown, the level of surface PROCR decreased and the ESAhiPROCRhi BCSC subpopulation reduced (Fig. 2B). These findings further confirmed that SSEA-3 is a critical glycan molecule associated with BCSCs. It is, however, not clear regarding the relationship between the expression of β3GalT5 and that of CD44 and PROCR, and this issue remains to be investigated.
Fig. S3.
The globo-series pathway in human. The biosynthetic pathway of globo-series epitopes SSEA-3, SSEA-4, and globo-H from Gb4 with corresponding glycotransferases.
Fig. 2.
Knockdown or overexpression of β3GalT5 in MCF-7 and MDA-MB-231 cell culture reduced or increased the level of SSEA-3 on cell surface and stemness properties by FACS analysis. The expression of CSC markers and SSEA-3 in parental cells. The level of SSEA-3 in subpopulations CD44+CD24-/lo and ESAhi PROCRhi gated in overexpressed β3GalT5 group was also determined. (A) The expression of CD24, CD44, and SSEA-3 in MCF-7 with overexpression, knocked down of β3GalT5 or their corresponding vector control. (B) The expression of ESA, PROCR and SSEA-3 in MDA-MB-231 with overexpression, knockdown down of β3GalT5 or their corresponding vector control. All of experiments are the representative sample from triplicate.
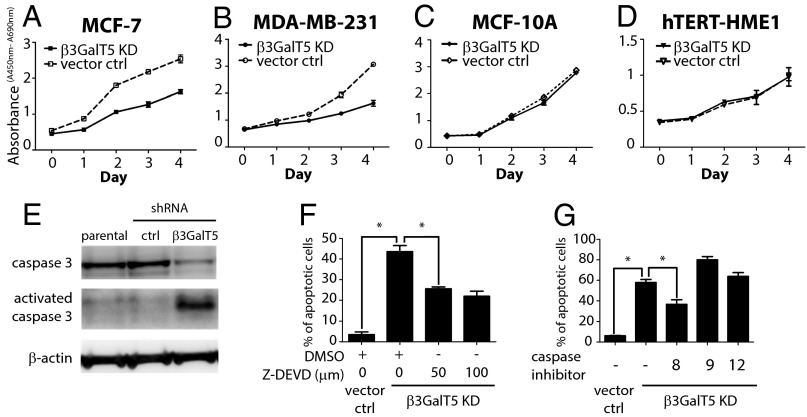
To gain insights into the role of SSEA-3 in breast cancer and normal cells, the cellular phenotypes were examined in the β3GalT5 knockdown cells. In both MDA-MB-231 and MCF-7 cells, knockdown of β3GalT5 suppressed cell growth (Fig. 3 A and B), along with the appearance of cell apoptosis, especially in MDA-MB-231 cells that >60% of cells underwent apoptosis on day 4 (Fig. 4 B and C). In contrast, in normal breast cells MCF-10A and human telomerase reverse transcriptase (hTERT)-immortalized human mammary epithelial cells, hTERT-HME1, the same growth rate and no apoptosis were observed with knockdown of β3GalT5 (Figs. 3 C and D and 4 B and C). However, knockdown of FUT1 and FUT2 for the synthesis of globo-H from SSEA-3 or ST3Gal2 for the synthesis of SSEA-4 from SSEA-3 did not induce cell apoptosis in MDA-MB-231 cells (Fig. 4 A and D).
Fig. 3.
Knockdown of β3GalT5 caused reduced proliferation rate and increased apoptosis in cancer cell culture but no effect on normal breast cell culture. (A–D) The rate of proliferation in cancer cell culture MCF-7 and MDA-231, as well as breast normal cell culture MCF-10A and hTERT-HME1. Proliferation rate, in terms of absorbance (A450nm-A690nm), is the triplicate from a representative sample. (E) MDA-MB-231 cells infected with shRNA β3GalT5 or shRNA vector were lysed and whole-cell extract, cytoplasmic and nuclear fractions were prepared. Top, Western blot analysis of anti–caspase-3 antibody; middle, that of cleaved caspase-3 antibody; bottom, that of β-actin (served as a loading control). (F and G) The percentage of apoptotic MDA-MB-231 cells with β3GalT5 knockdown. MDA-MB-231 cells were treated with caspase-3 inhibitors Z-DEVD in different concentrations or the inhibitors for caspase-8, -9, or -12. Data represent here is the mean and SD from triplicated sample. Asterisks indicate statistical significance, P < 0.05; n.s., not significant.
Fig. 4.
The induction of apoptosis in β3GalT5 knockdown cell lines. (A) The relative percentage of gene expression (β3GalT5 in MCF-7, β3GalT5, FUT1, FUT2, and ST3Gal2 in MDA-MB-231) after knocking down the respective genes. The percentage of gene expression in vector control cells were normalized to 100. (B) The mean percentage of apoptosis in breast normal (hTERT-HME1, MCF-10A) and cancer (MCF-7, MDA-MB-231) cell lines from three experiments. (C) Flow cytometric analysis of the apoptosis percentage in breast cancer cell lines MDA-MB-231, MCF-7, and breast noncancer lines hTERT-HME1 and MCF-10A was examined after knockdown of β3GalT5 for 4 d. The apoptotic cells were compared with unstained cells and gated. (D) The percentage of apoptosis in MDA-MB-231 cells with knockdown of gene FUT1, FUT2, ST3Gal2, or β3GalT5 and vector control. The mean of apoptotic cells is from three experiments. Asterisks indicate statistical significance, P < 0.05; n.s., not significant.
To further investigate whether the apoptosis induced by β3GalT5 knockdown is associated with the activation of caspase-3, the most effector caspase for the downstream execution of apoptosis. Results showed that caspase-3 was activated in MDA-MB-231 cells with knockdown of β3GalT5 (Fig. 3E). When the inhibitor for caspase 3, Z-DEVD, was added, the percentage of apoptosis induced by β3GalT5 knockdown reduced (Fig. 3F). The involvement of caspase-3 in the apoptosis induced by β3GalT5 knockdown was also confirmed in MCF-7, a caspase-3–deficient cell line. Although the growth rate of MCF-7 was significantly reduced by knockdown of β3GalT5, only a low level of apoptosis was shown when the expression of SSEA-3 was suppressed (Fig. 4 B and C). Further investigation of the upstream caspases (caspase-8, -9, and -12) was then studied by testing with specific inhibitors, and the result illustrated that caspase-8 also reduced the percentage of cell apoptosis in MDA-MB-231 cells with β3GalT5 knockdown (Fig. 3G). These results suggest that SSEA-3, the immediate enzymatic product of β3GalT5, is an important glycolipid for growth and survival in cancer.
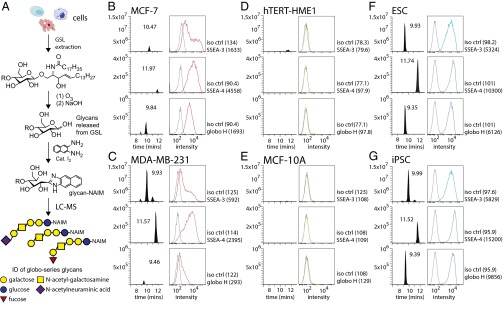
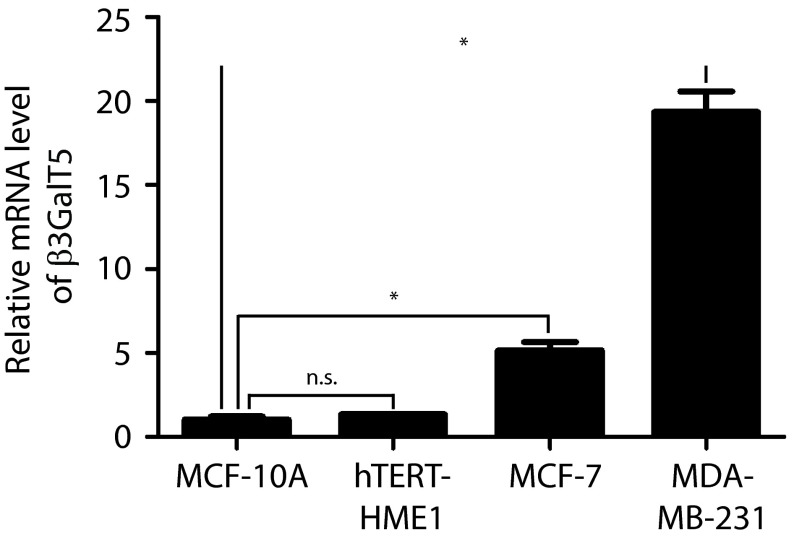
To confirm whether SSEA-3 or any of the three globo-series glycans was only found in cancer cells, the glycolipids from embryonic stem cells (ESCs), induced pluripotent stem cells (iPSCs, Fig. S4), MCF-7 and MDA-MB-231 cells, and normal cell lines, including MCF-10A and hTERT-HME1, were extracted and the glycans were released, tagged and examined by LC-MS analysis (Fig. 5A). The data were compared with the results of flow cytometric analysis, in which same antibodies used for cell sorting were used to detect the expression levels of SSEA-3, SSEA-4, and globo-H (Fig. 5). It was found that ESCs, iPSCs, and cancer cell lines but not normal cell lines expressed SSEA-3, SSEA-4, and globo-H. The result from this study was also supported by quantitative RT-PCR (qPCR) of β3GalT5 gene expression in normal and cancer cell lines (Fig. S5).
Fig. S4.
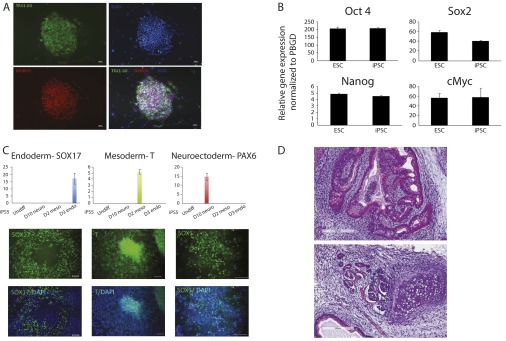
The characterization of iPSC5. (A) Immunofluorescent staining of stem cell proteins TRA1-60 and Nanog. Nuclei were stained with DAPI. (B) qPCR of stem genes OCT4, SOX2, NANOG, and c-Myc. (C) In vitro differentiation capability of iPSC5 to three germ-layer lineages. (D) H&E staining of iPSC5 to three germ-layer lineages in teratoma.
Fig. 5.
The comparison of the abundance of globo-series epitopes in cell lines by flow cytometry and mass spectrometry. (A) The scheme of extraction of glycan from glycolipid on cells for fluorescent labeling and LC-MS analysis. (B–G) The relative abundance of globo-series epitopes SSEA-3, SSEA-4, and globo-H in breast cancer cell lines MCF-7 and MDA-MB-231, normal cell lines hTERT-HME1 and MCF-10A, ESCs, as well as iPSCs was detected by FACS and mass spectrometry. For figures of flow cytometry, histograms of cells stained with anti-glycan antibodies (in red, blue or green) and their corresponding antibody isotype controls (in gray) were shown. Geometric mean of fluorescence was shown in the bracket. For MS, the mass chromatograms of m/z for glycans (SSEA-3 = 1008.3667; SSEA-4 = 1299.4621; and globo-H = 1154.4246) are shown in graphs.
Fig. S5.
The mRNA level of β3GalT5 in breast cancer cell culture is higher than that of normal cell culture. GAPDH-normalized qPCR level of β3GalT5 gene in normal cell culture MCF-10A and hTERT-HME1, as well as in breast cancer cell culture MCF-7 and MDA-MB-231. Triplicated samples from one representative experiment are shown. Data represent the mean and SD. Asterisks indicate statistical significance, P < 0.05; n.s., not significant.
The expression level of SSEA-3 in MCF-7 cells detected by flow cytometry was relatively higher than that by the LC-MS analysis, whereas the level of SSEA-3 in MDA-MB-231 detected by LC-MS was much higher than that by flow cytometry. The variation between the LC-MS and flow cytometry data could be due to the specificity of antibody and the distribution of the glycans on the cell surface (25). Due to the cross-reaction of anti–SSEA-3 antibody (MC-631) toward SSEA-4 and to a lesser extent, Gb4 (14), it is possible to overestimate the level of SSEA-3 detected by flow cytometry when there is a high expression level of SSEA-4. On the other hand, the level of SSEA-3 could be underestimated because of hindrance caused by other biomolecules on cell surface and thus SSEA-3 on the cells may not be reached in antibody staining (26, 27). Therefore, we believe that the LC-MS result, which is supported by the qPCR detection of β3GalT5 gene expression (Fig. S5), more accurately reflects the expression of these glycolipids.
In the process of BCSC isolation, it is possible that some cells with a high level of SSEA-4 expression but carry no SSEA-3 are enriched when sorted based on MC-631 staining. Because we proved that both SSEA-3 and its synthetic enzyme β3GalT5 are BCSCs markers, SSEA-3 negative cells are low tumorigenic. The cell population is not purified enough and thus the tumorigenicity of the cells sorted based on anti–SSEA-3 staining may be underestimated. We suggest that an antibody or molecule, which is highly specific to SSEA-3, should be generated for the enrichment of BCSC. On the other hand, if SSEA-3 on the cell surface can be specifically detected and sorted by flow cytometry, the results of both antibody staining and LC-MS analysis should be consistent.
It appears that SSEA-3 is a BCSC maer both apoptosis and inhibition of cell proliferation through different mechanisms, as MCF-7, a caspase-3 null cell line, underwent a limited level of apoptosis and profound suppression of cell growth after knockdown of β3GalT5. In contrast, in normal mammary epithelial cells, which lack SSEA-3 expression, knockdown of β3GalT5 did not affect these phenotypes.
In summary, this study reveals that SSEA-3 is a previously unidentified glycan marker useful for the enrichment of BCSCs, and both SSEA-3 and β3GalT5 are potential new targets for the development of breast cancer therapeutics. In addition to their specific expression on most CSCs and cancer cells, the globo-series glycolipids SSEA-3, SSEA-4, and globo-H are also highly expressed on the surface of ESCs and iPSCs, but they disappear after differentiation of ESCs. It would be interesting to understand the fate of the globo-series glycolipids after differentiation of iPSCs for use in regenerative medicine. Nevertheless, it appears that, unlike other tumor-associated glycolipids, these three globo-series glycans are cancer specific and could be considered as nonself epitopes for vaccine development. These findings are further supported by the study of antibodies designed to target the globo-series glycans (13–18), and by the development of globo-H cancer vaccines (19), especially the one in the late-stage clinical trials for the treatment of metastatic breast cancer (28).
Materials and Methods
Cell Culture.
Breast cancer cell lines MDA-MB-231, MCF-7, and human breast cancer associated fibroblast (CAF) were obtained from American Type Culture Collection (ATCC). The culture of MDA-MB-231 was in DMEM supplemented with 10% (vol/vol) heat-inactivated FBS and antibiotic–antimycotic whereas that of MCF-7 culture was in RPMI supplemented with 10% (vol/vol) heat-inactivated FBS, nonessential amino acids and antibiotic-antimycotic. For the culture of CAF, it was in DMEM/F12 supplemented with 10% (vol/vol) heat-inactivated FBS, nonessential amino acids, sodium pyruvate, glutamine, penicillin, and streptomycin. They were incubated at 37 °C incubator with 5% (vol/vol) CO2 and humidified atmosphere control. All of the cell culture media and supplements were purchased from Life Technologies. Human ESC H9 and iPSC5 were maintained and cultured on mitomycin C treated-mouse embryonic fibroblasts (MEFs) in human ES medium (Knockout DMEM with Knockout Serum Replacement, GlutaMAX, nonessential amino acids, 2-Mercaptoethanol, Penicillin/Streptomycin and bFGF) and were passaged weekly using collagenase IV.
Derivation of iPSCs from Dermal Fibroblasts.
Fibroblasts derived from dermal biopsies were reprogrammed into pluripotent stem cells using the CytoTune-iPS Sendai Reprogramming Kit (Life Technologies). Briefly, 5 × 10⁴ fibroblasts were seeded per well in a six-well dish at passage 3 for recovery overnight. The next day, Sendai viruses expressing human transcription factors OCT4, SOX2, Klf4, and c-Myc were mixed in fibroblast medium to infect fibroblast cells according to the manufacturer’s instructions. After 2 d, the medium was exchanged with human ES medium supplemented with the ALK5 inhibitor SB431542 (2 μM; Stemgent), the MEK inhibitor PD0325901 (0.5 μM; Stemgent), and thiazovivin (0.5 μM; Stemgent). Day 7–10 after infection, cells were detached using TrypLE (Life Technologies) and passaged onto feeder cells. Individual colonies of iPSCs were picked between days 21 and 28 after infection, and each iPSC line was expanded from a single colony. All iPSCs lines were cultured on mouse embryonic fibroblast cells in human ES medium.
Karyotyping was performed by Cell Line Genetics. In teratoma analysis, 1–2 × 10⁷ from each iPSC line were detached and collected after TrypLE treatment. They were suspended in 0.5 mL of human ES media. Followed by mixing with 0.5 mL Matrigel (BD Biosciences), cells were injected s.c. into dorsal flanks of an immunodeficient mouse (NOD.Cg-Prkdcscid Il2rgtm1Wjl/SzJ, stock no. 005557, The Jackson Laboratory). Eight weeks after injection, teratomas were harvested, fixed overnight with 4% (vol/vol) paraformaldehyde, and processed according to standard procedures for paraffin embedding. The samples were then sectioned and H&E stained.
Flow Cytometry and Cell Sorting.
Cell labeling was done by staining with antibodies in buffer composed of PBS supplemented with 1% FBS. Accutase (eBioscience) detached cells were incubated with antibodies (using antibody titration suggested by the supplier) for 30 min on ice in the dark. Antibodies used in this study were PE-conjugated anti-PROCR (RCR-252; BD Biosciences), APC-conjugated anti-ESA (1B7; eBioscience), PE-conjugated anti-CD24 (SN3 A5-2H10; eBioscience), APC-conjugated anti-CD44 (IM-7; eBioscience), along with biotinylated anti–SSEA-3 (MC-631; eBioscience) at 4 °C for 30 min in the dark. After washing twice, the cells were stained with Alexa Fluor 488-conjugated streptavidin at 4 °C for 30 min in the dark. Proper isotype controls were used for each cell labeling experiment. The same antibodies were used in all staining and sorting experiments in this study. Live cell sorting was done using a BD FACSAriaU with a 100-μm nozzle following the manufacturer’s instructions. For MDA-MB-231 cells, the sorted cells were incubated with DMEM/10% (vol/vol) FBS/antibiotics/antimycotics to recover in ultra-low attachment surface plates overnight in a humidified 37 °C incubator before further analyses. For MCF-7 cells, they were subject to further experiments readily after sorting (Fig. S1). The percentage of cells in different marker populations was evaluated using the software FlowJo.
Soft Agar Assay.
Soft agar colony formation assay was performed by seeding cells in a layer of 0.35% SeaPlaque agarose with DMEM/FBS over a basal layer of 0.5% SeaPlaque agarose/DMEM/FBS. Cultures were maintained in a humidified 37 °C incubator. Additional media was added every 2–3 d to continuously supply growth supplements to the cells. On day 21 after seeding, cells were fixed with pure ethanol containing 0.05% crystal violet and colony forming efficiency quantified by light microscopy.
Mammosphere Formation.
In the mammosphere formation assay, cells were incubated in DMEM/F12 with supplement B27 (Life Technologies) and 10 ng/mL EGF on 96-well low-attachment plates in the density of 100 cells per well. Culture was maintained in a humidified 37 °C incubator. After 14 d, the number of mammospheres was counted under a light microscope.
Mouse Tumorigenicity Assay.
NOD-SCID (NS) mice were used to evaluate the stem cell properties of sorted cells expressing potential stem cell markers from the human breast cancer cell lines. Animal care and experiments were approved by the Institutional Animal Care and Utilization Committee of Academia Sinica (IACUC 130-09-575). Four-week-old NS mice were injected with sorted cancer cells mixed with CAF (1:1) and Matrigel (BD Biosciences) (1:1) in fat pads. For MCF-7, mice were additionally injected with estrogen pellets (0.18 mg per pellet, 90-d release; Innovative Research of America) before the day of experiment. Tumor volumes were evaluated every 5 d after initial detection. The tumor formation efficiency was determined on day 50 after cell injection.
Overexpression and Knockdown of β3GalT5.
To establish human β3GalT5 overexpression stable lines, full-length cDNA that encodes human β3GalT5 was PCR amplified (forward primer, GCAGATCTATGGCTTTCCCGAAGATG; reverse primer, GTCTCGAGTCAGACA GGCGGACAAT), and subcloned into BglII/XhoI cut pMSCVpuro vector (Clontech). Murine stem cell virus (MSCV)-control and MSCV- β3GalT5 vesicular stomatitis virus G glycoprotein (VSV-G) pseudotyped retrovirus were then generated in GP2-293 cells (Clontech) and used to infect MCF-7 and MDA-MB-231 cells. Two days after viral infection, control and β3GalT5 stable pools were selected with puromycin (2 μg/mL). To establish β3GalT5 knockdown cells, the lentivirus-shRNA systems for human β3GalT5 were purchased from National RNAi Core Facility Platform, Academia Sinica, and the β3GalT5-short hairpin sequence is 5′-CCGGGCAAGTGGTTTGTCAGTAAATCTCGAGATTTACTGACAAACCACTTGCTTTTTG-3′. Briefly, shβ3GalT5 and shControl lentiviruses were incubated with MCF7 and MDA-MB-231 cells according to the manufacturer’s instructions. Infected cells were harvested 48 h postinfection or selected with puromycin (2 μg/mL) and the knockdown efficiency was determined by qPCR.
SI Materials and Methods
Cell Culture.
Breast cancer cell lines MDA-MB-231, MCF-7, and human breast cancer associated fibroblast (CAF) were obtained from American Type Culture Collection (ATCC). The culture of MDA-MB-231 was in DMEM supplemented with 10% heat-inactivated FBS and antibiotic-antimycotic whereas that of MCF-7 culture was in RPMI supplemented with 10% heat-inactivated FBS, nonessential amino acids and antibiotic–antimycotic. For the culture of CAF, it was in DMEM/F12 supplemented with 10% heat-inactivated FBS, nonessential amino acids, sodium pyruvate, glutamine, penicillin, and streptomycin. They were incubated at 37 °C incubator with 5% CO2 and humidified atmosphere control. All of the cell culture media and supplements were purchased from Life Technologies. Human ESC H9 and iPSC5 were maintained and cultured on mitomycin C treated-mouse embryonic fibroblasts (MEFs) in human ES medium (Knockout DMEM with Knockout Serum Replacement, GlutaMAX, nonessential amino acids, 2-Mercaptoethanol, Penicillin/Streptomycin, and bFGF) and were passaged weekly using collagenase IV.
Derivation of iPSCs from Dermal Fibroblasts.
Fibroblasts derived from dermal biopsies were reprogrammed into pluripotent stem cells using the CytoTune-iPS Sendai Reprogramming Kit (Life Technologies). Briefly, 5 × 10⁴ fibroblasts were seeded per well in a six-well dish at passage 3 for recovery overnight. The next day, Sendai viruses expressing human transcription factors OCT4, SOX2, Klf4, and c-Myc were mixed in fibroblast medium to infect fibroblast cells according to the manufacturer’s instructions. After 2 d, the medium was exchanged with human ES medium supplemented with the ALK5 inhibitor SB431542 (2 μM; Stemgent), the MEK inhibitor PD0325901 (0.5 μM; Stemgent), and thiazovivin (0.5 μM; Stemgent). Day 7–10 after infection, cells were detached using TrypLE (Life Technologies) and passaged onto feeder cells. Individual colonies of iPSCs were picked between days 21 and 28 after infection, and each iPSC line was expanded from a single colony. All iPSCs lines were cultured on mouse embryonic fibroblast cells in human ES medium.
Karyotyping was performed by Cell Line Genetics. In teratoma analysis, 1–2 × 10⁷ from each iPSC line were detached and collected after TrypLE treatment. They were suspended in 0.5 mL human ES media. Followed by mixing with 0.5 mL Matrigel (BD Biosciences), cells were injected s.c. into dorsal flanks of an immunodeficient mouse (NOD.Cg-Prkdcscid Il2rgtm1Wjl/SzJ, stock no. 005557, The Jackson Laboratory). Eight weeks after injection, teratomas were harvested, fixed overnight with 4% paraformaldehyde, and processed according to standard procedures for paraffin embedding. The samples were then sectioned and H&E stained.
Cell Proliferation Assay.
Cell proliferation was analyzed using a cell permeable tetrazolium salt, WST-1 (4-[3-(4-iodophenyl)-2-(4-nitrophenyl)-2H-5-tetrazolio]- 1,3-benzene disulfonate), according to the manufacturer’s instruction (Roche). A total of 2 × 10³ cells per well were cultured in 96-well plates. At different time points as indicated, WST-1 (20 μL per well for 200 μL culture medium) was added and incubated for 3 h at 37 °C incubator. Signaling detection of absorbance at 450 nm and 690 nm (as reference) were read by a SpectraMax M5 microplate spectrum reader (Molecular Devices).
Apoptosis Assay.
Cells were treated with or without β3GalT5 shRNA lentivirus (multiplicity of infection: 5), Z-DEVD-FMK (caspase-3 inhibitor) (50 μM and 100 μM; R&D Systems), Z-IETD-FMK (caspase-8 inhibitor), Z-LEHD-FMK (caspase-9 inhibitor), or Z-ATAD-FMK (caspase-12 inhibitor) (100 μM; R&D Systems) at 105 cells per mL as described. Three days later, cells were washed with PBS and incubated with allophycocyanin (APC)-conjugated annexin V (1:40 dilution; BD Biosciences) in binding buffer (0.01 M Hepes, 0.14 M NaCl, 2.5 mM CaCl2) for 15 min on ice and then subjected to flow cytometric analysis.
Western Blot Analysis.
Protein lysates of MCF-7 and MDA-MB-231 cells were prepared using lysis buffer (150 mM NaCl2, 100 mM phosphate buffer at pH 7.4, 1% Nonidet P-40, 10% glycerol) supplied with protease inhibitors (Roche). The proteins from cell lysate were denatured in sample buffer at 95 °C for 5 min before being applied to 4−12% gradient SDS/PAGE and were transferred onto methanol-rinsed PVDF membranes using transfer device (Bio-Rad). Membrane was blocked with 5% nonfat milk-supplied TBST for 30 min before probing with the anti–caspase-3 antibody that recognizes either procaspase-3 or cleaved/active form of caspase-3 (1:1,000 dilution; Abcam), followed by incubation with HRP-conjugated anti-rabbit antibody (1:5,000 dilution; Jackson ImmunoResearch) for 90 min. The signals were developed using the ECL Substrate kit (Millipore) and detected by Fujifilm LAS-4000 imaging system.
qPCR.
Total mRNA from cell lines was extracted using GeneJET RNA Purification kit (Thermo Scientific) and 2 μg of it was reverse transcribed to cDNA by High Capacity cDNA Reverse Transcription kits (Life Technologies). qPCR reactions were prepared in a total volume of 20 μL containing 2 μL of cDNA of the test sample or control sample with 2× SYBR Green master mix (Thermo Scientific) optimized by the manufacturer’s protocol. cDNA was examined for the expression of B3GalT5 (forward primer: 5′-AGCGGA AACGAA AGAGGTGGAC-3′; reverse primer: 5′-CCTGAGGACAAA AGCGATGGAC-3′) by Applied Biosystems 7300 Real-Time PCR system (Life Technologies). The relative gene expression was normalized as the ratio of the B3GalT5 gene to the internal GAPDH gene expression according to the Ct values using 7300 software.
Extraction of Glycosphingolipids.
Cells were harvested, washed with PBS, and homogenized in water. Methanol and chloroform were added to the homogenate at a ratio of 8:4:3 (vol/vol/vol), and the sample was incubated in a bath sonicator for 30 min. After centrifugation at 3,000 × g for 15 min, the pellet was repeatedly extracted with 4:8:3 (vol/vol/vol) chloroform/methanol/water, and the combined supernatant was dried under a stream of nitrogen.
Release of Glycans from Glycosphingolipids (GSLs) (26).
Cell were collected and quantified for the amount of total protein for normalization, and 1–3 × 10⁶ cells were homogenized. In a typical procedure for the release of free glycans from GSLs, the GSLs were treated with ozone in chloroform/methanol (2:1; 1.0 mg/mL) in a glass tube until blue color occurs (10 min). The resulting solution was dried in a SpeedVac and treated by base for release of glycans from GSLs; briefly, aqueous sodium hydroxide solution (20–50 mM) was added, and the mixture was incubated for 16 h at room temperature. The resulting aqueous solution is lyophilized for labeling with NAIM tag.
Labeling Glycans with NAIM Tag and LC-MS Analysis.
After release from GSLs, the glycan mixture was lyophilized and labeled by following literature procedures (27, 28). Briefly, the glycan was mixed with 2,3-naphthalenediamine (NAIM, 1.0 mg) and iodine (1.0 mg) in AcOH (1.0 mL) at room temperature and stirred for 4 h. The completion of reaction was checked by TLC analysis. The reaction mixture was then triturated with EtOAc (10.0 mL × 2) to give precipitates (globo-H-NAIM, SSEA-4-NAIM, and SSEA-3-NAIM), which were collected by filtration using nylon membrane filter. The NAIM-labeled glycans, which showed enhanced ionization ability in MS (29), were analyzed by high resolution and high mass accuracy nanoflow LC-MS/MS. Samples were injected at 10 μL/min into a precolumn (150 µm i.d. × 30 mm, 5 µm, 200 Å) and then separated in a reversed phase C18 nano-column (75 µm i.d. × 200 mm, 2.5 µm, 100 Å) for analysis in an LTQ FT Ultra mass spectrometer (Thermo Fisher Scientific) was equipped with a nanoelectrospry ion source (New Objective). Separation was performed at 300 nL/min using 0.1% formic acid in water as mobile phase A and 0.1% formic acid in 80% acetonitrile as mobile phase B. Survey full scan MS spectra (from m/z 320–2,000) were acquired in the FT with a mass resolution of 100,000 at m/z 400.
Acknowledgments
We thank Mr. T.-C. Lai and Mr. Y.-C. Chang for technical assistance of animal study and Ms. W.-T. Hung, Ms. Y.-T. Chen, Mr. C.-H. Chen, and the Mass Spectrometry Core Facility at the Genomics Research Center, Academia Sinica for glycolipid analysis. This research was supported by Academia Sinica, Taiwan.
Footnotes
The authors declare no conflict of interest.
See Commentary on page 815.
This article contains supporting information online at www.pnas.org/lookup/suppl/doi:10.1073/pnas.1522602113/-/DCSupplemental.
References
- 1.Beck B, Blanpain C. Unravelling cancer stem cell potential. Nat Rev Cancer. 2013;13(10):727–738. doi: 10.1038/nrc3597. [DOI] [PubMed] [Google Scholar]
- 2.Bomken S, Fiser K, Heidenreich O, Vormoor J. Understanding the cancer stem cell. Br J Cancer. 2010;103(4):439–445. doi: 10.1038/sj.bjc.6605821. [DOI] [PMC free article] [PubMed] [Google Scholar]
- 3.Clarke MF, et al. Cancer stem cells--perspectives on current status and future directions: AACR Workshop on cancer stem cells. Cancer Res. 2006;66(19):9339–9344. doi: 10.1158/0008-5472.CAN-06-3126. [DOI] [PubMed] [Google Scholar]
- 4.Jordan CT, Guzman ML, Noble M. Cancer stem cells. N Engl J Med. 2006;355(12):1253–1261. doi: 10.1056/NEJMra061808. [DOI] [PubMed] [Google Scholar]
- 5.Pece S, et al. Biological and molecular heterogeneity of breast cancers correlates with their cancer stem cell content. Cell. 2010;140(1):62–73. doi: 10.1016/j.cell.2009.12.007. [DOI] [PubMed] [Google Scholar]
- 6.Al-Hajj M, Wicha MS, Benito-Hernandez A, Morrison SJ, Clarke MF. Prospective identification of tumorigenic breast cancer cells. Proc Natl Acad Sci USA. 2003;100(7):3983–3988. doi: 10.1073/pnas.0530291100. [DOI] [PMC free article] [PubMed] [Google Scholar]
- 7.Ginestier C, et al. ALDH1 is a marker of normal and malignant human mammary stem cells and a predictor of poor clinical outcome. Cell Stem Cell. 2007;1(5):555–567. doi: 10.1016/j.stem.2007.08.014. [DOI] [PMC free article] [PubMed] [Google Scholar]
- 8.Hwang-Verslues WW, et al. Multiple lineages of human breast cancer stem/progenitor cells identified by profiling with stem cell markers. PLoS One. 2009;4(12):e8377. doi: 10.1371/journal.pone.0008377. [DOI] [PMC free article] [PubMed] [Google Scholar]
- 9.Wright MH, et al. Brca1 breast tumors contain distinct CD44+/CD24- and CD133+ cells with cancer stem cell characteristics. Breast Cancer Res. 2008;10(1):R10. doi: 10.1186/bcr1855. [DOI] [PMC free article] [PubMed] [Google Scholar]
- 10.Fuster MM, Esko JD. The sweet and sour of cancer: Glycans as novel therapeutic targets. Nat Rev Cancer. 2005;5(7):526–542. doi: 10.1038/nrc1649. [DOI] [PubMed] [Google Scholar]
- 11.de Leoz ML, et al. High-mannose glycans are elevated during breast cancer progression. Mol Cell Proteomics. 2011;10(1):M110.002717. doi: 10.1074/mcp.M110.002717. [DOI] [PMC free article] [PubMed] [Google Scholar]
- 12.Lau KS, Dennis JW. N-glycans in cancer progression. Glycobiology. 2008;18(10):750–760. doi: 10.1093/glycob/cwn071. [DOI] [PubMed] [Google Scholar]
- 13.Hakomori S, Young WW. Tumor-associated glycolipid antigens and modified blood group antigens. Scand J Immunol. 1978;7:97–117. [Google Scholar]
- 14.Kannagi R, et al. Stage-specific embryonic antigens (SSEA-3 and -4) are epitopes of a unique globo-series ganglioside isolated from human teratocarcinoma cells. EMBO J. 1983;2(12):2355–2361. doi: 10.1002/j.1460-2075.1983.tb01746.x. [DOI] [PMC free article] [PubMed] [Google Scholar]
- 15.Hakomori S. Aberrant glycosylation in cancer cell membranes as focused on glycolipids: Overview and perspectives. Cancer Res. 1985;45(6):2405–2414. [PubMed] [Google Scholar]
- 16.Chang WW, et al. Expression of Globo H and SSEA3 in breast cancer stem cells and the involvement of fucosyl transferases 1 and 2 in Globo H synthesis. Proc Natl Acad Sci USA. 2008;105(33):11667–11672. doi: 10.1073/pnas.0804979105. [DOI] [PMC free article] [PubMed] [Google Scholar]
- 17.Lou YW, et al. Stage-specific embryonic antigen-4 as a potential therapeutic target in glioblastoma multiforme and other cancers. Proc Natl Acad Sci USA. 2014;111(7):2482–2487. doi: 10.1073/pnas.1400283111. [DOI] [PMC free article] [PubMed] [Google Scholar]
- 18.Wang CC, et al. Glycan microarray of Globo H and related structures for quantitative analysis of breast cancer. Proc Natl Acad Sci USA. 2008;105(33):11661–11666. doi: 10.1073/pnas.0804923105. [DOI] [PMC free article] [PubMed] [Google Scholar]
- 19.Huang YL, et al. Carbohydrate-based vaccines with a glycolipid adjuvant for breast cancer. Proc Natl Acad Sci USA. 2013;110(7):2517–2522. doi: 10.1073/pnas.1222649110. [DOI] [PMC free article] [PubMed] [Google Scholar]
- 20.Zhou D, Henion TR, Jungalwala FB, Berger EG, Hennet T. The beta 1,3-galactosyltransferase beta 3GalT-V is a stage-specific embryonic antigen-3 (SSEA-3) synthase. J Biol Chem. 2000;275(30):22631–22634. doi: 10.1074/jbc.C000263200. [DOI] [PubMed] [Google Scholar]
- 21.Rajan VP, Larsen RD, Ajmera S, Ernst LK, Lowe JB. A cloned human DNA restriction fragment determines expression of a GDP-L-fucose: Beta-D-galactoside 2-alpha-L-fucosyltransferase in transfected cells. Evidence for isolation and transfer of the human H blood group locus. J Biol Chem. 1989;264(19):11158–11167. [PubMed] [Google Scholar]
- 22.Rouquier S, et al. Molecular cloning of a human genomic region containing the H blood group alpha(1,2)fucosyltransferase gene and two H locus-related DNA restriction fragments. Isolation of a candidate for the human Secretor blood group locus. J Biol Chem. 1995;270(9):4632–4639. doi: 10.1074/jbc.270.9.4632. [DOI] [PubMed] [Google Scholar]
- 23.Saito S, et al. Human alpha2,3-sialyltransferase (ST3Gal II) is a stage-specific embryonic antigen-4 synthase. J Biol Chem. 2003;278(29):26474–26479. doi: 10.1074/jbc.M213223200. [DOI] [PubMed] [Google Scholar]
- 24.Shaw FL, et al. A detailed mammosphere assay protocol for the quantification of breast stem cell activity. J Mammary Gland Biol Neoplasia. 2012;17(2):111–117. doi: 10.1007/s10911-012-9255-3. [DOI] [PubMed] [Google Scholar]
- 25.Liang C-H, et al. Effects of neighboring glycans on antibody-carbohydrate interaction. Angew Chem Int Ed Engl. 2011;50(7):1608–1612. doi: 10.1002/anie.201003482. [DOI] [PubMed] [Google Scholar]
- 26.Lingwood D, et al. Cholesterol modulates glycolipid conformation and receptor activity. Nat Chem Biol. 2011;7(5):260–262. doi: 10.1038/nchembio.551. [DOI] [PubMed] [Google Scholar]
- 27.Novak A, et al. Cholesterol masks membrane glycosphingolipid tumor-associated antigens to reduce their immunodetection in human cancer biopsies. Glycobiology. 2013;23(11):1230–1239. doi: 10.1093/glycob/cwt059. [DOI] [PubMed] [Google Scholar]
- 28.Danishefsky SJ, Shue YK, Chang MN, Wong CH. Development of Globo-H cancer vaccine. Acc Chem Res. 2015;48(3):643–652. doi: 10.1021/ar5004187. [DOI] [PubMed] [Google Scholar]


