Significance
People of recent African ancestry develop chronic kidney disease and end stage kidney failure at rates five times that of European-Americans. Two coding variants in the apolipoprotein-L1 (APOL1) gene account for nearly all this excess risk. The mechanisms by which APOL1 variants cause kidney failure are not understood. Recent evidence suggests that APOL1 transports cations, including K+, across lipid bilayers. Here, we show that tetracycline-induced expression of APOL1 kidney risk variants in T-REx-293 cells causes significant net efflux of intracellular K+, which, in turn, activates the stress-activated protein kinases (SAPKs) p38 MAPK and JNK, ultimately resulting in cytotoxicity. We propose that APOL1 nephropathy may be mediated by APOL1 risk variant-induced loss of intracellular K+ and aberrant activation of SAPK signaling.
Keywords: apolipoprotein L1, kidney, African-American, genetics, protein kinase
Abstract
Two specific genetic variants of the apolipoprotein L1 (APOL1) gene are responsible for the high rate of kidney disease in people of recent African ancestry. Expression in cultured cells of these APOL1 risk variants, commonly referred to as G1 and G2, results in significant cytotoxicity. The underlying mechanism of this cytotoxicity is poorly understood. We hypothesized that this cytotoxicity is mediated by APOL1 risk variant-induced dysregulation of intracellular signaling relevant for cell survival. To test this hypothesis, we conditionally expressed WT human APOL1 (G0), the APOL1 G1 variant, or the APOL1 G2 variant in human embryonic kidney cells (T-REx-293) using a tetracycline-mediated (Tet-On) system. We found that expression of either G1 or G2 APOL1 variants increased apparent cell swelling and cell death compared with G0-expressing cells. These manifestations of cytotoxicity were preceded by G1 or G2 APOL1-induced net efflux of intracellular potassium as measured by X-ray fluorescence, resulting in the activation of stress-activated protein kinases (SAPKs), p38 MAPK, and JNK. Prevention of net K+ efflux inhibited activation of these SAPKs by APOL1 G1 or G2. Furthermore, inhibition of SAPK signaling and inhibition of net K+ efflux abrogated cytotoxicity associated with expression of APOL1 risk variants. These findings in cell culture raise the possibility that nephrotoxicity of APOL1 risk variants may be mediated by APOL1 risk variant-induced net loss of intracellular K+ and subsequent induction of stress-activated protein kinase pathways.
The incidence of end stage kidney disease (ESRD) among people of recent Africa ancestry is five times higher than that in Americans of European origin. This excess risk is attributable largely to two coding variants in the APOL1 gene that encodes apolipoprotein L1, a component of HDL (1–3). These variants consist of a pair of amino acid alterations, a serine-to-glycine substitution at position 342 and an Ile-to-Met substitution at position 384 (referred to as G1), and a deletion of two amino acids, Asp at position 388 and Tyr at position 389 (called G2) (1). Heterozygosity for G1 or G2 confers the evolutionary benefit of protection against Trypanosoma brucei rhodesiense infection. The price of this protection is an increased risk of kidney disease in those homozygous or compound heterozygous for G1 and/or G2. People of recent African ancestry with two copies of risk variant APOL1 not only have a higher risk of a wide spectrum of glomerular disorders [HIV-associated nephropathy (HIVAN), focal segmental glomerulosclerosis (FSGS), and lupus nephritis] (1, 4, 5), but also have more rapid progression of kidney impairment to ESRD, compared with blacks with zero or one copy of G1 or G2 (6–8).
The frequency of G1 and G2 among Africans and African-Americans is high. In the United States, 13% of African-Americans have two APOL1 risk variants whereas close to 50% of African-Americans on dialysis have two APOL1 risk variants (1, 9). In sub-Saharan West Africa, where these polymorphisms arose under selective pressure about 5–10,000 y ago (10), nearly one-third of Yoruba and a quarter of Ibo have two copies of these alleles (11). These variants represent a rare example of common genetic variants conferring high risk of a serious human disease (10).
The mechanisms by which the APOL1 risk variants lead to kidney disease and accelerate its progression are currently unclear. Because only humans and few higher primates express APOL1, it is difficult to make inferences based on other organisms. In vitro expression of APOL1 results in cytotoxicity that is significantly higher in the presence of G1 or G2 APOL1 than of G0 (12–15). Overexpression of G1 or G2 APOL1 in podocytes, hepatic cells, and HEK cells increased cell death associated with necrosis, pyroptosis, autophagy, and apoptosis (12, 13, 16). Similar toxicity was also seen in Xenopus laevis oocytes (15). However, the changes in intracellular signaling pathways that underlie the cell death induced by APOL1 risk variants remain unknown.
In planar lipid bilayers, APOL1 forms pH-gated cation-selective pores that are permeable to Na+ and K+ (15, 17, 18). Bacteria pore-forming toxins that similarly transport K+ across mammalian plasma membrane cause activation of mitogen-activated protein kinase signaling pathways, caspase-1 activation, and increased autophagy, ultimately resulting in cell death (19–23). It is unknown whether APOL1 also forms cation pores in mammalian plasma membrane and whether cation transport by such pores dysregulates cellular signaling pathways that may contribute to cytotoxicity of APOL1 variants and pathogenesis of APOL1 nephropathy. In the present study, we investigated changes in cation transport using X-ray fluorescence and cell survival-related signaling pathways after expression of G0, G1, or G2 APOL1 in modified HEK293 cells. We found that G1 or G2 APOL1 cause significant efflux of intracellular K+, thereby triggering the activation of three canonical MAP kinases, including p38 MAPK and JNK, ultimately resulting in cell death.
Results
Generation and Characterization of APOL1 Stable Cell Lines.
We generated T-REx-293 stable cell lines that express Flag- and Myc-tagged full-length human G0, G1, or G2 APOL1 under the control of tetracycline (tet) (Fig. S1). The empty vector (EV) control cell line contained only the plasmid backbone. Adding 20 ng/mL tet induced comparable levels of G0, G1, or G2 proteins (Fig. 1A). Notably, G0, G1, and G2 APOL1 are all associated with the plasma membrane (see Fig. 4B). The absence of endogenous APOL1 protein in nontransfected 293 cells (Fig. 2B) is consistent with prior reports (14, 24).
Fig. S1.
Schematic representation of tetracycline-inducible APOL1 expression vector stably transfected into T-REx-293 cells. The * represents mutations that constitute G1 (S342 and I 384M) and G2 (deletion of N388 and Y389).
Fig. 1.
Tetracycline-induced comparable expression levels of G0, G1, and G2 APOL1 in T-REx-293 cells. Stably transfected T-REx-293 cells were treated with the indicated concentrations of tetracycline for 12 h. Immunoblot analyses of ApoL1 and GAPDH in the indicated stable APOL1–T-REx-293 cell lines were performed using anti-Flag or anti-GAPDH antibodies.
Fig. 4.
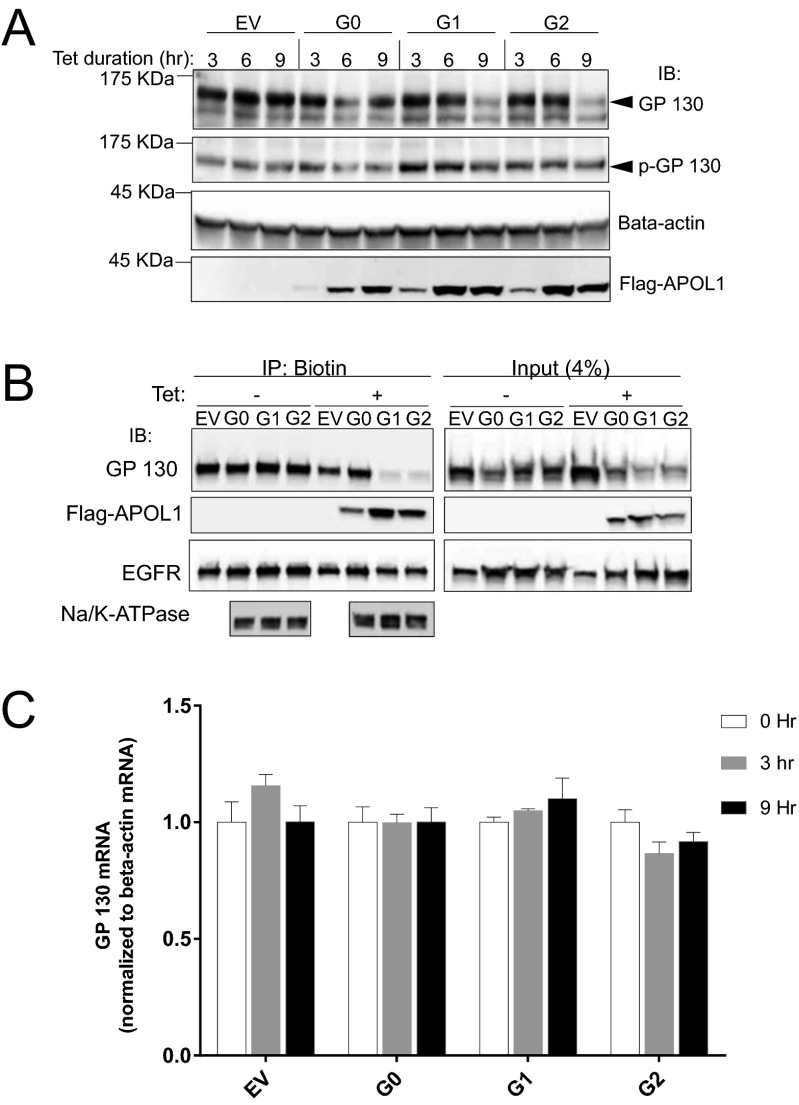
G1 or G2 APOL1 reduces GP130 protein but not mRNA level in T-REx-293 cells. (A) Immunoblot of GP130, p-GP130, beta-actin, and Flag-tagged G0, G1, and G2 APOL1 at the specified time points after induction with tet (50 ng/mL). (B) Immunoblot of GP130, Flag-tagged APOL1, EGFR, and Na+/K+-ATPase in biotin pull-down (biotinylated membrane proteins) and in total lysate (4%) after T-REx-293 cell induction with tet (50 ng/mL) for 9 h. (C) Quantitative PCR of GP130 and beta-actin after induction of T-REx-293 cells with tet (50 ng/mL) for the specified time periods.
Fig. 2.
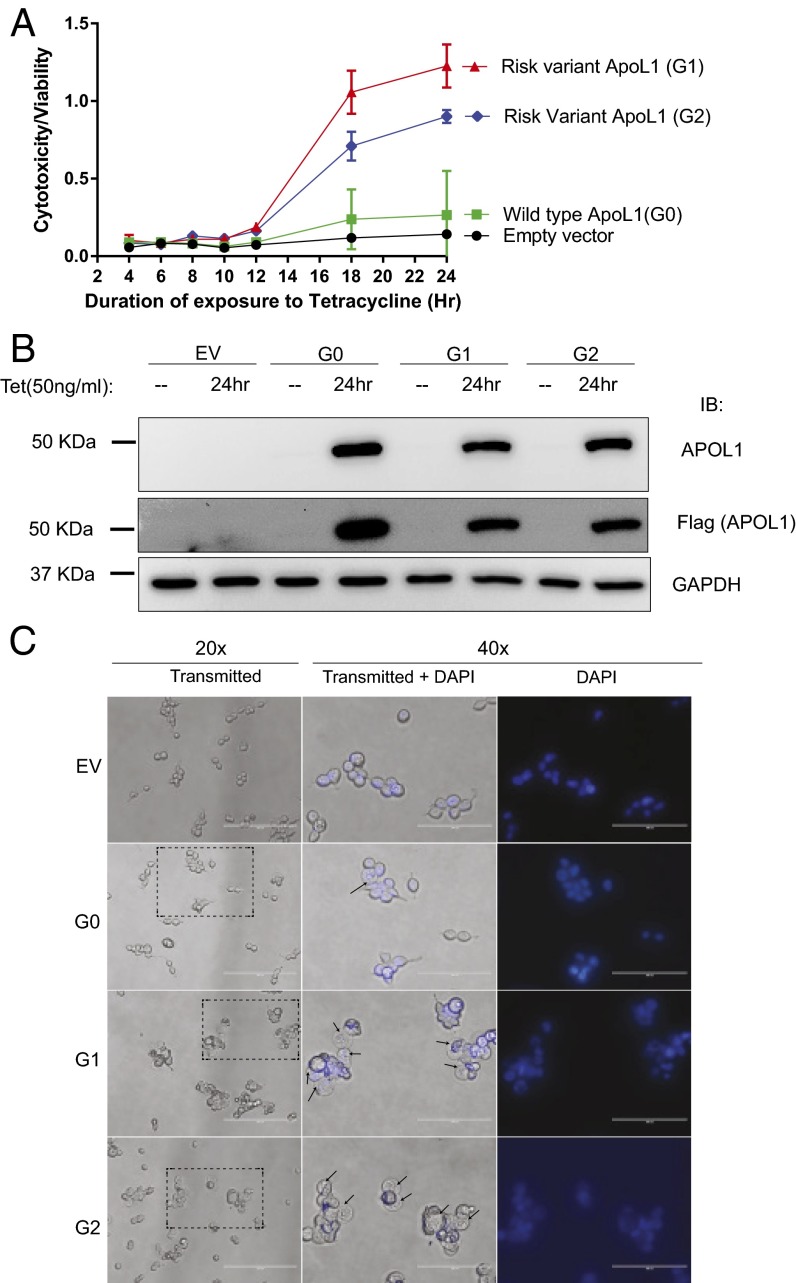
Expression of G1 or G2 APOL1 in T-REx-293 cells induces cytotoxicity and apparent cell swelling. (A) Quantitation of serial cytotoxicity:viability ratio of G0, G1, or G2 APOL1–T-REx-293 cells after induction with tetracycline (50 ng/mL) at time point zero. Each data point represents mean ± SD of three separate experiments. (B) Immunoblot of APOL1, Flag, and GAPDH 24 h after T-REx cells were tet-induced or not to express G0, G1, and G2 APOL1. (C) Representative phase contrast micrographs of transgenic T-REx-293 cells 9 h postinduction of G0, G1, and G2 APOL1. Nuclei were counterstained with Hoechst 33342. Arrows indicate swollen cytoplasm. The region of the 20× micrograph delineated by dotted rectangle is amplified at 40× magnification. More G1 or G2 APOL1-expressing cells exhibit swollen cytoplasm compared with G0-expressing cells. (Scale bars: 200 or 100 μm for 20× and 40×, respectively.)
Expression of APOL1 Risk Variants Increased Cytotoxicity and Apparent Cell Swelling.
Expression of G1 or G2 APOL1 resulted in increased cytotoxicity in a wide range of cell types (12–15). To compare the cytotoxicity of tet-inducible G1 and G2 APOL1 in T-REx-293 cells, we used a commercial cytotoxicity assay (Materials and Methods). The cytotoxicity/viability ratio increased significantly after 12 h of induced expression of APOL1 risk variants G1 and G2 (Fig. 2A). The elevated cytotoxicity of APOL1 G1 or G2 compared with G0 is not due to higher expression (Fig. 2B). Relative to EV, G0 expression was associated with only marginally increased cytotoxicity even after 24 h (Fig. 2A).
When APOL1 is overexpressed in different cell culture models, it commonly results in apparent cell swelling (13, 14). Although the exact mechanism underlying this cell swelling is unknown, the swelling is a hallmark of cytotoxicity. We observed that, after 9 h of induced expression of APOL1, apparent cell swelling is visible by light microscopy (Fig. 2C). The majority of G1- or G2-expressing T-REx-293 cells exhibit significantly swollen cytoplasm whereas only a few G0-expressing cells show this phenotype. The swollen cells have more refractile nuclear staining.
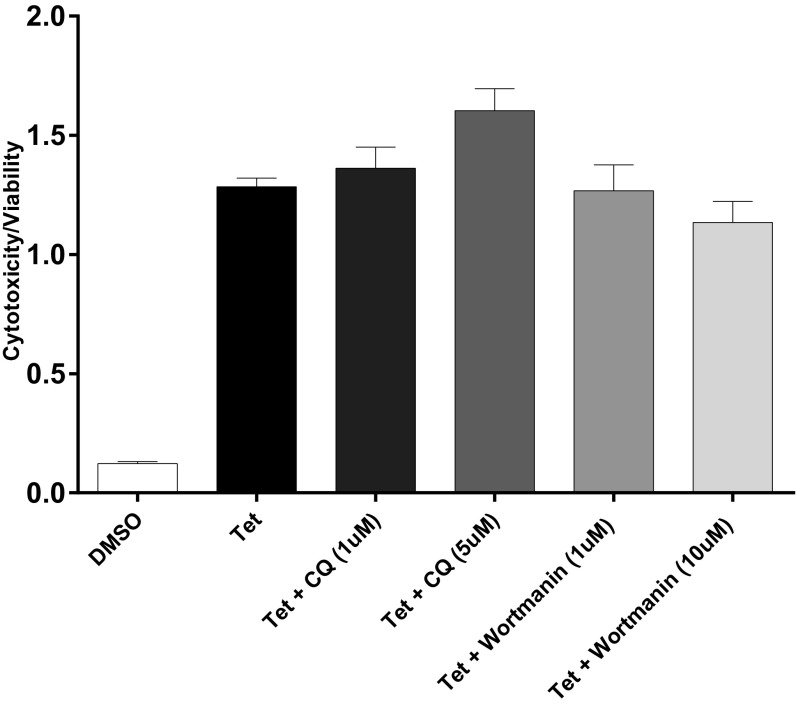
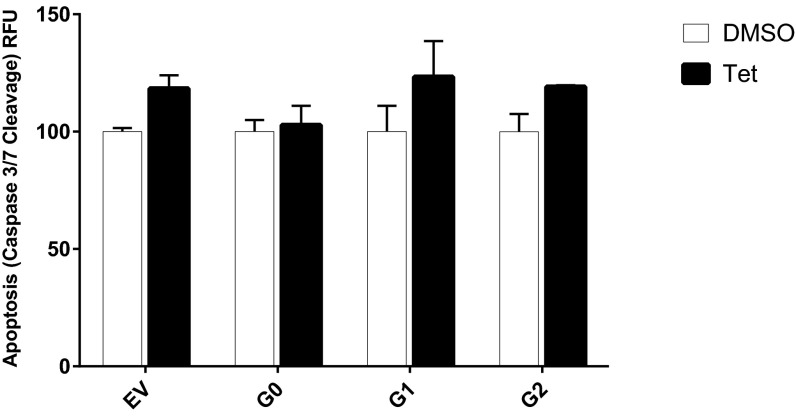
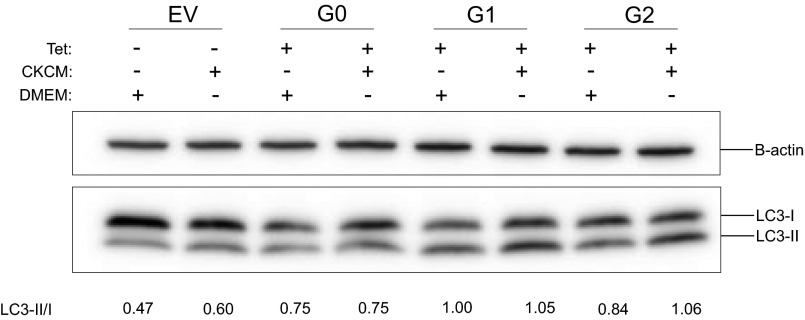
APOL1 expression has been reported to increase autophagy in many cells (16, 24, 25). However, the relevance of autophagy to APOL1-induced cell death seems to be cell type-dependent. Although inhibition of autophagy reduced APOL1 cytotoxicity in cultured podocytes and colorectal cancer cells (13, 25), it had no effect on APOL1-induced HEK293 cell death (24). Given that the cytotoxicity associated with expression of APOL1 variants becomes evident after 12 h of G1 or G2 expression (Fig. 2A), we compared the levels of an autophagy marker (conversion of LC3-I to LC3-II) after 9 h of induction of transgenic G0, G1, or G2. At this early time point, increased autophagy (as indicated by increase in LC3-II level) is appreciable in G1-expressing cells (Fig. S2). However, the autophagy inhibitors wortmannin or chloroquine did not reduce cytotoxicity induced by expression of G1 or G2 APOL1 (Fig. S3). This observation suggests that APOL1 risk variant-induced death of HEK cells is independent of autophagy. Similarly, this cell death is independent of apoptosis (Fig. S4).
Fig. S2.
Chloroquine increased G1 APOL1-induced LC3-II accumulation. G0 or G1 APOL1–T-REx-293 cells were tet-induced (50 ng/mL) in the presence or absence of chloroquine (5 μM) for 9 h. Autophagy flux was quantitated at 9 h by measuring LC3-II/LC3-I in cell lysates.
Fig. S3.
Autophagy inhibitors do not reduce G1 APOL1 cytotoxicity in T-REx-293 cells. Cytotoxicity: viability ratio of G1 APOL1–T-REx-293 cells after tet induction (50 ng/mL) in the presence or absence of autophagy inhibitors chloroquine (CQ) or wortmannin. All treatments lasted 24 h. Each bar represents mean ± SD of experimental triplicates.
Fig. S4.
Expression of G1 or G2 APOL1 does not increase apoptosis in T-REx-293 cells. Quantitation of apoptosis (caspase-3/7 cleavage) after tet-induction of G0, G1, or G2 APOL1 expression for 24 h. Each bar represents mean ± SD.
APOL1 Risk Variants Reduced Phosphorylation of STAT3 at Y705 in T-REx-293 Cells.
To see whether the cytotoxicity of APOL1 risk variants is mediated by dysregulation of intracellular signaling pathways essential for cell survival, we interrogated several signaling pathways involved in cell survival or in cellular response to proinflammatory signals. Specifically, we measured levels and phosphorylation status of key regulatory proteins Akt1, p-Akt1 (Ser473), p-MEK1 (Ser217/221), p-p38 MAPK (T180/Y182), p-STAT3 (Y705), and p-NF-κB p65 (S536) that represent convergence points of each of these signaling pathways. Analysis was based on lysates prepared from T-REx-293 cells after 9 h in the absence or presence of tet, a time point just before the onset of significant cell death in G1 or G2 APOL1-expressing cells.
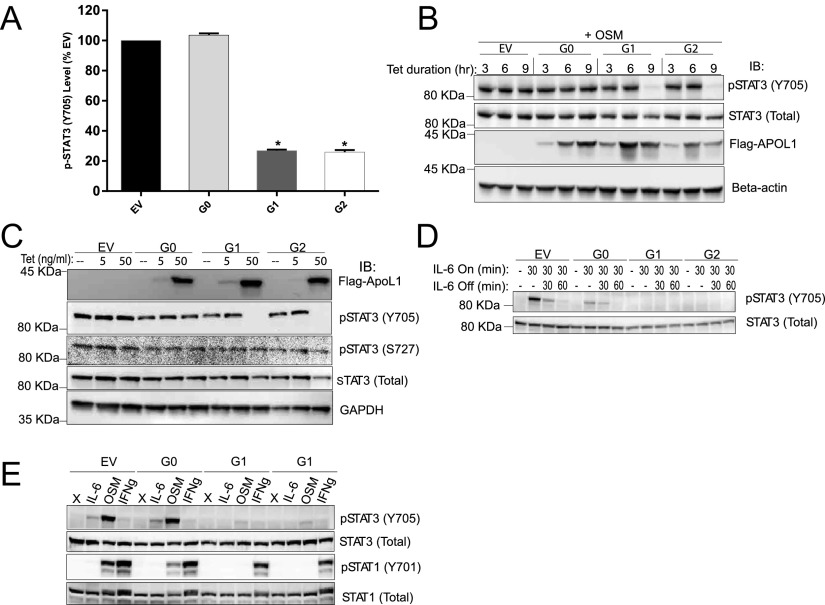
We found that the level of phospho-STAT3 (Y705) is reduced by 75% in cells that express G1 or G2, compared with those that express G0 or EV (Fig. 3A). To confirm this reduction in p-STAT3 level and to understand its temporal correlation to APOL1 expression, we immunoblotted whole cell lysates prepared from the T-REx-293 cells in which G0, G1, or G2 APOL1 was induced for 3, 6, or 9 h. The dramatic reduction in p-STAT3 in APOL1 G1- and G2-expressing cells occurs after 6 h of induction (Fig. 3B). Expression of APOL1 of all genotypes was detectable as early as 3 h after induction with tet (Fig. 3B). Differences in other phospho-proteins identified by this screening assay were not statistically significant.
Fig. 3.
Expression of G1 or G2 APOL1 inhibits STAT3 phosphorylation. (A) Quantitation of p-STAT3 (Y705) in T-REx-293 cell lysates after 9-h tet induction of G0, G1, and G2 APOL1. (B) Immunoblot of p-STAT3, total STAT3, Flag-tagged APOL1, and beta-actin at the specified time points postinduction of APOL1. Cells were cultured in 10% (vol/vol) FBS until the last 1 h, when they were transitioned to serum-free media for an additional 1 h before treatment with oncostatin M (OSM) for 10 min to induce STAT3 phosphorylation. (C) Immunoblot of basal p-STAT3, p-STAT3 (S727), total STAT3, APOL1 (Flag), and GAPDH after 9 h induction with the indicated tet concentration. Cells remained in 10% (vol/vol) FBS for the entire 9 h and were not treated with OSM. (D) Immunoblot of p-STAT3 and total STAT3 after induction with tet for 9 h [first 8 h in 10% (vol/vol) FBS, last 1 h in serum-free DMEM]. Cells were treated with or without IL-6 (10 ng/mL) for 30 min followed by IL-6 withdrawal for the specified time. (E) Immunoblot of p-STAT3 and p-STAT1 (Y701) after 9-h induction of APOL1. Cells were serum starved for the last 1 h before 10-min treatments with IL-6 (10 ng/mL), OSM (10 ng/mL), or INFγ (10 ng/mL). *, difference is statistically significant compared with EV.
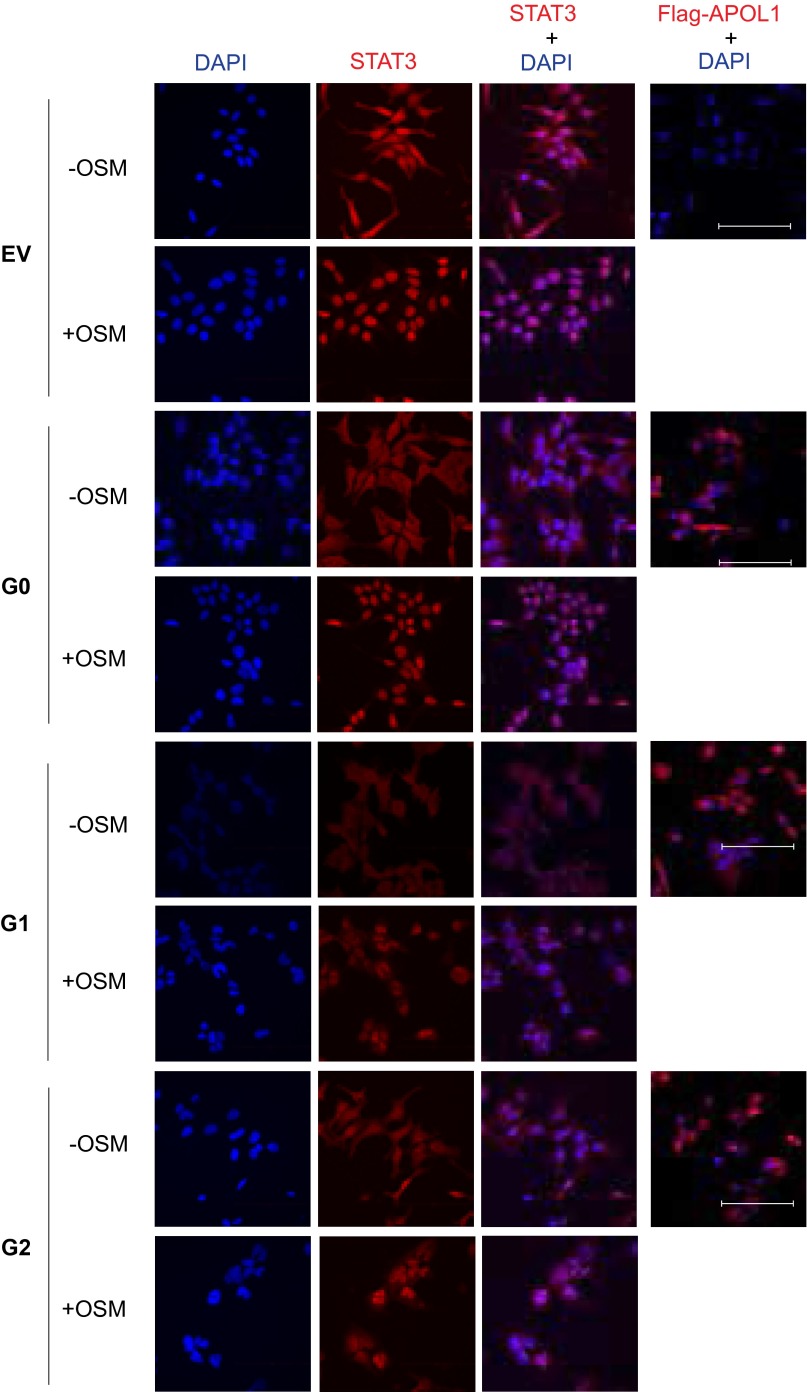
To investigate whether the reduction in p-STAT3 is related to the dose of G1 or G2 APOL1 expression, we induced expression of APOL1 protein using 5 and 50 ng/mL tet to induce very low and high levels of APOL1 expression. Expression of G1 or G2 APOL1 at low levels did not change the level of p-STAT3 (Fig. 3C). The reduction in p-STAT3 levels is seen only with a high expression level of G1 or G2 APOL1, but not with a high expression level of WT G0 APOL1 (Fig. 3C). The relative specificity of p-STAT3 regulation by G1 or G2 APOL1 is underscored by the stable level of p-STAT3 (S727) independent of APOL1 risk variant expression level (Fig. 3C). Phosphorylation of STAT3 on Y705 induces its dimerization and nuclear translocation whereas phosphorylation of STAT3 on S727 does not affect these processes. We investigated whether reduction in p-STAT3 correlates with reduced STAT3 nuclear localization in cells expressing G1 or G2 APOL1. Whereas oncostatin M (OSM) dramatically increased nuclear localization of STAT3 in EV- and G0-expressing T-REx-293 cells, nuclear STAT3 abundance was reduced in G1- or G2-expressing cells (Fig. S5). These results show that, in a dose-dependent manner, APOL1 risk variants reduce the level of phosphorylated STAT3, thereby reducing its nuclear localization.
Fig. S5.
Representative confocal micrographs of maximum intensity projection (15 optical Z-stacked images) of STAT3 nuclear localization G0, G1, or G2 T-REx-293 cells that were tet-induced for 9 h, followed by treatment or not with OSM (10 ng/mL, 10 min). EV are empty vector control cells. All images were collected under identical settings and were processed similarly. (Scale bars: 100 μm.)
To differentiate whether the reduction in level of phospho-STAT3 in G1 or G2 APOL1-expressing cells is due to inhibition of STAT3 phosphorylation or an augmentation of dephosphorylation, STAT3 phosphorylation was induced with IL-6 in serum-starved, APOL1-expressing T-REx-293 cells. It is known that Y705 in STAT3 is phosphorylated by stimulation of cells with cytokines, including IL-6. After IL-6 withdrawal, STAT3 phosphorylation gradually returns to baseline due to activities of endogenous phosphatases. IL-6 was withdrawn for 30 or 60 min after initial 30-min stimulation. Expression of G1 or G2 APOL1 blocked de novo phosphorylation of STAT3 (Fig. 3D).
To investigate the upstream mechanism by which G1 or G2 APOL1 inhibits the de novo phosphorylation of STAT3, we exploited two observations: (i) The phosphorylation of STAT3 on Y705 and phosphorylation of STAT1 on Y701 are both mediated by a common upstream transmembrane protein, GP130, which relays signals from several IL-6 type cytokines, such as oncostatin M (OSM); and (ii) IFN gamma (IFNγ) triggers phosphorylation of STAT1 on Y701 via IFNγ receptor dimer independently of GP130 whereas IFNγ has a negligible effect on STAT3 phosphorylation. Perturbation of GP130 is a well-known mechanism of regulating the GP130-JAK-STAT pathway. We thus hypothesized that, if GP130 is the target of the inhibitory effect of G1 and G2 APOL1, then OSM-induced phosphorylation of both STAT3 (Y705) and STAT1 (Y701) would be impaired whereas the GP130-independent, IFNγ-mediated phosphorylation of STAT1 (Y701) would be unaffected. As shown in Fig. 3E, we found this hypothesized change in phosphorylation to be correct.
APOL1 Risk Variants Down-Regulated GP130 Protein in T-REx-293 Cells.
We next quantitated the level of GP130 in the context of APOL1 expression. As was the case with inhibition of STAT3 phosphorylation, the level of GP130 [both the total (Fig. 4A) as well as cell membrane bound fraction (Fig. 4B)] decreased after 6 h of induction of G1 and G2 APOL1 expression. As previously reported, phosphorylation of GP130 on S782 mediates its internalization and degradation (26). We therefore measured the levels of phospho-GP130 (S782), and found that the ratio of p-GP130 (S782) to total GP130 increased after 6 h in G1 or G2 APOL1-expressing cells (Fig. 4A). However, induction of APOL1 (G0 or G1/G2 variant) does not affect the mRNA level of GP130 (Fig. 4C). This result is consistent with APOL1 risk variant-induced internalization and degradation of GP130.
p38 MAPK Mediates APOL1 Risk Variant-Induced Down-Regulation of the GP130-STAT3 Signaling Pathway.
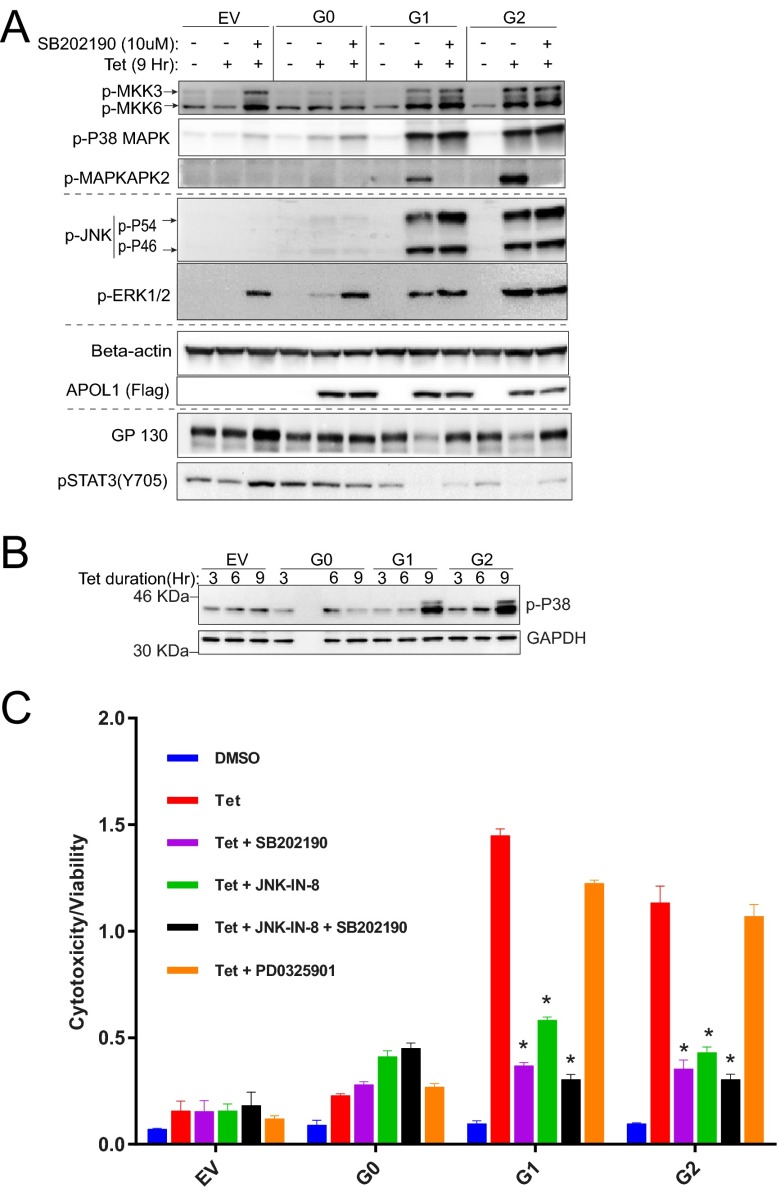
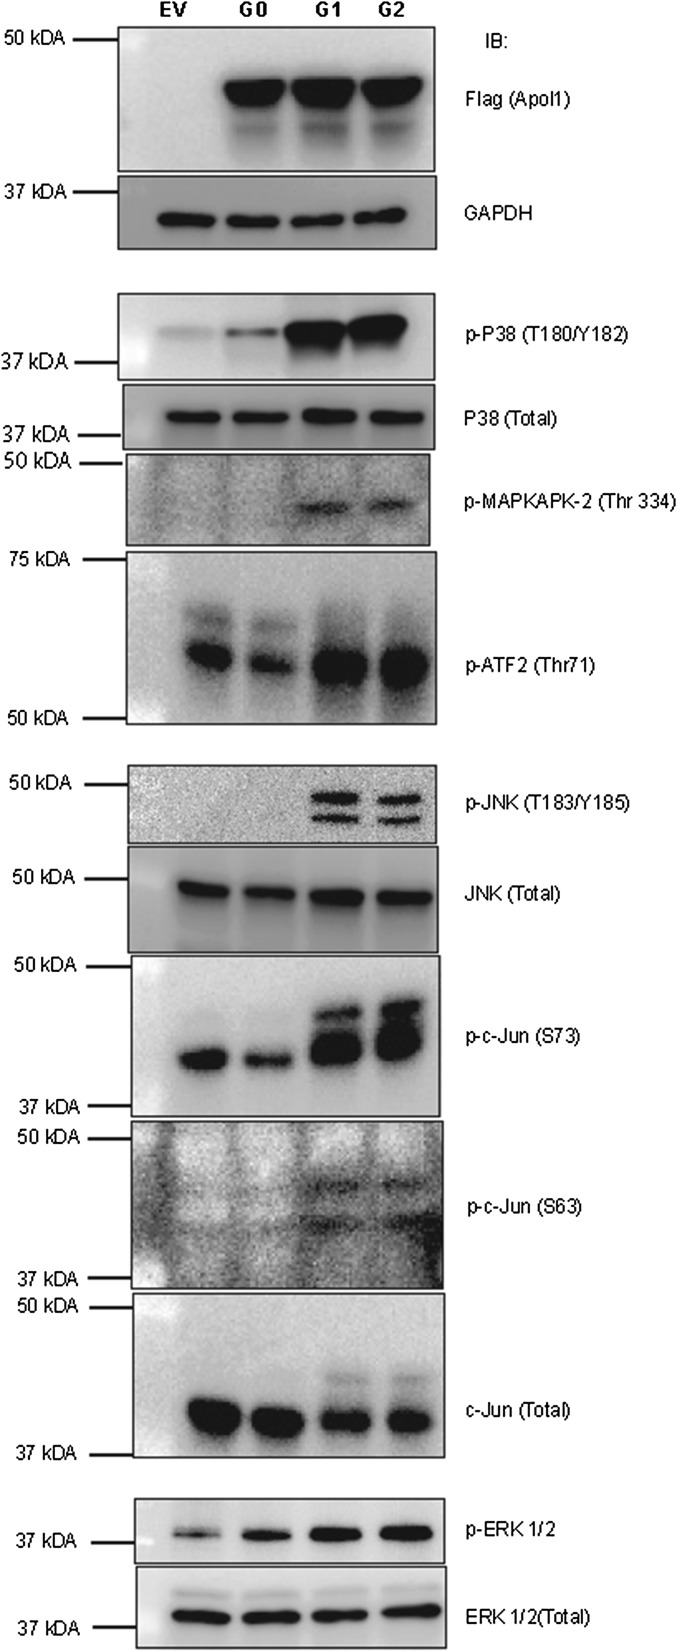
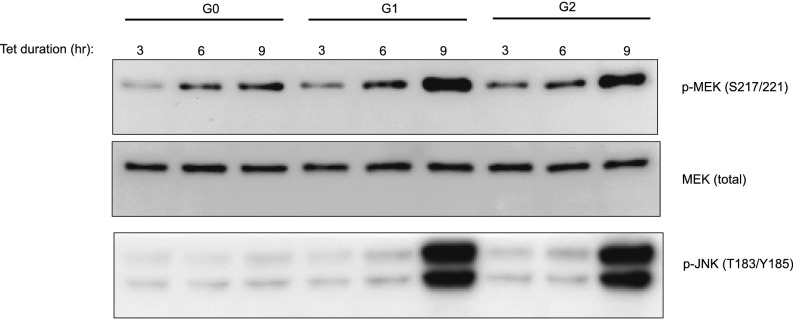
Activated p38-MAPK triggers internalization and degradation of GP130 (26). p38 MAPK is activated by several forms of cellular stress and inflammatory signals that activate two closely related dual-specificity protein kinases, MKK3 and MKK6, through phosphorylation at Ser189/Thr222 and Ser207/Thr211, respectively (27, 28). Phosphorylated MKK3 and MKK6 in turn activate p38 MAPK by phosphorylating Thr180 and Tyr182. Activated p38 MAP kinase then phosphorylates many substrates, including MAPKAPK2 (29). To determine the activity of p38 MAPK in T-REx-293 cells expressing G0, G1, or G2 APOL1, we immunoblotted the phosphorylated forms of MKK3, MKK6, p38 MAPK, and MAPKAPK2. We found that expression of G1 or G2 APOL1 robustly activates the p38 MAP kinase signaling pathway, as indicated by phosphorylation of MKK3, MKK6, p38-MAP kinase, and MAPKAPK2 (Fig. 5A and Fig. S6). Importantly, because the down-regulation of the GP130-STAT3 pathway occurred after 6 h of G1 or G2 APOL1 expression (Figs. 3B and 4A), activation of p38 MAP kinase also occurred after 6 h of G1 or G2 APOL1 expression (Fig. 5B). Activation of JNK and MEK (which phosphorylate ERK) also occurred after 6 h of G1 or G2 APOL1 expression (Fig. S7). SB202190 is a potent p38 MAPK inhibitor that blocks the kinase activity of p38 α and β, thereby preventing phosphorylation of MAPKAPK2 (30). Inhibition of p38 MAPK with SB202190 rescues both G1 or G2 APOL1-induced reduction of GP130 protein and reduction of STAT3 phosphorylation (Fig. 5A, lanes 9 and 12). This observation suggests that activated p38 MAPK is a mediator of APOL1 risk variant-induced down-regulation of GP130-STAT3 signaling in HEK cells.
Fig. 5.
G1 and G2 APOL1 down-regulate GP130-STAT3 signaling and induce cytotoxicity via time-dependent activation of p38 MAPK. (A) Immunoblot of p-MKK3 (S189), p-MKK6 (S207), p-P38 (T180/Y182), p-JNK (T183/Y185), p-ERK (T202/Y204) MAPKs, beta-actin, Flag-tagged APOL1, GP130, and p-STAT3 (Y705) in whole cell lysates after treatment with tet (50 ng/mL) with/without p-38 inhibitor, SB202190, 10 μM for 9 h. (B) Immunoblot of p-P38 (T180/Y182) MAPK and GAPDH in whole cell lysates after treatment with tet (50 ng/mL) for the specified time periods. (C) Cell cytotoxicity/viability after 24-h treatment with or without tet (50 ng/mL) in the presence or absence of inhibitors of p38 MAPK (SB202190, 10 μM), JNK (JNK-IN-8, 1 μM), MEK (PD0325901, 10 μM), or a combination of p38 and JNK inhibitors. *, compared with tet-treated cells, reduction in cytotoxicity is statistically significant.
Fig. S6.
Expression of G1 or G2 APOL1 in T-REx-293 cells activates MAPK signaling pathways. After inducing expression of G0, G1, or G2 APOL1 in T-REx cells for 9 h using tetracycline, cell lysates were immunoblotted for the p38, JNK, and ERK and their substrates. Note that ATF2 is a substrate of both p38 MAPK and JNK.
Fig. S7.
MEK and JNK are activated after 6 h of expression of G1 or G2 APOL1 in T-REx-293 cells. After tetracycline-induced expression of G0, G1, or G2 APOL1 for the specified time points, cell lysates were immunoblotted for phospho-MEK (S217/221), MEK (total), and phospho-JNK.
p38 MAP Kinase and JNK Are Mediators of APOL1 Risk Variant-Induced Cytotoxicity.
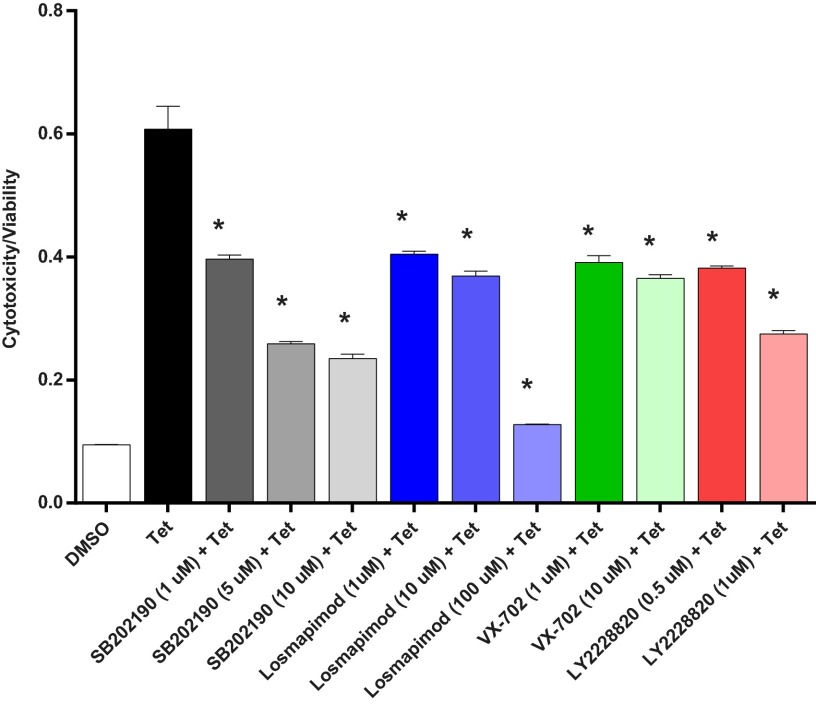
To determine whether induced expression of G1 or G2 APOL1 in T-REx cells also results in concurrent activation of other major MAP kinases, cell lysates from G0-, G1-, or G2-expressing T-REx were immunoblotted for activated JNK and ERK 2 MAP kinases. As shown in Fig. S6 and Fig. 5A, we found that, in addition to p38 activation, both JNK and ERK are also activated by APOL1 risk variants. To determine whether these activated p38, JNK, and ERK MAP kinases are physiologically relevant to pathogenesis of G1 or G2 APOL1 cytotoxicity, we tested whether inhibition of any of the three MAP kinases reduces G1 or G2 APOL1 cytotoxicity. We found that inhibition of p38 MAP kinase (with SB202190) or JNK (with JNK-IN-8) significantly reduced cytotoxicity associated with G1 or G2 APOL1 (Fig. 5A). Inhibition of Erk did not significantly reduce G1 or G2 APOL1-induced cytotoxicity. Cytoprotection conferred by JNK and p38 inhibitors was not additive (Fig. 5A). The paradoxical increase in phosphorylation of JNK and ERK by p38 inhibition (Fig. 5A, lanes 3, 6, 9, and 12) is a well-known and reported phenomenon (31) that is attributed to loss of p38-induced expression of MAPK phosphatase-1 (MKP), which can dephosphorylate all three MAP kinases (32). Moreover, similar cytoprotection was achieved with three other p38 MAPK inhibitors (Fig. 6). Dual inhibitors of p38 α and β (SB202190 and Losmapimod) produced greater inhibition of G1 or G2 APOL1-induced cytotoxicity than did VX-702, a specific inhibitor of p38 α (Fig. 6). This inhibition shows that the cytotoxicity of G1 or G2 APOL1 is mediated by activated p38 MAPK and JNK in HEK cells.
Fig. 6.
Several p38 MAPK inhibitors reduce G1 APOL1-induced cytotoxicity. T-REx-293 cell cytotoxicity/viability after 24-h treatment with or without tet (50 ng/mL) in the presence or absence of inhibitors of p38 MAPK: SB202190, (1–10 μM), Losmapimod (1–100 μM), VX-702 (1–10 μM), and LY2228820 (0.5–1 μM). *, reduction in cytotoxicity/viability is statistically significant compared with tet-treated cells.
The lack of increased phosphorylation of STAT3 S727 in the setting of increased p38 activation by G1 or G2 APOL1 is unexpected (Fig. 3C) because STAT3 S727 is a substrate of p38 MAPK. It is possible that STAT3 S727, which is also a substrate of other kinases, is maximally phosphorylated by these other kinases irrespective of p38 activity. However, it is reassuring that canonical substrates of p38 (including MAPKAPK-2 and ATF2) show expected phosphorylation by p38 MAPK (Fig. S6).
APOL1 Risk Variant-Induced Depletion of Intracellular K+ Triggered the Activation of p38 MAPK, Down-Regulation of the GP130-STAT3 Pathway, and Increased Cytotoxicity in T-REx-293 Cells.
The membrane pore-forming domain of APOL1 shares modest homology to bacteria colicins and diphtheria toxins (33, 34) known to form ion channels that deplete cellular K+ (35, 36). APOL1 has been shown to form cation-selective channels in lipid bilayers (15, 17, 18). Notably, the cellular phenotypes of G1 and G2 APOL1-expressing T-REx-293 cells are strikingly similar to the consequences of mammalian cell K+ depletion by pore-forming bacteria toxins (PFTs) (19, 20, 22). As in PFT-exposed cells, expression of G1 and G2 APOL1 also resulted in (i) activation of p38, ERK, and JNK MAP kinases, (ii) cell swelling (likely due to concurrent Na+ influx), and (iii) increased autophagy. Therefore, we investigated whether expression of G1 and G2 APOL1 results in reduction of intracellular K+ in T-REx-293 cells. For these experiments, total K content of cell populations grown in 96-well plates was measured using X-ray fluorescence, which provides label-free quantitation of elements with atomic number 13 (aluminum) or greater (37–39).
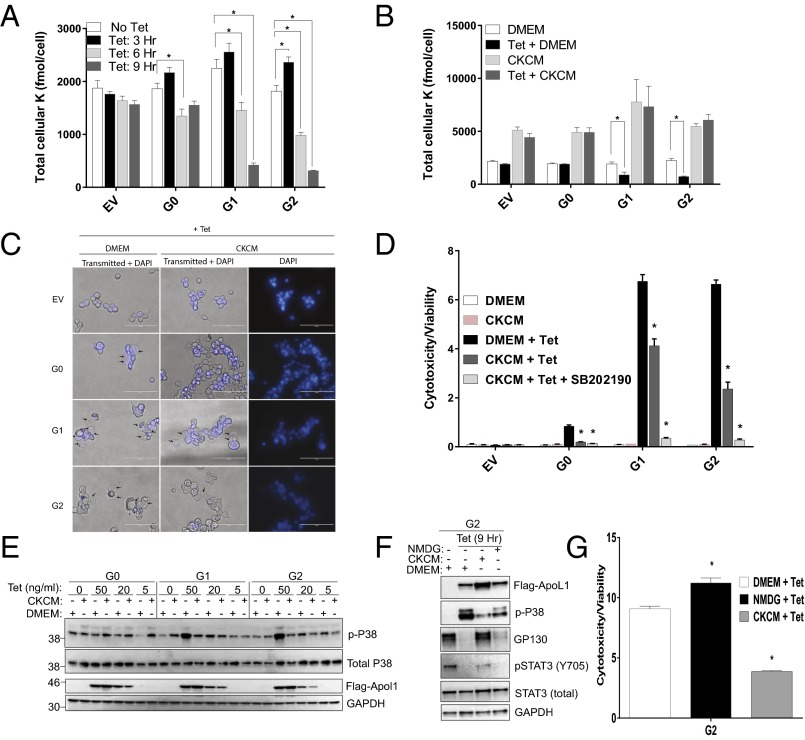
We found that G1- or G2-expressing cells showed time-dependent incremental reduction of intracellular K content, compared with G0-expressing cells (Fig. 7A). After 6 h of tet exposure, intracellular K content decreased by 13%, 27%, 35%, and 46% in EV-, G0-, G1-, and G2-expressing cells, respectively. After 9 h of tet exposure, the decline in intracellular K content reached 81%, and 83% in G1- and G2-expressing cells, respectively, compared with 16% in G0-expressing cells (Fig. 7A). Intracellular K contents of APOL1 deficient (EV) and G0-expressing cells were identical after 9 h of G0 induction (Fig. 7A). Intracellular K content transiently increased after 3 h of expression for all APOL1 variants, compared with EV (Fig. 7A), possibly reflecting compensatory activity of Na+/K+ ATPase and/or NKCC1.
Fig. 7.
Cytotoxicity of G1 and G2 APOL1 is mediated by depletion of intracellular potassium and activation of SAPKs in T-REx-293 cells. (A and B) Intracellular K contents were measured using XRpro X-ray fluorescence after inducing G0, G1, or G2 APOL1 expression with tet (50 ng/mL) in DMEM for the specified time periods in A and for 9 h in DMEM or high-K+ media, CKCM in B. (C) Phase contrast micrograph of T-REx-293 cells 9 h postinduction with tet (50 ng/mL) in DMEM or CKCM. (Magnification: 40×.) (Scale bars: 100 μm.) (D) T-REx-293 cells cytotoxicity/viability ratio after 24-h treatment with or without tet (50 ng/mL) in DMEM or CKCM, in the presence or absence of p38 inhibitor, SB202190 (10 μM). (E) Immunoblot of whole cell lysates for p-p38 (T180/Y182), total p38, Flag-tagged APOL1, and GAPDH after 9-h induction (with specified concentrations of tet) in DMEM or CKCM. (F) Immunoblot of Flag, p-p38(T180/Y182), GP130, pSTAT3 (Y705), total STAT3, and GAPDH in whole cell lysates from T-REx-293 cells in which expression of G2 APOL1 was induced for 9 h with tet (50 ng/mL) either in DMEM, CKCM, or NMDG. (G) Comparison of G2 APOL1-induced cytotoxicity in T-REx-293 cells after 24-h induction in DMEM, CKCM or NMDG. *, differences are statistically significant.
If, as with PFTs, APOL1 risk variants can act as K+-permeable pores reflecting the electrochemical gradient for K+, then increasing the concentration of extracellular K+ should diminish the driving force for K+ efflux (19). We therefore induced expression of G0, G1, or G2 APOL1 in the T-REx-293 cell models, in the presence of standard DMEM (5 mM K+, 117 mM Na+) or in an iso-osmolar culture medium (CKCM) in which Na+ is replaced by K+ with resultant K+ concentration of 121 mEq and Na+ concentration of 1 mEq. As anticipated, G1 and G2 APOL1-associated decline in intracellular K content was prevented in cells cultured in CKCM but not DMEM (Fig. 7B).
Next, we asked whether inhibition of K+ efflux is sufficient to inhibit G1 and G2 APOL1-induced p38 MAPK activation. We examined p38 activation in DMEM versus CKCM. As shown in Fig. 7E, G1 and G2 APOL1-induced p38 MAPK activation was inhibited in cells that were tet-induced in CKCM. In contrast, p38 inhibitor SB202190 had no effect on G1 and G2 APOL1-induced K+ efflux. G1 or G2 APOL1-induced activation of ERK and JNK MAP kinases was also prevented in CKCM-cultured cells. High K+ media (CKCM) also reduced APOL1 variant-induced apparent cell swelling (Fig. 7C) and cytotoxicity (Fig. 7G). The combination of CKCM and p38 inhibitor SB202190 completely blocked APOL1-induced cytotoxicity (Fig. 7D). However, neither SB202190 nor CKCM reduced APOL1 variants-induced autophagy (Figs. S8 and S9).
Fig. S8.
Inhibition of p38 MAPK does not reduce G2 APOL1-induced autophagy. G2 APOL1–T-REx-293 cells were induced or not with tet (50 ng/mL) for 9 h (total). Cells were exposed to SB202190 (10 μM) for 3, 6, or 9 h. Autophagy was quantitated in all cells after 9 h.
Fig. S9.
Elevated extracellular [K+] does not reduce G1 or G2 APOL1-induced autophagy. G0, G1, or G2 APOL1–T-REx-293 cells were induced with tet for 9 h in DMEM or CKCM. Autophagy was quantitated in all cells after 9 h.
Because iso-osmolar high K+ CKCM media are necessarily low in Na+, the observed protective effect might be attributable to decreased Na+ influx rather than, or in addition to, decreased K+ efflux. To investigate the contribution of Na+ movement to the phenotypes seen in G1 and G2 APOL1-expressing cells, we replaced Na+ in the medium with equimolar N-methyl-d-glucamine (NMDG), a relatively membrane-impermeable cation. Compared with the significant effects associated with CKCM, NMDG only marginally decreased p38 activation, but did not rescue GP130/pSTAT3 or reduce G1 or G2 APOL1-induced cytotoxicity (Fig. 7 F and G). These findings indicate that G1 or G2 APOL1-induced activation of p38 MAPK and cytotoxicity are attributable primarily to augmented K+ efflux rather than to increased Na+ influx.
Discussion
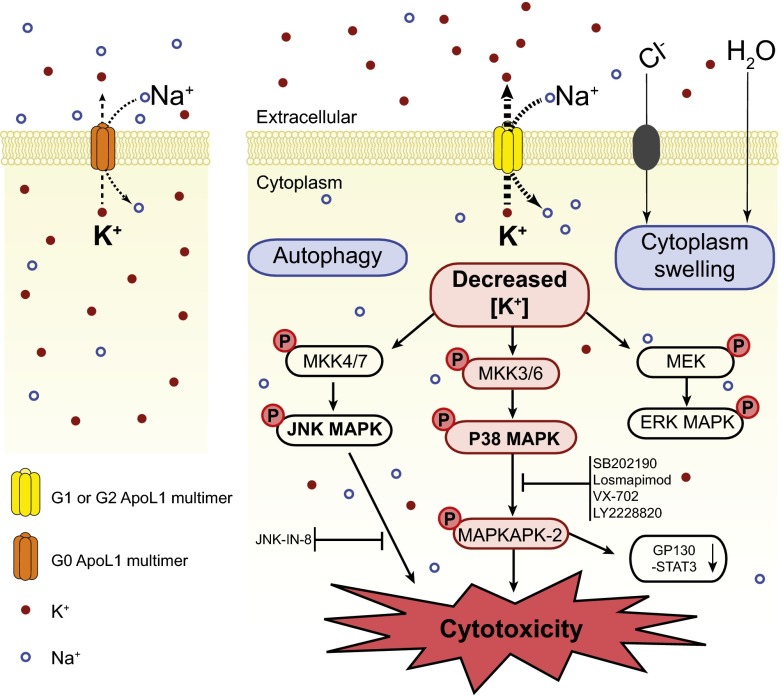
The mechanism by which APOL1 risk variants contribute to the high rate of kidney disease among people of recent African ancestry is unknown. Expression of G1 or G2 APOL1 in human-derived cells results in cytotoxicity (12–14) via poorly understood mechanisms. In the present study, using tetracycline-inducible APOL1 transgenic T-REx-293 cells as a model, we show that expression of G1 or G2 APOL1 results in net loss of intracellular K content, a condition that causes the activation of stress-activated protein kinases (SAPKs), p38, and JNK, which ultimately results in cytotoxicity. Prevention of K+ efflux by culturing cells in media in which extracellular Na+ was replaced with K+ not only prevented the aberrant activation of SAPKs, but also reduced APOL1 risk variant-induced apparent cell swelling and cell death. Thus, these data support a model of APOL1-mediated cytotoxicity that derives primarily from APOL1 risk variant-induced loss of cellular K+ and the subsequent induction of the SAPKs (Fig. 8). This proposed mechanism is reminiscent of the cation permeability-associated trypanocidal activity of APOL1 (18). This finding also corroborates our recent report that elevated extracellular [K+] attenuates APOL1-associated morphological toxicity in Xenopus oocytes (15).
Fig. 8.
A model of G1 or G2 APOL1-induced cytotoxicity mediated by K+ efflux and activation of SAPK signaling. APOL1 proteins form K+-permeable cation-selective pores in the plasma membrane. Pores formed by G1 or G2 mediate increased efflux of intracellular K+, leading to depletion of intracellular K+ and resulting in activation of p38, JNK, and ERK MAPKs. The aberrantly activated SAPKs (p38 and JNK) cause cell toxicity and death likely via their downstream effectors. Down-regulation of GP130-STAT3 signaling is a downstream consequence of activated p38 MAPK. However, the direct contribution of the GP130-STAT pathway in the pathogenesis of G1 or G2 APOL1 cytotoxicity is yet to be determined. Apparent cytoplasmic swelling results from influx of Na+ (likely G1 or G1 APOL1-related), with accompanying Cl− and H20. G1 or G2 APOL1-induced autophagy occurs independently of K+ efflux and does not seem to contribute to G1 or G2 APOL1-induced death of HEK293 cells.
APOL1 Risk Variants Hyperactivate SAPKs Known to Mediate Kidney Injury.
The SAPKs p38 and JNK are known to be activated in the context of glomerular and tubular injury (reviewed in ref. 40). In humans, the severity of glomerulosclerosis correlates with the number of phospho-p38 or phospho-JNK positive glomerular cells (41, 42). In animal experimental models of glomerulopathies, activation of p38 MAPK or JNK is necessary for podocyte injury and proteinuria (40, 43). Consistently, inhibition of these SAPKs prevents podocyte injury, suppresses proteinuria in animal models, and mitigates glomerulonephritis (41, 43–46). Importantly, HIV-1 GP120-induced tubular epithelial apoptosis is also mediated by p38 MAPK signaling (47). Therefore, our finding that expression of G1 or G2 APOL1 results in hyperactivation of p38 and JNK suggests that these well-described mediators of kidney injury are physiological mediators of APOL1 nephrotoxicity. This possibility requires further investigation in human kidney tissue.
Once activated, both p38 and JNK phosphorylate and regulate multiple downstream targets, including many transcription factors. Our initial observation of GP130 down-regulation (and subsequent inhibition of STAT3 phosphorylation at Y705) is a downstream effect of p38 hyperactivation via MAPKAPK-2. The current study did not determine whether the loss of GP130-STAT3 signaling is a mediator of G1 or G2 APOL1 cytotoxicity or whether it reflects only p38 hyperactivity. Moreover, the relevance of the GP130-STAT3 pathway to kidney health and disease is conflicting. STAT3 regulates steady-state expression of synaptopodin in cultured mouse podocytes. Inhibition of STAT3 signaling results in loss of synaptopodin and dysregulation of podocyte actin filaments (48), suggesting that STAT3 is essential for podocyte health. In contrast, a recent study suggests that GP130 signaling is not a critical component of the pathology/biology of the mouse podocyte in vivo (49). However, a series of studies found that STAT3 pathway activation is frankly pathogenic. He and coworkers show that src-dependent phosphorylation of STAT3 is an important mediator of podocyte proliferation and dedifferentiation in HIVAN (50, 51). Therefore, the significance of GP130-STAT3 to APOL1 cytotoxicity and APOL1 nephropathy remains uncertain.
Risk Variant APOL1 Cytotoxicity Is Dose-Dependent.
The fact that only high-level expression of G1 or G2 APOL1 proteins resulted in dysregulation of p38 MAPK and GP130-STAT3 pathways may explain in part why only a minority of individuals with two copies of APOL1 risk alleles develop APOL1 nephropathy. Perhaps the determining factor may be the quantity/dose of APOL1 protein stably produced and maintained in vulnerable kidney cells, such as podocytes or glomerular endothelium. Dose-dependent APOL1 toxicity in vitro has also been observed by other investigators (12, 14). It is plausible that at least some so-called “second hits” mediate their pathogenic effects primarily by up-regulating expression and/or stabilizing APOL1 protein. HIV infection is the most potent second hit yet known for APOL1 nephropathy. HIV-infected Africans with two copies of APOL1 risk alleles have 89-fold higher odds of developing HIVAN than have HIV-positive controls (4). HIV infection of cultured human podocytes increases podocyte levels of endogenous APOL1 protein (13), perhaps, as has been suggested, because APOL1 functions as an HIV suppressor (52). IFN is another known second hit. Exposure of patients to IFNα, β, or γ has been associated with acute onset of APOL1 nephropathy (53, 54). These three interferons also consistently up-regulate APOL1 expression in cultured endothelial cells and podocytes (54). Thus, cells expressing such high levels of APOL1 protein may be more susceptible to the cytotoxic effect of its risk-variant forms. Consistent with this hypothesis, fewer surviving glomerular cells in FSGS and HIVAN kidney biopsies stained positive for APOL1 than in glomeruli of “normal” kidneys (55). High APOL1-expressing podocytes likely detach and die, leaving focally and segmentally sclerosed vascular beds in their wake.
What Manner of Death?
T-REx-293 cells that overexpressed G1 or G2 APOL1 exhibited higher cytotoxicity than cells overexpressing APOL1 G0 at similar levels. Because our cytotoxicity assay was based on loss of membrane integrity, the specific modes of cell death in the T-REx-293 cells were not determined. It is likely that APOL1 variants induced damage by activating multiple forms of cell death (13, 14). G1 or G2 APOL1-induced death has been attributed to increased autophagy, necrosis, and pyroptosis (12, 13). In the present study, although we observe that G1 and G2 APOL1 increased autophagy flux compared with G0 (Fig. S2), inhibitors of autophagy did not block G1 or G2 APOL1-induced cell death, suggesting that G1 and G2 APOL1-induced cytotoxicity in T-REx-293 cells is independent of autophagy. In T-REx-293 cell culture, autophagy is likely a marker of, or a response to, risk-variant APOL1 cytotoxicity rather than a mediator. Although loss of cellular K content is a known inducer of pyroptosis, the absence of full-length caspase-1 and proinflammatory NOD-like receptors (NLRs) in HEK293 cells (56) limits the likelihood that pyroptosis is a mediator of G1 or G2 APOL1-induced cell death in 293 cells. Also, similar levels of caspase-3/7 activity in EV, G0, G1, or G2 APOL1-expressing cells excludes apoptosis as a major mediator of G1 or G2 APOL1-induced cell death in T-REx-293 cells. These observations leave cell necrosis as the likely form of cell death in G1 or G2 APOL1-expressing T-REx-293 cells.
What Is Toxic for Parasites May Also Be Toxic in the Kidney.
The production of a serum response-associated (SRA) protein by T. b. rhodesiense provides a mechanism by which this organism, but not Trypanosoma brucei brucei, evades inactivation by the G0 form of APOL1 (57). Recombinant T. b. rhodesiense SRA was found to block cation conductance by APOL1 G0 but did not affect cation conductance by the G2 allele (17). The trypanocidal property of the G1 and G2 forms of APOL1 is attributable to the ability to evade “control” by the parasite-derived SRA protein. In the current study, we report a time-dependent and incremental decline of intracellular K content in APOL1 variant-expressing T-REx-293 cells, compared with APOL1 G0-expressing cells. Although we did not prove that the augmented net K+ efflux is directly mediated by APOL1, the temporal correlation of K+ efflux and APOL1 expression as well as APOL1's known property as a cation-selective pore former strongly suggest that the observed K+ depletion is directly mediated by the risk-variant forms of APOL1. Thus, the same risk variants in the SRA-binding domain of G1 and G2 that enabled their escape from regulation by trypanosomal SRA may also protect their cation-conductance activity from regulation by yet undefined mammalian functional or structural analogs of SRA.
Therapeutic Implications.
Previously, we suggested that inhibition of signaling cascades that control APOL1 expression might be part of an effective therapeutic approach to some individuals with APOL1-associated nephropathy (54). Several of the p38 MAPK inhibitors that reduce APOL1-associated toxicity in cell culture have been studied in various human conditions, including kidney disease (44). Although p38 and JNK have multiple roles, it is possible that inhibition of their activities could also contribute to reducing APOL1 variant-mediated toxicity in humans, pending development of more targeted therapies.
Our work has limitations that are worth noting. In the absence of a reliable animal model of APOL1 nephropathy, the current study models APOL1 toxicity in tetracycline-inducible transgenic T-REx-293 cells. Although the cell type or types that ultimately lead to kidney disease are not yet clear, it is certainly due to in vivo dysfunction of cell types that express endogenous APOL1, rather than to inducible expression in T-REx-293 cells that do not express endogenous detectable APOL1 polypeptide. However, the APOL1-associated toxicity observed to date in a wide range of cells and systems suggests that this toxicity is not a cell type-specific phenomenon. As is true for the dominantly acting mutations in the widely expressed glomerulopathy genes ACTN4, TRPC6, and INF2, glomeruli may exhibit the greatest susceptibility to toxic effects for reasons related to their terminally differentiated state and intricate architecture (58).
Summary
We report four observations that add to our understanding of APOL1 mediated toxicity: (i) Relative to the G0 allele, G1 and G2 APOL1 induce increased loss of intracellular K+ early in the process of risk-variant APOL1-induced cytotoxicity; (ii) risk-variant APOL1-induced loss of intracellular K+ activates SAPK pathways; (iii) activated SAPKs act as mediators of APOL1 risk variant-induced cell death; and (iv) these signaling perturbations are dependent on the dose of G1 and G2 APOL1 expression. Further understanding of APOL1-mediated kidney injury will be required for eventual treatment and prevention of what is both a large, growing, and expensive public health problem and an enormous racial health disparity.
Materials and Methods
Please refer to SI Materials and Methods for details of material and methods.
Generation of Cell Lines.
APOL1-expressing T-REx-293 cells were generated as described in SI Materials and Methods.
Cell Culture Media.
Specifics of growth conditions, culture media modification, and chemical inhibitors of MAPKs are detailed in SI Materials and Methods.
Cytotoxicity Assays.
As detailed in SI Materials and Methods, cytotoxicity and viability were measured with a Multi Tox-Fluor Multiplex Cytotoxicity assay, and apoptosis was measured with an ApoToxGlo Tripplex Assay.
Assessment of Cell Swelling.
Images of T-REx were collected at 20× and 40× using the EVOS FL Cell Imaging System (Life Technologies).
Measurement of Intracellular K+ with XRpro X-Ray Fluorescence Technology.
Intracellular K+ was measured using Icagen XRpro X-ray fluorescence analysis based on characteristic X-ray fluorescence (37–39) as detailed in SI Materials and Methods.
Screening of Signaling Pathways.
Screening of signaling pathways with PathScan Signaling Nodes Multi-Target Sandwich ELISA Kit (Cell Signaling) is detailed in SI Materials and Methods.
IL-6 Withdrawal Assay.
Details of the IL-6 withdrawal assay are described in SI Materials and Methods.
Membrane Protein Biotinylation Assay.
T-REx-293 cell-surface proteins were labeled with a cleavable biotin analog as previously described (59). Biotinylated membrane proteins captured with NeutrAvidin were eluted in SDS sample buffer containing 50 mM DTT. Then, 40 μL of eluate was separated by 7% SDS/PAGE, followed by immunoblot analysis.
Quantitative Real-Time PCR.
Primer sequence and details of quantitative real-time PCR are provided in SI Materials and Methods.
Statistical Analysis.
Data are presented as mean-SEM unless otherwise stated. All experiments were conducted as triplicates and were repeated at least three times. All data were analyzed by ANOVA, followed by the Holm–Sidak method using GraphPad Prism version 6. Differences with P < 0.05 were considered to be statistically significant.
SI Materials and Methods
Generation of Stable, Tetracycline-Inducible Transgenic APOL1 T-REx-293 Cells.
pCMV6-entry vector encoding the full-length APOL1 cDNA (RefSeqORF: 1197) with C-terminal MYC and FLAG tags was purchased from Origene. APOL1 variants G1 and G2 were generated using the QuikChange II site-mutagenesis kit (Agilent Technologies). pcDNA4/APOL1-G0, pCDNA4/APOL1-G1, and pcDNA4/ APOL1-G2 were made by digesting all variants of APOL1 genes out of the pcMV6-entry/APOL1 vectors and cloning them into the KpnI and SacII restriction sites of the pcDNA/TO/myc-HisB vector (Invitrogen) containing the zeocin-resistant gene. After confirmation of the constructs by DNA sequencing (Genwiz), T-REx-293 cells (Invitrogen) were transfected with these APOL1 expression constructs using extreme gene 9-transfection reagent (Roche Diagnostics). Single colony cells possessing APOL1 or its variants were picked after 2 wk of zeocin (Invitrogen) selection. The stable cells, referred to as APOL1-G0-REx-293, APOL1-G1-T-REx-293, and APOL1-G2-T-REx-293 cells were obtained. T-REx-293 cells are modified HEK293 cells that stably express high levels of the tetracycline repressor protein (Tet) under the control of the human CMV promoter. Binding of Tet repressor protein to the TetO2 sequences represses transcription of APOL1. In the presence of tet, Tet repressor is unable to bind the Tet operator, thereby inducing transcription of APOL1 gene.
Cell Culture Media.
T-REx-293 cells were grown under 5% CO2 at 37 °C in DMEM supplemented with 10% (vol/vol) tetracycline-FBS (Atlanta Biologicals), 0.2 mg/mL zeocin, 2 μg/mL blasticidin, and 1% antibiotic-antimycotic solution. Modified culture media were formulated as variations of DMEM. DMEM contained 5.4 mM KCl, 109.5 mM NaCl, 17.9 mM NaHCO3, and 0.9 mM NaH2PO4. For Complete K+ Culture Media (CKCM), all sodium salts were replaced with equimolar potassium salts. In media supplemented with the organic monovalent cation, N-methyl-d-glucamine (NMDG), NaCl was replaced with NMDG·HCT. All media contained 1.8 mM CaCl2, 0.81 mM MgSO4, 1 mM sodium pyruvate, 4 mM l-glutamine, 25 mM glucose, 0.04 mM phenol red, and 0.000045 mM Fe(NO3)3 and were supplemented with 20 mL/L MEM Amino Acids Solution (Life Technologies) and 10 mL/L MEM Vitamin Solution (Sigma). Media tonicities ranged between 300 and 340 mOsm/kg H2O (Osmette A; Precision Systems) with pH values ∼7.5. MEK inhibitor (PD0325901) and p38 inhibitors (Losmapimod, Vx-702, and LY2228820) were from Selleckchem. P38 inhibitor (SB202190) and JNK inhibitor (SP600125) were from Santa Cruz.
Cytotoxicity Assays.
T-REx-293 cells (1–2 × 10⁵) were seeded in each well of a 96-well plate. After 12 h of growth, cells were treated with or without 50 ng/mL tetracycline in complete DMEM. Cytotoxicity and viability were measured 24 h later (Multi Tox-Fluor Multiplex Cytotoxicity assay; Promega) as previously described (58). The cytotoxicity component measures cleavage of cell-impermeant, fluorogenic peptide substrate by dead-cell protease released from cells that have lost membrane integrity. Viability was determined based on cell-permeable fluorogenic peptide substrate that requires cleavage by protease active only in living cells. Apoptosis was measured using the ApoTox-Glo Triplex Assay (Promega), based on cleavage of luminogenic DEVD-peptide substrate by active caspase-3/7. Each treatment condition was run in triplicate, with values averaged to obtain a single data point.
Measurement of Intracellular K+ with XRpro X-Ray Fluorescence Technology.
Intracellular K+ was measured using Icagen XRpro X-ray fluorescence analysis, which provides label-free, direct measurements of element content for cell populations grown in multiwell plates, and under standard growth conditions. Elements with atomic number 13 (aluminum) and greater are directly quantified based on characteristic X-ray fluorescence emission (41–43). For ion flux measurements,T-REx-293 cells were seeded in 96-well plates at 105 cells per well and grown overnight. Expression of APOL1/APOL1 risk variants was induced by treating cells with tetracycline for 3, 6, or 9 h either in DMEM or CKCM. There were no changes in cell number during this 9-h period. Media were removed, and cells were rinsed quickly with wash buffer containing 150 mM NaCl, 5 mM glucose, 1 mM MgCl2, 2 mM CaCl2, 0.8 mM NaHPO4, 0.8 mM NaH2PO4, and 25 mM Hepes, pH 7.4. Wash buffer was removed from the plates. Cells were flash frozen on dry ice and shipped to Icagen. Cells were analyzed for K content using XRpro X-ray fluorescence instruments (www. icagen.com), with element signal references to an internal quantitative standard. Signals were averaged from six biological measurements per treatment condition.
Initial Screening of Signaling Pathways with PathScan Signaling Nodes Multi-Target Sandwich ELISA Kit (Cell Signaling).
After induction of 90% confluent T-REx-293 cells with tetracycline for 9 h, cell lysate was prepared with 1× Triton lysis buffer (Cell Signaling). Then, 1:1 diluted lysates (100 μL) were incubated overnight at 4 °C with capture antibodies against Akt, p-AKT (S473), MEK1, p-p38 MAPK (T180/Y182), STAT3, or p-NF-κB p65 (S536). After removal of unbound lysates, detection antibodies against Akt, p-AKT (S473), p-MEK1/2 (S217/221), p38 MAPK, p-STAT3 (Y705), and NF-κB p65 were added to detect the captured target protein. An HRP-conjugated secondary antibody was then used to recognize the bound detection antibody. The amount of bound target protein was quantitated from the magnitude of absorbance read at 450 nm by a spectrophotometer (xMark Microplate Spectrophotometer; Bio-Rad).
IL-6 Withdrawal Assay.
T-REx-293 cells were induced with 50 ng/mL tetracycline for 8 h in serum-free DMEM. An IL-6 withdrawal assay was performed. Briefly, phosphorylation of STAT3 was induced with 10 ng/mL IL-6. After 30 min, IL-6 supplemented media was withdrawn, and cells were rinsed twice with IL-6–free, serum-free DMEM. Cells were then lysed either immediately or after 30 or 60 min. Control cells were not treated with IL-6. Clarified lysates were separated by SDS/PAGE, and levels of p-STAT3 (Y705) and total STAT3 were determined by immunoblotting.
Western Blotting.
Cells were washed with PBS and lysed in 1× Triton lysis buffer (Cell Signaling). Cell lysates were sonicated and cleared by centrifugation for 10 min at 14,000 × g at 4 °C. Proteins (20–50 μg) were heated at 97 °C for 5 min in SDS sample buffer plus β-mercaptoethanol, separated by SDS/PAGE (Bio-Rad). PVDF membranes were blocked in 5% (wt/vol) nonfat milk in phosphate buffered saline with Tween for 1 h and then incubated in primary antibodies (1:1,000) overnight at 4 °C, followed by horseradish peroxidase-conjugated antibodies (1:5,000; Santa Cruz Biotechnology). All primary antibodies were from Cell Signaling, except for antibodies against Flag, beta-actin, LC3B (Sigma), and GAPDH-HRP (GeneTex). Signal was developed (SuperSignal West DURA kit; Fisher Scientific) and imaged (FluorChem E; Bio-Techne). Densitometry was performed using FluorChem Q, Version 3.2.2 (Cell Bioscences).
Immunofluorescence.
Cells grown in chamber slides (Nunc Lab-Tek II CC2 Chamber Slide System; Thermo Scientific) were treated as indicated and then rinsed once with PBS and then fixed with cold methanol for 4 min at −20 °C. Cells were blocked with BlockAid blocking solution (Life Technologies) for 1 h at 37 °C and then incubated overnight with specified primary antibodies at 4 °C, followed by three washes with PBS, and incubation with appropriate secondary antibodies conjugated with Cy3 (1:300; Invitrogen) for 1 h at 37 °C. Cell nuclei were counterstained with Hoechst 33342 (NucBlueLive ReadyProbes Reagent; Life Technologies). Coverslips were mounted, and fluorescent signals were acquired with a confocal laser scanning microscope (LSM 880; Zeiss).
Quantitative Real-Time PCR.
Total RNA was isolated from T-REx-293 cells using an RNeasy plus Mini kit according to the manufacturer’s instructions (Qiagen). One microgram of total RNA was reverse transcribed using the first-strand synthesis system (Roche). Quantitative PCR was set up in SYBR Green PCR master mix (Applied Biosystems) and carried out in an ABI Prism 7300 Real Time PCR System (Applied Biosystems). The primer sequences were 5′-CGGACAGCTTGAACAGAATGT-3′ (GP130-Fwd), 5′-ACCATCCCACTCACACCTCA-3′ (GP130-Rev), 5′-TCCCTGGAGAAGAGCTACGA-3′ (beta-actin-Fwd), and 5′-AGCACTGTGTTGGCGTACAG (beta-actin-Rev).
Acknowledgments
We thank Anna Besschetnova and Chi-Wing Chow for help and advice. This work was supported by NIH Grants MD007898 and MD007092 (to M.R.P, D.J.F., and S.L.A.), as well as by grants from the NephCure and Ellison Foundations (to M.R.P.). O.A.O. and J.H.S. were supported in part by NIH Grant T32-DK007199. O.A.O. was also supported by NIH Grant T32-DK07540.
Footnotes
Conflict of interest statement: M.R.P. and D.J.F. have filed patents related to APOL1-associated kidney disease, and D.J.F. and M.R.P. own equity in ApoLo1 Bio, LLC.
This article contains supporting information online at www.pnas.org/lookup/suppl/doi:10.1073/pnas.1522913113/-/DCSupplemental.
References
- 1.Genovese G, et al. Association of trypanolytic ApoL1 variants with kidney disease in African Americans. Science. 2010;329(5993):841–845. doi: 10.1126/science.1193032. [DOI] [PMC free article] [PubMed] [Google Scholar]
- 2.Genovese G, Friedman DJ, Pollak MR. APOL1 variants and kidney disease in people of recent African ancestry. Nat Rev Nephrol. 2013;9(4):240–244. doi: 10.1038/nrneph.2013.34. [DOI] [PubMed] [Google Scholar]
- 3.Tzur S, et al. Missense mutations in the APOL1 gene are highly associated with end stage kidney disease risk previously attributed to the MYH9 gene. Hum Genet. 2010;128(3):345–350. doi: 10.1007/s00439-010-0861-0. [DOI] [PMC free article] [PubMed] [Google Scholar]
- 4.Kasembeli AN, et al. APOL1 risk variants are strongly associated with HIV-associated nephropathy in Black South Africans. J Am Soc Nephrol. 2015;26(11):2882–2890. doi: 10.1681/ASN.2014050469. [DOI] [PMC free article] [PubMed] [Google Scholar]
- 5.Larsen CP, Beggs ML, Saeed M, Walker PD. Apolipoprotein L1 risk variants associate with systemic lupus erythematosus-associated collapsing glomerulopathy. J Am Soc Nephrol. 2013;24(5):722–725. doi: 10.1681/ASN.2012121180. [DOI] [PMC free article] [PubMed] [Google Scholar]
- 6.Parsa A, et al. 2013. APOL1 risk variants, race, and progression of chronic kidney disease. N Engl J Med 369(23):2183–2196.
- 7.Kanji Z, et al. Genetic variation in APOL1 associates with younger age at hemodialysis initiation. J Am Soc Nephrol. 2011;22(11):2091–2097. doi: 10.1681/ASN.2010121234. [DOI] [PMC free article] [PubMed] [Google Scholar]
- 8.Kopp JB, et al. APOL1 genetic variants in focal segmental glomerulosclerosis and HIV-associated nephropathy. J Am Soc Nephrol. 2011;22(11):2129–2137. doi: 10.1681/ASN.2011040388. [DOI] [PMC free article] [PubMed] [Google Scholar]
- 9.Friedman DJ, Kozlitina J, Genovese G, Jog P, Pollak MR. Population-based risk assessment of APOL1 on renal disease. J Am Soc Nephrol. 2011;22(11):2098–2105. doi: 10.1681/ASN.2011050519. [DOI] [PMC free article] [PubMed] [Google Scholar]
- 10.Friedman DJ, Pollak MR. Genetics of kidney failure and the evolving story of APOL1. J Clin Invest. 2011;121(9):3367–3374. doi: 10.1172/JCI46263. [DOI] [PMC free article] [PubMed] [Google Scholar]
- 11.Ulasi II, et al. High population frequencies of APOL1 risk variants are associated with increased prevalence of non-diabetic chronic kidney disease in the Igbo people from south-eastern Nigeria. Nephron Clin Pract. 2013;123(1-2):123–128. doi: 10.1159/000353223. [DOI] [PubMed] [Google Scholar]
- 12.Cheng D, et al. Biogenesis and cytotoxicity of APOL1 renal risk variant proteins in hepatocytes and hepatoma cells. J Lipid Res. 2015;56(8):1583–1593. doi: 10.1194/jlr.M059733. [DOI] [PMC free article] [PubMed] [Google Scholar]
- 13.Lan X, et al. APOL1 risk variants enhance podocyte necrosis through compromising lysosomal membrane permeability. Am J Physiol Renal Physiol. 2014;307(3):F326–F336. doi: 10.1152/ajprenal.00647.2013. [DOI] [PMC free article] [PubMed] [Google Scholar]
- 14.Lan X, et al. Protein domains of APOL1 and its risk variants. Exp Mol Pathol. 2015;99(1):139–144. doi: 10.1016/j.yexmp.2015.06.003. [DOI] [PMC free article] [PubMed] [Google Scholar]
- 15.Heneghan JF, et al. 2015. BH3 domain-independent apolipoprotein L1 toxicity rescued by BCL2 pro-survival proteins. A J Physiol Cell Physiol 309(5):C332–C347.
- 16.Zhaorigetu S, Wan G, Kaini R, Jiang Z, Hu CA. ApoL1, a BH3-only lipid-binding protein, induces autophagic cell death. Autophagy. 2008;4(8):1079–1082. doi: 10.4161/auto.7066. [DOI] [PMC free article] [PubMed] [Google Scholar]
- 17.Thomson R, Finkelstein A. Human trypanolytic factor APOL1 forms pH-gated cation-selective channels in planar lipid bilayers: Relevance to trypanosome lysis. Proc Natl Acad Sci USA. 2015;112(9):2894–2899. doi: 10.1073/pnas.1421953112. [DOI] [PMC free article] [PubMed] [Google Scholar]
- 18.Molina-Portela MdelP, Lugli EB, Recio-Pinto E, Raper J. Trypanosome lytic factor, a subclass of high-density lipoprotein, forms cation-selective pores in membranes. Mol Biochem Parasitol. 2005;144(2):218–226. doi: 10.1016/j.molbiopara.2005.08.018. [DOI] [PubMed] [Google Scholar]
- 19.Gonzalez MR, et al. Pore-forming toxins induce multiple cellular responses promoting survival. Cell Microbiol. 2011;13(7):1026–1043. doi: 10.1111/j.1462-5822.2011.01600.x. [DOI] [PubMed] [Google Scholar]
- 20.Warny M, et al. p38 MAP kinase activation by Clostridium difficile toxin A mediates monocyte necrosis, IL-8 production, and enteritis. J Clin Invest. 2000;105(8):1147–1156. doi: 10.1172/JCI7545. [DOI] [PMC free article] [PubMed] [Google Scholar]
- 21.Warny M, Kelly CP. Monocytic cell necrosis is mediated by potassium depletion and caspase-like proteases. Am J Physiol. 1999;276(3 Pt 1):C717–C724. doi: 10.1152/ajpcell.1999.276.3.C717. [DOI] [PubMed] [Google Scholar]
- 22.Kloft N, et al. Pore-forming toxins activate MAPK p38 by causing loss of cellular potassium. Biochem Biophys Res Commun. 2009;385(4):503–506. doi: 10.1016/j.bbrc.2009.05.121. [DOI] [PubMed] [Google Scholar]
- 23.Gurcel L, Abrami L, Girardin S, Tschopp J, van der Goot FG. Caspase-1 activation of lipid metabolic pathways in response to bacterial pore-forming toxins promotes cell survival. Cell. 2006;126(6):1135–1145. doi: 10.1016/j.cell.2006.07.033. [DOI] [PubMed] [Google Scholar]
- 24.Khatua AK, et al. Exon 4-encoded sequence is a major determinant of cytotoxicity of apolipoprotein L1. Am J Physiol Cell Physiol. 2015;309(1):C22–C37. doi: 10.1152/ajpcell.00384.2014. [DOI] [PMC free article] [PubMed] [Google Scholar]
- 25.Wan G, et al. Apolipoprotein L1, a novel Bcl-2 homology domain 3-only lipid-binding protein, induces autophagic cell death. J Biol Chem. 2008;283(31):21540–21549. doi: 10.1074/jbc.M800214200. [DOI] [PMC free article] [PubMed] [Google Scholar]
- 26.Radtke S, et al. Cross-regulation of cytokine signalling: Pro-inflammatory cytokines restrict IL-6 signalling through receptor internalisation and degradation. J Cell Sci. 2010;123(Pt 6):947–959. doi: 10.1242/jcs.065326. [DOI] [PubMed] [Google Scholar]
- 27.Brancho D, et al. Mechanism of p38 MAP kinase activation in vivo. Genes Dev. 2003;17(16):1969–1978. doi: 10.1101/gad.1107303. [DOI] [PMC free article] [PubMed] [Google Scholar]
- 28.Enslen H, Brancho DM, Davis RJ. Molecular determinants that mediate selective activation of p38 MAP kinase isoforms. EMBO J. 2000;19(6):1301–1311. doi: 10.1093/emboj/19.6.1301. [DOI] [PMC free article] [PubMed] [Google Scholar]
- 29.Lee JC, et al. A protein kinase involved in the regulation of inflammatory cytokine biosynthesis. Nature. 1994;372(6508):739–746. doi: 10.1038/372739a0. [DOI] [PubMed] [Google Scholar]
- 30.Davies SP, Reddy H, Caivano M, Cohen P. Specificity and mechanism of action of some commonly used protein kinase inhibitors. Biochem J. 2000;351(Pt 1):95–105. doi: 10.1042/0264-6021:3510095. [DOI] [PMC free article] [PubMed] [Google Scholar]
- 31.Whitmarsh AJ, Yang SH, Su MS, Sharrocks AD, Davis RJ. Role of p38 and JNK mitogen-activated protein kinases in the activation of ternary complex factors. Mol Cell Biol. 1997;17(5):2360–2371. doi: 10.1128/mcb.17.5.2360. [DOI] [PMC free article] [PubMed] [Google Scholar]
- 32.Breitwieser W, et al. Feedback regulation of p38 activity via ATF2 is essential for survival of embryonic liver cells. Genes Dev. 2007;21(16):2069–2082. doi: 10.1101/gad.430207. [DOI] [PMC free article] [PubMed] [Google Scholar]
- 33.Pérez-Morga D, et al. Apolipoprotein L-I promotes trypanosome lysis by forming pores in lysosomal membranes. Science. 2005;309(5733):469–472. doi: 10.1126/science.1114566. [DOI] [PubMed] [Google Scholar]
- 34.Vanhamme L, et al. Apolipoprotein L-I is the trypanosome lytic factor of human serum. Nature. 2003;422(6927):83–87. doi: 10.1038/nature01461. [DOI] [PubMed] [Google Scholar]
- 35.Papini E, Sandoná D, Rappuoli R, Montecucco C. On the membrane translocation of diphtheria toxin: At low pH the toxin induces ion channels on cells. EMBO J. 1988;7(11):3353–3359. doi: 10.1002/j.1460-2075.1988.tb03207.x. [DOI] [PMC free article] [PubMed] [Google Scholar]
- 36.van der Goot FG, Didat N, Pattus F, Dowhan W, Letellier L. 1993. Role of acidic lipids in the translocation and channel activity of colicins A and N in Escherichia coli cells. Eur J Biochem 213(1):217–221. [DOI] [PubMed]
- 37.Paunesku T, Vogt S, Maser J, Lai B, Woloschak G. X-ray fluorescence microprobe imaging in biology and medicine. J Cell Biochem. 2006;99(6):1489–1502. doi: 10.1002/jcb.21047. [DOI] [PubMed] [Google Scholar]
- 38.Nalband DM, Warner BP, Zahler NH, Kirshenbaum K. Rapid identification of metal-binding peptoid oligomers by on-resin X-ray fluorescence screening. Biopolymers. 2014;102(5):407–415. doi: 10.1002/bip.22528. [DOI] [PubMed] [Google Scholar]
- 39.Haschke M. Laboratory Micro-X-Ray Fluorescence Spectroscopy: Instrumentation and Applications. Springer; Cham, Switzerland: 2014. [Google Scholar]
- 40.Ma FY, Liu J, Nikolic-Paterson DJ. 2009. The role of stress-activated protein kinase signaling in renal pathophysiology. Braz J Med Biol Res 42(1):29–37.
- 41.Stambe C, Nikolic-Paterson DJ, Hill PA, Dowling J, Atkins RC. p38 Mitogen-activated protein kinase activation and cell localization in human glomerulonephritis: correlation with renal injury. J Am Soc Nephrol. 2004;15(2):326–336. doi: 10.1097/01.asn.0000108520.63445.e0. [DOI] [PubMed] [Google Scholar]
- 42.De Borst MH, et al. Glomerular and tubular induction of the transcription factor c-Jun in human renal disease. J Pathol. 2007;213(2):219–228. doi: 10.1002/path.2228. [DOI] [PubMed] [Google Scholar]
- 43.Koshikawa M, et al. Role of p38 mitogen-activated protein kinase activation in podocyte injury and proteinuria in experimental nephrotic syndrome. J Am Soc Nephrol. 2005;16(9):2690–2701. doi: 10.1681/ASN.2004121084. [DOI] [PubMed] [Google Scholar]
- 44.Willette RN, et al. Differential effects of p38 mitogen-activated protein kinase and cyclooxygenase 2 inhibitors in a model of cardiovascular disease. J Pharmacol Exp Ther. 2009;330(3):964–970. doi: 10.1124/jpet.109.154443. [DOI] [PubMed] [Google Scholar]
- 45.Pengal R, et al. Inhibition of the protein kinase MK-2 protects podocytes from nephrotic syndrome-related injury. Am J Physiol Renal Physiol. 2011;301(3):F509–F519. doi: 10.1152/ajprenal.00661.2010. [DOI] [PMC free article] [PubMed] [Google Scholar]
- 46.Guess AJ, et al. Crucial roles of the protein kinases MK2 and MK3 in a mouse model of glomerulonephritis. PLoS One. 2013;8(1):e54239. doi: 10.1371/journal.pone.0054239. [DOI] [PMC free article] [PubMed] [Google Scholar]
- 47.Kapasi AA, Patel G, Franki N, Singhal PC. HIV-1 gp120-induced tubular epithelial cell apoptosis is mediated through p38-MAPK phosphorylation. Mol Med. 2002;8(11):676–685. [PMC free article] [PubMed] [Google Scholar]
- 48.Abkhezr M, Dryer SE. STAT3 regulates steady-state expression of synaptopodin in cultured mouse podocytes. Mol Pharmacol. 2015;87(2):231–239. doi: 10.1124/mol.114.094508. [DOI] [PubMed] [Google Scholar]
- 49.Nagayama Y, et al. Gp130-dependent signaling in the podocyte. Am J Physiol Renal Physiol. 2014;307(3):F346–F355. doi: 10.1152/ajprenal.00620.2013. [DOI] [PubMed] [Google Scholar]
- 50.Gu L, et al. Deletion of podocyte STAT3 mitigates the entire spectrum of HIV-1-associated nephropathy. AIDS. 2013;27(7):1091–1098. doi: 10.1097/QAD.0b013e32835f1ea1. [DOI] [PMC free article] [PubMed] [Google Scholar]
- 51.He JC, et al. Nef stimulates proliferation of glomerular podocytes through activation of Src-dependent Stat3 and MAPK1,2 pathways. J Clin Invest. 2004;114(5):643–651. doi: 10.1172/JCI21004. [DOI] [PMC free article] [PubMed] [Google Scholar]
- 52.Taylor HE, Khatua AK, Popik W. The innate immune factor apolipoprotein L1 restricts HIV-1 infection. J Virol. 2014;88(1):592–603. doi: 10.1128/JVI.02828-13. [DOI] [PMC free article] [PubMed] [Google Scholar]
- 53.Markowitz GS, Nasr SH, Stokes MB, D’Agati VD. Treatment with IFN-alpha, -beta, or -gamma is associated with collapsing focal segmental glomerulosclerosis. Clin J Am Soc Nephrol. 2010;5(4):607–615. doi: 10.2215/CJN.07311009. [DOI] [PMC free article] [PubMed] [Google Scholar]
- 54.Nichols B, et al. Innate immunity pathways regulate the nephropathy gene Apolipoprotein L1. Kidney Int. 2015;87(2):332–342. doi: 10.1038/ki.2014.270. [DOI] [PMC free article] [PubMed] [Google Scholar]
- 55.Madhavan SM, et al. APOL1 localization in normal kidney and nondiabetic kidney disease. J Am Soc Nephrol. 2011;22(11):2119–2128. doi: 10.1681/ASN.2011010069. [DOI] [PMC free article] [PubMed] [Google Scholar]
- 56.Bast A, et al. Caspase-1-dependent and -independent cell death pathways in Burkholderia pseudomallei infection of macrophages. PLoS Pathog. 2014;10(3):e1003986. doi: 10.1371/journal.ppat.1003986. [DOI] [PMC free article] [PubMed] [Google Scholar]
- 57.Xong HV, et al. A VSG expression site-associated gene confers resistance to human serum in Trypanosoma rhodesiense. Cell. 1998;95(6):839–846. doi: 10.1016/s0092-8674(00)81706-7. [DOI] [PubMed] [Google Scholar]
- 58.Pollak MR. Familial FSGS. Adv Chronic Kidney Dis. 2014;21(5):422–425. doi: 10.1053/j.ackd.2014.06.001. [DOI] [PMC free article] [PubMed] [Google Scholar]
- 59.Thiel S, et al. Constitutive internalization and association with adaptor protein-2 of the interleukin-6 signal transducer gp130. FEBS Lett. 1998;441(2):231–234. doi: 10.1016/s0014-5793(98)01559-2. [DOI] [PubMed] [Google Scholar]


