Significance
Why does the brain store memories of some things but not others? At a cognitive level, attention provides an explanation: What aspects of an experience we focus on determines what information is perceived and available for encoding. But the mechanism of how attention alters memory formation at the neural level is unknown. With high-resolution neuroimaging, we show that attention alters the state of a key brain structure for memory, the hippocampus, and that the extent to which this occurs predicts whether the attended information gets stored in memory. The dependence of hippocampal encoding on attentional states reveals the broad involvement of the hippocampus in multiple cognitive processes, and highlights that the workings of the hippocampus are under our control.
Keywords: long-term memory, selective attention, hippocampal subfields, medial temporal lobe, representational stability
Abstract
Attention influences what is later remembered, but little is known about how this occurs in the brain. We hypothesized that behavioral goals modulate the attentional state of the hippocampus to prioritize goal-relevant aspects of experience for encoding. Participants viewed rooms with paintings, attending to room layouts or painting styles on different trials during high-resolution functional MRI. We identified template activity patterns in each hippocampal subfield that corresponded to the attentional state induced by each task. Participants then incidentally encoded new rooms with art while attending to the layout or painting style, and memory was subsequently tested. We found that when task-relevant information was better remembered, the hippocampus was more likely to have been in the correct attentional state during encoding. This effect was specific to the hippocampus, and not found in medial temporal lobe cortex, category-selective areas of the visual system, or elsewhere in the brain. These findings provide mechanistic insight into how attention transforms percepts into memories.
Why do we remember some things and not others? Consider a recent experience, such as the last movie complex you visited, flight you took, or restaurant at which you ate. More information was available to your senses than was stored in memory, such as the theater number of the movie, the faces of other passengers, and the color of the napkins. The selective nature of memory is adaptive, because encoding carries a cost: newly stored memories can interfere with existing ones and with our ability to learn new information in the future. What is the mechanism by which information gets selected for encoding?
Attention offers a means of prioritizing information in the environment that is most relevant to behavioral goals. Attended information, in turn, has stronger control over behavior and is represented more robustly in the brain (1, 2). If attention gates which information we perceive and act upon, then it may also determine what information we remember. Indeed, attention during encoding affects both subsequent behavioral expressions of memory (3) and the extent to which activity levels in the brain predict memory formation (4–7). Although these findings suggest that attention modulates processes related to memory, how it does so is unclear.
According to biased competition and other theories of attention (1, 8), task-relevant stimuli are more robustly represented in sensory systems, and thus fare better in competition with task-irrelevant stimuli for downstream processing. Indeed, there is extensive evidence that attention enhances overall activity in visual areas that represent attended vs. unattended features and locations (2, 9). Moreover, attention modulates cortical areas of the medial temporal lobe that provide input to the hippocampus (10–12).
Attention can also modulate the hippocampus itself. Specifically, there is growing evidence that attention stabilizes distributed hippocampal representations of task-relevant information (10, 13, 14). For example, in rodents, distinct ensembles of hippocampal place cells activate when different spatial reference frames are task-relevant (15, 16; see also ref. 17) and place fields are more reliable when animals engage in a task for which spatial information is important (18, 19). Such representational stability has been found in the hippocampus more generally, such as for olfactory representations when odor information is task-relevant (19). In humans, attention similarly modulates patterns of hippocampal activity, but over voxels measured with functional magnetic resonance imaging (fMRI); for example, attention to different kinds of information induces distinct activity patterns in all hippocampal subfields (10).
Thus, attention can modulate sensory cortex, medial temporal lobe cortex, and the hippocampus. Here, we explored which of these neural signatures of attention is most closely linked to the formation of memory. We hypothesized that attention induces state-dependent patterns of activity in the cortex and hippocampus, but that representational stability in the hippocampus itself may be the mechanism by which attention enhances memory. That is, attention serves to focus and maintain hippocampal processing on one particular aspect of a complex stimulus, strengthening the resulting memory trace and improving later recognition. We also hypothesized that the interplay between the hippocampus and visual processing regions would be closely related to memory formation, and thus examined the coupling of attentional states across these regions and its relationship to memory.
To test these hypotheses, we designed a three-part study that allowed us to identify attentional-state representations in the hippocampus (phase 1) and then examine whether more evidence for the goal-relevant attentional state during the encoding of new information (phase 2) predicted later success in remembering that information (phase 3). We describe each of these three phases in more detail below.
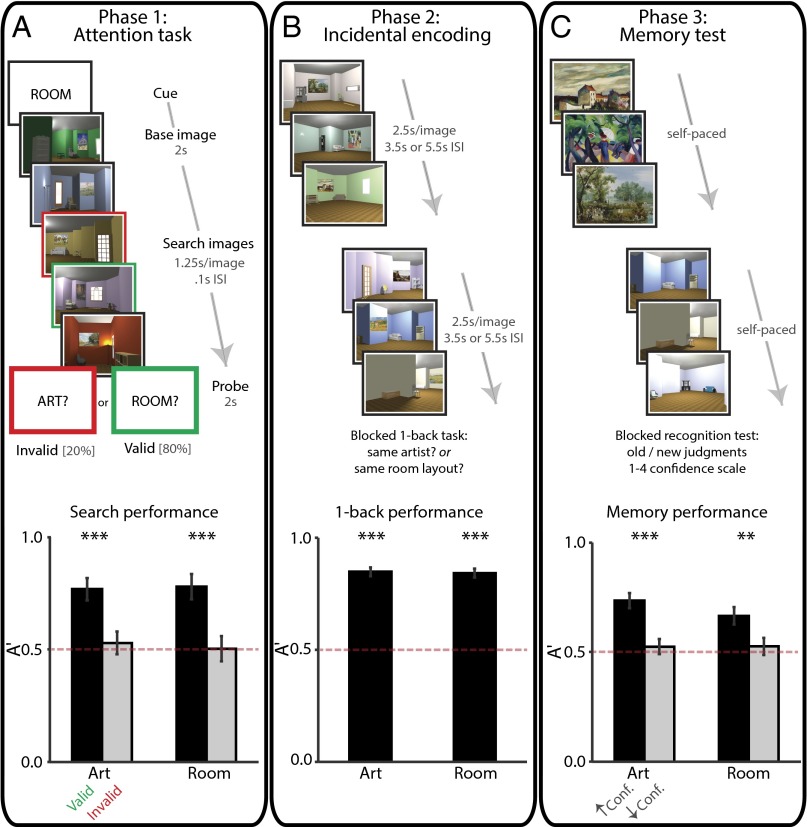
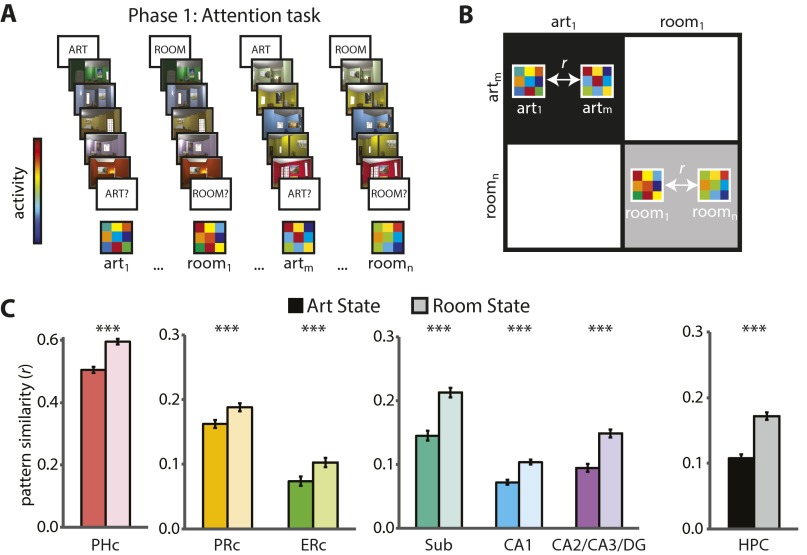
Phase 1 took place during fMRI and consisted of an “art gallery” paradigm (10). Participants were cued to attend to either the paintings or room layouts in a rendered gallery (Fig. 1A). After the cue, they were shown a “base image” (a room with a painting) and then searched a stream of other images for a painting from the same artist as the painting in the base image (art state) or for a room with the same layout as the room in the base image (room state). After the search stream, participants were probed about whether there had been a matching painting or room. The comparison of valid trials (e.g., cued for painting, probed for painting) vs. invalid trials (e.g., cued for painting, probed for layout) provided a behavioral measure of attention. Specifically, if attention was engaged by the cue, participants should be better at detecting matches on valid trials. Importantly, identical images were used for both tasks, allowing us to isolate the effects of top-down attention. We used phase 1 to identify neural representations of the two attentional states in each hippocampal subfield—that is, “template” patterns of activity for each of the art and room states.
Fig. 1.
Task design and behavioral results. The study consisted of three phases. In phase 1 (A, Upper), participants performed a task in which they paid attention to paintings or rooms on different trials. One room trial is illustrated. For visualization, the cued match is outlined in green and the uncued match in red. Task performance (A, Lower) is shown as sensitivity in making present/absent judgments as a function of attentional state and probe type. Error bars depict ±1 SEM of the within-participant valid vs. invalid difference. In phase 2 (B, Upper), participants performed an incidental encoding task in which they viewed trial-unique images and looked for one-back repetitions of artists or room layouts in different blocks. Task performance (B, Lower) is shown as sensitivity in detecting one-back repetitions as a function of attentional state. Error bars depict ±1 SEM. In phase 3 (C, Upper), participants’ memory for the attended aspect of phase 2 images was tested. Memory performance (C, Lower) is shown as sensitivity in identifying previously studied items, as a function of response confidence and attentional state. Error bars depict ±1 SEM of the within-participant high- vs. low-confidence difference. Dashed line indicates chance performance. **P < 0.01, ***P < 0.001.
Phase 2 also took place during fMRI and consisted of an incidental encoding paradigm. Participants performed a cover task while being exposed to a new set of trial-unique images (rooms with paintings). The cover task was used to manipulate art vs. room states (Fig. 1B): in art blocks, participants looked for two paintings in a row painted by the same artist; in room blocks, participants looked for two rooms in a row with the same layout. Because each image contained both a painting and a layout, top-down attention was needed to select the information relevant for the current block and to ignore irrelevant information. The demands for selection and comparison were thus similar to those of the art and room states in phase 1. For each phase 2 encoding trial, we quantified the match between the state of the hippocampus on that trial and the attentional-state representations defined from phase 1. Specifically, we correlated the activity pattern on each trial with the template that was relevant for the current block (e.g., art state during art block) and with the template that was irrelevant for the current block (e.g., room state during art block). We measured the extent to which the hippocampus was in the correct attentional state by calculating the difference of the relevant minus irrelevant pattern correlations.
Phase 3 was conducted outside the scanner and involved a recognition memory test. Task-relevant aspects of the images from phase 2 (i.e., paintings in the art block, layouts in the room block) were presented one at a time and participants made memory judgments on a four-point scale: old or new, with high or low confidence (Fig. 1C). The test was divided into blocks: in the art block, old and new paintings were presented in isolation without background rooms; in the room block, old and new rooms were presented without paintings. To increase reliance on the kind of detailed episodic memory supported by the hippocampus, the memory test included a highly similar lure for each encoded item (20, 21): a novel painting from the same artist or the same layout from a novel perspective, for the art and room blocks, respectively. We used memory performance on this task to sort the fMRI data from phase 2, which allowed us to relate attentional states during encoding to subsequent memory (22, 23).
To summarize our hypothesis: (i) Attention should modulate representational stability in the hippocampus, inducing distinct activity patterns for each of the art and room states (10). (ii) If attention is properly oriented during encoding, the hippocampus should be more strongly in the task-relevant state. (iii) This will result in a greater difference in correlation between the pattern of activity at encoding and the predefined template patterns for the task-relevant vs. task-irrelevant states. (iv) A greater correlation difference should be associated with better processing of task-relevant stimulus information, better encoding of that information into long-term memory, and a higher likelihood of later retrieval.
We also explored the roles of different hippocampal subfields. In our prior study, one hippocampal subfield region of interest (ROI) in particular—comprising subfields CA2/3 and dentate gyrus (DG)—showed behaviorally relevant attentional modulation (10). This finding, together with work linking univariate activity and pattern similarity in CA2/CA3/DG to memory encoding (24–27), raised the possibility that this region might be especially important for the attentional modulation of episodic memory behavior. Thus, we hypothesized that the attentional state of CA2/CA3/DG during encoding would predict the formation of memory. Another candidate for the attentional modulation of memory is CA1. Activity in the CA1 subfield is modulated by goal states during memory retrieval (28), and this region serves as a “comparator” of expectations—which may be induced by attentional cues—and percepts (29, 30).
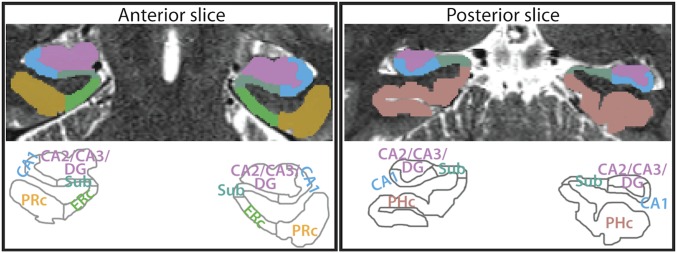
To test these hypotheses, we acquired high-resolution fMRI data and manually segmented CA1 and a combined CA2/CA3/DG ROI in the hippocampus (Fig. 2). We also defined an ROI for the remaining subfield, the subiculum, for completeness and to mirror prior high-resolution fMRI studies of the hippocampus (31). We report results for these three subfield ROIs, as well as for a single hippocampal ROI collapsing across subfield labels. Moreover, motivated by computational theories and work with animal models, which highlight different roles for CA3 and DG in memory (32), as well as recent human neuroimaging studies that have examined these regions separately (33, 34), we report supplemental exploratory analyses for separate CA2/3 and DG ROIs (Fig. S1). To test the specificity of effects in the hippocampus, we also defined ROIs in the medial temporal lobe (MTL) cortex, including entorhinal cortex (ERc), perirhinal cortex (PRc), and parahippocampal cortex (PHc), and in category-selective areas of occipitotemporal and parietal cortices. Finally, in follow-up analyses of which other regions support attentional modulation of hippocampal encoding, we examined functional connectivity of multivariate representations in the hippocampus with those in MTL cortex and category-selective areas.
Fig. 2.
MTL ROIs. Example segmentation from one participant is depicted for one anterior and one posterior slice. ROIs consisted of three hippocampal regions [subiculum (Sub), CA1, and CA2/CA3/DG], and three MTL cortical regions (ERc, PRc, and PHc). We also conducted analyses across the hippocampus as a single ROI, and exploratory analyses with separate CA2/3 and DG ROIs (Fig. S1). For segmentation guide, see ref. 10.
Fig. S1.
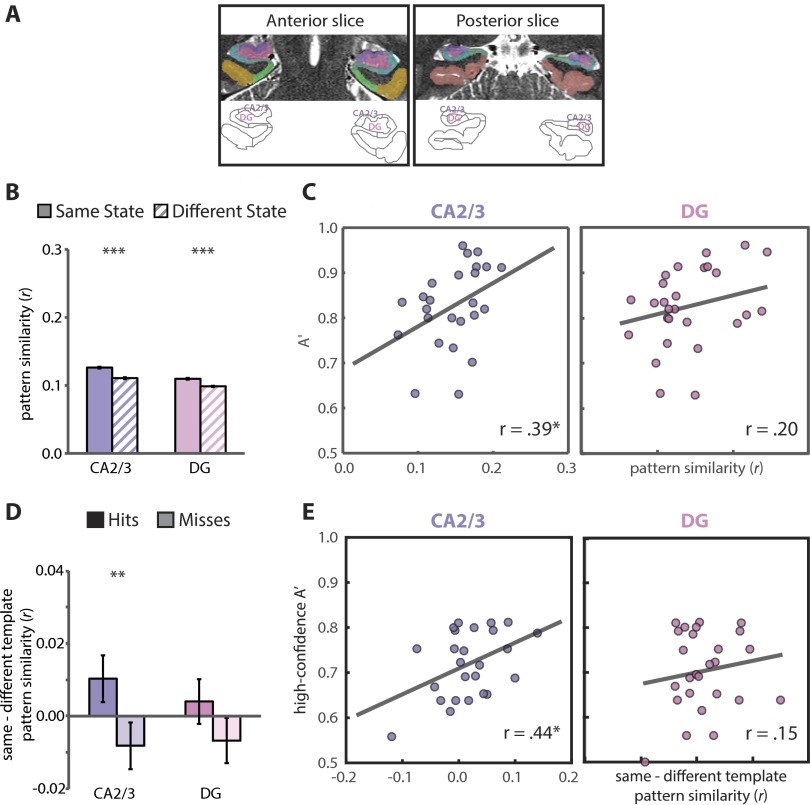
Comparison of attention and memory effects in CA2/3 and DG. (A) We conducted exploratory analyses with separate ROIs for CA2/3 and DG, shown here for an example participant. We conducted these analyses because of reported dissociations across CA2/3 and DG with 3T fMRI (33, 34). These analyses should be interpreted with caution, however, because separation of CA2/3 and DG signals is difficult, even with the 1.5-mm isotropic voxels used in the present study. Specifically, the intertwined nature of these subfields means that a functional voxel could include both CA2/3 and DG. Thus, in the main text, we used the standard approach of collapsing across CA2, CA3, and DG in a single ROI (31). Here we report separated analyses for completeness and to contribute data to the discussion of this issue in the field. (B) In the phase 1 attention task, both regions showed state-dependent patterns of activity, with more similar patterns of activity for trials of the same vs. different states (CA2/3: t31 = 7.97, P < 0.0001; DG: t31 = 6.53, P < 0.0001) (compare with Fig. 3C). Error bars depict ±1 SEM of the within-participant same vs. different state difference. (C) In the phase 1 attention task, individual differences in room-state pattern similarity in CA2/3 were correlated with individual differences in behavioral performance (A′) on valid trials of the room task (r23 = 0.39, P = 0.05). This effect was not found in DG [r25 = 0.20, P = 0.31; note that degrees-of-freedom differ because of the robust correlation methods used (60)]. Additionally, the CA2/3 correlation was specific to room-state pattern similarity and room-state behavior: room-state activity did not predict room-state behavior (r29 = −0.03, P = 0.87) and room-state pattern similarity did not predict art-state behavior (r27 = 0.11, P = 0.58). Finally, controlling for room-state pattern similarity, art-state pattern similarity did not predict room-state behavior (r23 = 0.12, P = 0.58). (D) During the phase 2 encoding task, there was greater pattern similarity with the task-relevant vs. task-irrelevant state template for subsequent hits vs. misses in CA2/3 (F1,30 = 7.86, P = 0.009), but this effect was not reliable in DG (F1,30 = 2.82, P = 0.10) (compare with Fig. 4D). Error bars depict ±1 SEM of the within-participant hits vs. misses difference. (E) Individual differences in room memory were positively correlated with the match between CA2/3 encoding activity patterns and the room- vs. art-state template (r23 = 0.44, P = 0.03). This correlation was not reliable in DG [r24 = 0.15, P = 0.46; note that degrees-of-freedom differ because of the robust correlation methods used (60)]. *P = 0.05, **P < 0.01, ***P < 0.001.
Results
Behavioral Performance.
Phase 1: Attention task.
Sensitivity in detecting matches (Fig. 1A, Lower) was above chance (0.5) on valid trials (art: t31 = 15.30, P < 0.0001; room: t31 = 11.48, P < 0.0001) and higher than on invalid trials (art: t31 = 4.55, P < 0.0001; room: t31 = 4.91, P < 0.0001); invalid trials did not differ from chance (art: t31 = 0.65, P = 0.52; room: t31 = 0.09, P = 0.93). This result confirms that participants used the cue to orient attention selectively. There was no difference in sensitivity between the art and room tasks (valid: t31 = 0.46, P = 0.65; invalid t31 = 0.39, P = 0.70).
Phase 2: Incidental encoding.
Sensitivity in detecting one-back targets (Fig. 1B, Lower) was above chance (art: t31 = 20.51, P < 0.0001; room: t31 = 19.13, P < 0.0001) and not different between tasks (t31 = 0.29, P = 0.78).
Phase 3: Memory test.
Sensitivity in detecting old items (Fig. 1C, Lower) was above chance for high-confidence responses (art: t31 = 16.37, P < 0.0001; room: t30 = 6.46, P < 0.0001) and higher than low-confidence responses (art: t31 = 6.22, P < 0.0001; room: t30 = 3.41, P = 0.002); low-confidence responses did not differ from chance (art: t31 = 0.93, P = 0.36; room: t31 = 1.05, P = 0.30). Because only high-confidence responses were sensitive, we defined remembered items (hits) as high-confidence old judgments and forgotten items (misses) as the other responses (following refs. 22 and 23; see also refs. 35 and 36). Sensitivity was higher on the art vs. room tasks for high-confidence responses (t30 = 3.04, P = 0.005) but not low-confidence responses (t31 = 0.05, P = 0.96).
Defining Attentional States.
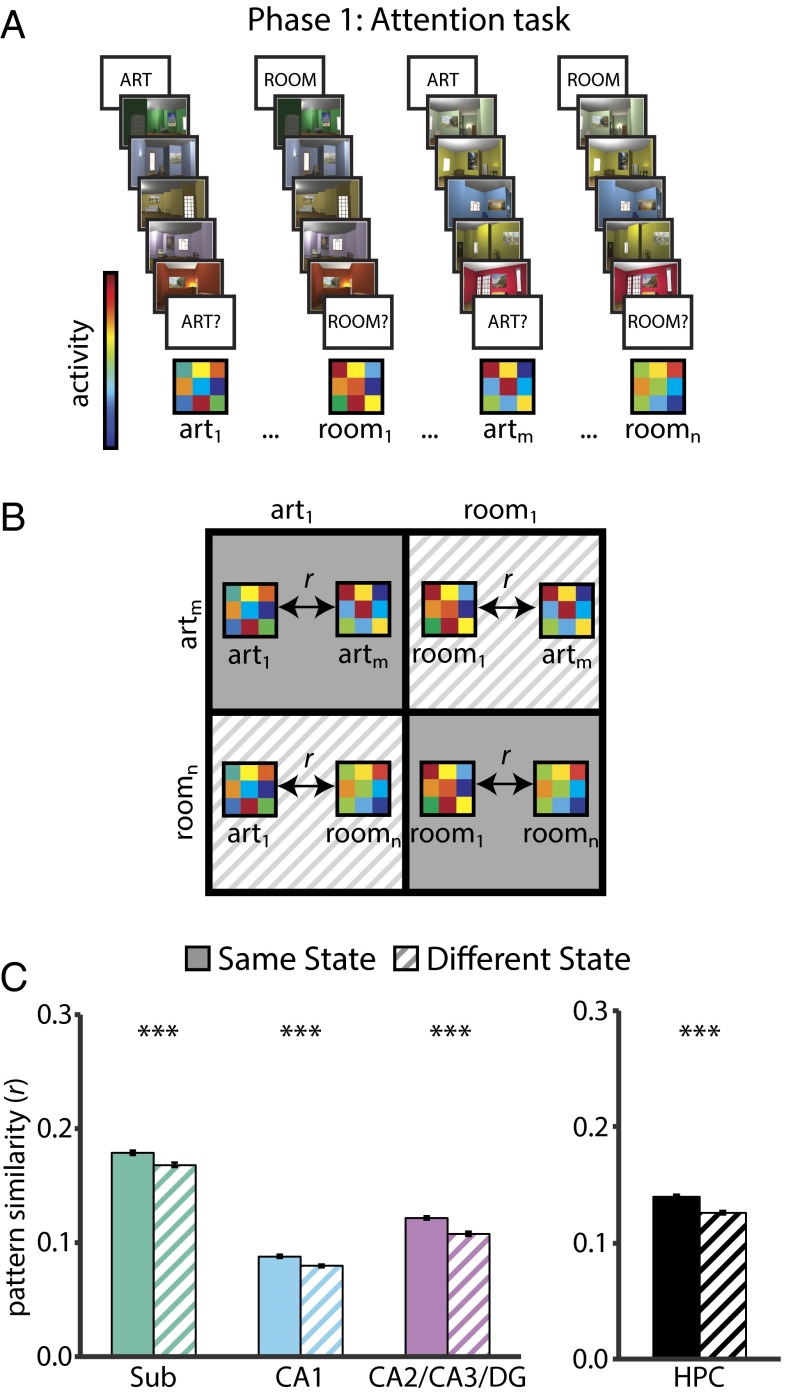
We first confirmed that attentional states were represented in the hippocampus (Fig. 3) by examining correlations between activity patterns for trials of the same vs. different states in phase 1 (10). If attention induces state-dependent activity patterns, there should be greater similarity between trials from the same state compared with trials from different states. This was confirmed in all hippocampal subfields (all Ps < 0.0001). Thus, we defined a template pattern for the art and room attentional states in every ROI by averaging the activity patterns across all trials of the same state. These templates were then correlated with trial-by-trial activity patterns during encoding in phase 2. For additional analyses of the two attentional states, see Figs. S2–S6.
Fig. 3.
State-dependent pattern similarity. (A) BOLD activity evoked in the art and room states (in the phase 1 attention task) was extracted from all voxels in each ROI for each trial. (B) Voxelwise activity patterns were correlated across trials of the same state (i.e., art to art, room to room) and across trials of different states (i.e., art to room). (C) All hippocampal subfields showed greater pattern similarity for same vs. different states, as did the hippocampus considered as a single ROI. In this and all subsequent figures, pattern similarity results are shown as Pearson correlations, but statistical tests were performed after applying the Fisher transformation. Error bars depict ±1 SEM of the within-participant same vs. different state difference. ***P < 0.001.
Fig. S2.
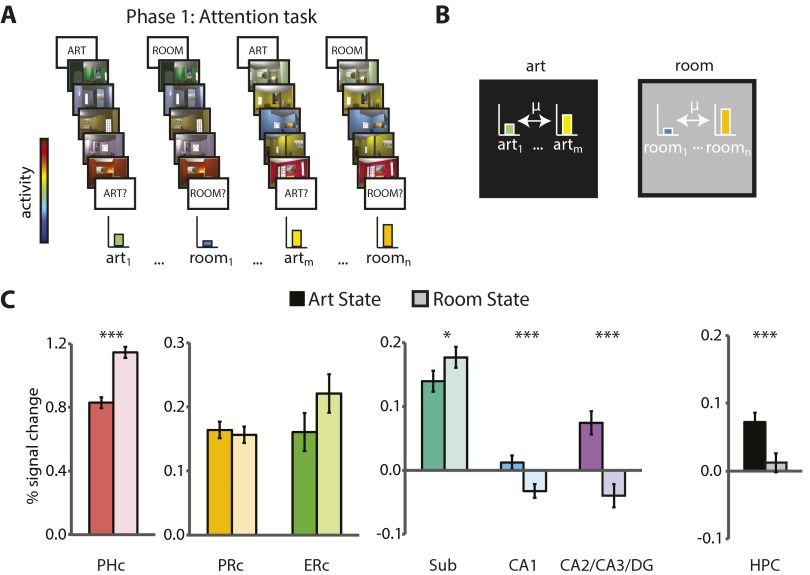
Attentional modulation of univariate activity. (A) BOLD activity evoked on art- and room-state trials was extracted from all voxels in each ROI and averaged across voxels. Baseline corresponds to unmodeled periods of passive viewing of a blank screen. (B) Univariate activity across trials was calculated separately within the art and room states. (C) In the MTL cortex, PHc was more active for the room vs. art state (t31 = 9.06, P < 0.0001). ERc showed a trend in the same direction (t31 = 2.01, P = 0.053), and PRc showed no difference (t31 = 0.59, P = 0.56). In the hippocampus, subiculum was more active for the room vs. art state (t31 = 2.25, P = 0.03), whereas CA1 and CA2/CA3/DG were more active for the art vs. room state (CA1: t31 = 4.21, P = 0.0002; CA2/CA3/DG: t31 = 6.24, P < 0.0001). Considered as a single ROI, the hippocampus was more active for the art vs. room states (t31 = 4.27, P = 0002). Error bars depict ±1 SEM of the within-participant art- vs. room-state difference. Results are shown as Pearson correlations, but statistical tests were performed after Fisher transformation. *P < 0.05, ***P < 0.001.
Fig. S6.
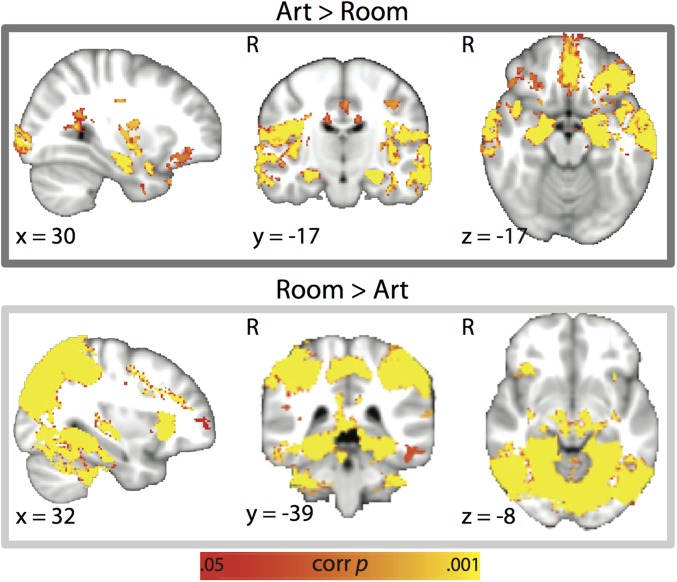
Whole-brain univariate analysis of art vs. room states in the attention task. Regions showing greater activity for the art compared with the room state (Upper) were primarily distributed anteriorly in the brain: bilateral superior temporal sulcus, superior temporal gyrus, middle temporal gyrus, temporal pole, hippocampus, perirhinal cortex, amygdala, putamen, insula, orbitofrontal cortex, medial prefrontal cortex, cingulate gyrus, and occipital pole. Regions showing greater activity for the room compared with the art state (Lower) were primarily distributed posteriorly: bilateral primary visual cortex, thalamus, lateral occipital cortex, lingual gyrus, fusiform gyrus, parahippocampal cortex, precuneus, posterior cingulate/retrosplenial cortex, intraparietal sulcus, inferior parietal lobule, superior parietal lobule, and caudate nucleus. P < 0.05 TFCE-corrected.
Fig. S4.
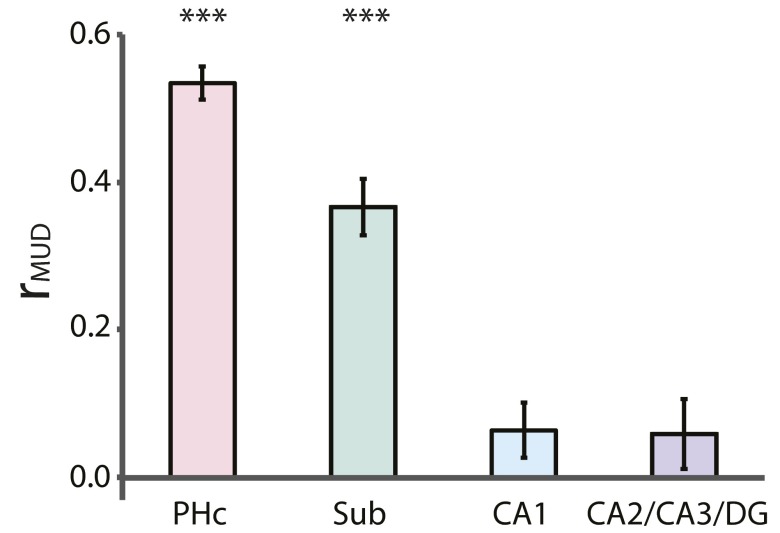
Multivariate-univariate dependence (MUD) analysis. We carried out a MUD analysis (10) to examine the relationship between attentional modulation of univariate activity and pattern similarity for ROIs that showed both effects. The contribution of each voxel to pattern similarity was estimated by normalizing BOLD activity over voxels within an ROI for each trial and computing pairwise products across trials. Voxels with positive products increase pattern similarity and voxels with negative products decrease pattern similarity, in both cases proportional to the magnitude of the product. In each voxel, the products for all pairs of trials were averaged, resulting in one contribution score per voxel. These scores were then correlated across voxels with the average activity level in those voxels to produce an index of the dependence between activity and pattern similarity within each ROI. The PHc and subiculum showed higher univariate activity (Fig. S2) and pattern similarity (Fig. S3) for the room state, and the MUD coefficient was positive (PHc: t31 = 19.06, P < 0.0001; subiculum: t31 = 8.83, P < 0.0001), indicating that these effects were partially driven by modulation of the same voxels. CA1 and CA2/CA3/DG showed lower univariate activity (Fig. S2) and higher pattern similarity (Fig. S3) for the room state. The MUD coefficient for these ROIs was not different from zero (CA1: t31 = 1.76, P = 0.09; CA2/CA3/DG: t31 = 1.12, P = 0.27), indicating that at least partly nonoverlapping sets of voxels made the biggest contributions to these effects. Error bars depict ±1 SEM across participants. Results are shown as Pearson correlations, but statistical tests were performed after Fisher transformation. ***P < 0.001.
Predicting Memory from the Attentional State of the Hippocampus During Encoding.
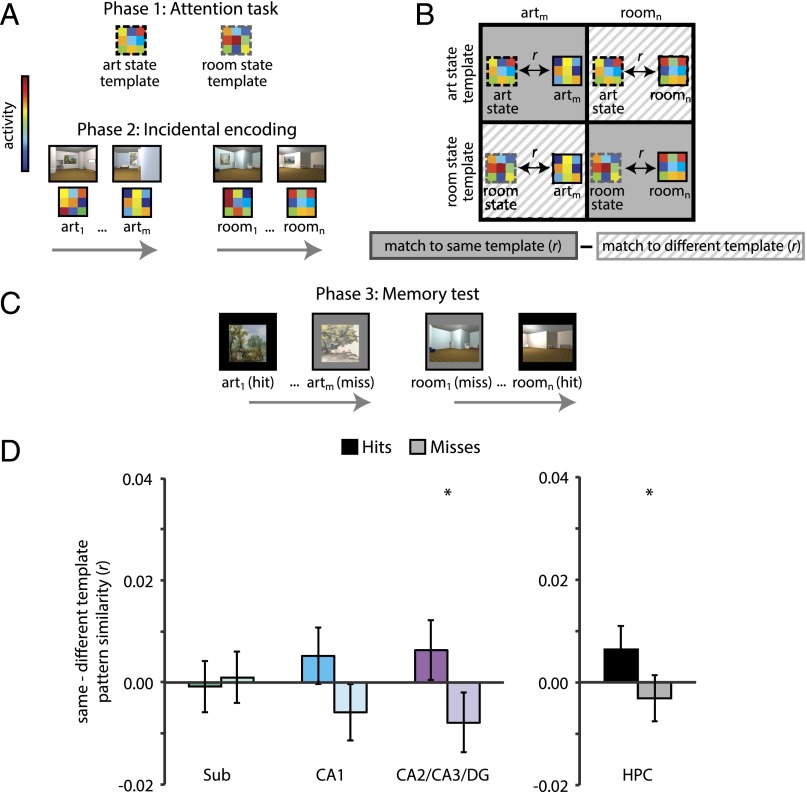
Consistent with our hypothesis, in phase 2 there was a stronger match in CA2/CA3/DG to the task-relevant attentional-state template than to the task-irrelevant template during encoding of items that were subsequently remembered vs. forgotten (F1,30 = 5.72, P = 0.02) (Fig. 4). This effect did not reach significance in either of the other hippocampal subfield ROIs (subiculum: F1,30 = 0.15, P = 0.70; CA1: F1,30 = 3.74, P = 0.06), but remained reliable when considering the hippocampus as a whole (F1,30 = 4.33, P < 0.05). The overall difference in template match during encoding of remembered vs. forgotten items in CA2/CA3/DG, and the hippocampus as a whole, did not differ between art and room tasks (CA2/CA3/DG: F1,30 = 0.01, P = 0.91; hippocampus: F1,30 = 0.02, P = 0.88). Exploratory analyses of separate CA2/3 and DG ROIs showed the same pattern of results in both subfields, but the effects were statistically reliable only in CA2/3 (Fig. S1).
Fig. 4.
Subsequent memory analysis of attentional state in hippocampus. (A) From the phase 1 attention task, mean art- and room-state templates were obtained by averaging activity patterns across all trials of the respective state. From the phase 2 encoding task, the activity pattern for each trial was extracted from each ROI. (B) These trial-specific encoding patterns were correlated with the task-relevant attentional-state template (e.g., art encoding to art template) and the task-irrelevant attentional-state template (e.g., art encoding to room template). The difference of these correlations was the dependent measure of interest. (C) These correlation values were binned according to memory in phase 3. (D) There was greater pattern similarity with the template for the task-relevant vs. -irrelevant state for subsequent hits vs. misses in CA2/CA3/DG, but not subiculum or CA1. This effect remained significant when considering the hippocampus as a single ROI. For analyses with separate CA2/3 and DG ROIs, see Fig. S1. Error bars depict ±1 SEM of the within-participant hits vs. misses difference. *P < 0.05.
What Other Hippocampal Signals Predict Memory?
Is it necessary to consider attentional states to predict memory from the hippocampus during encoding? To assess the selectivity of our findings to the state-template match variable, we examined two additional variables that have been linked to encoding in prior subsequent memory studies: (i) patterns of activity without respect to attentional state (37–39), and (ii) the overall level of univariate activity (5, 23, 40).
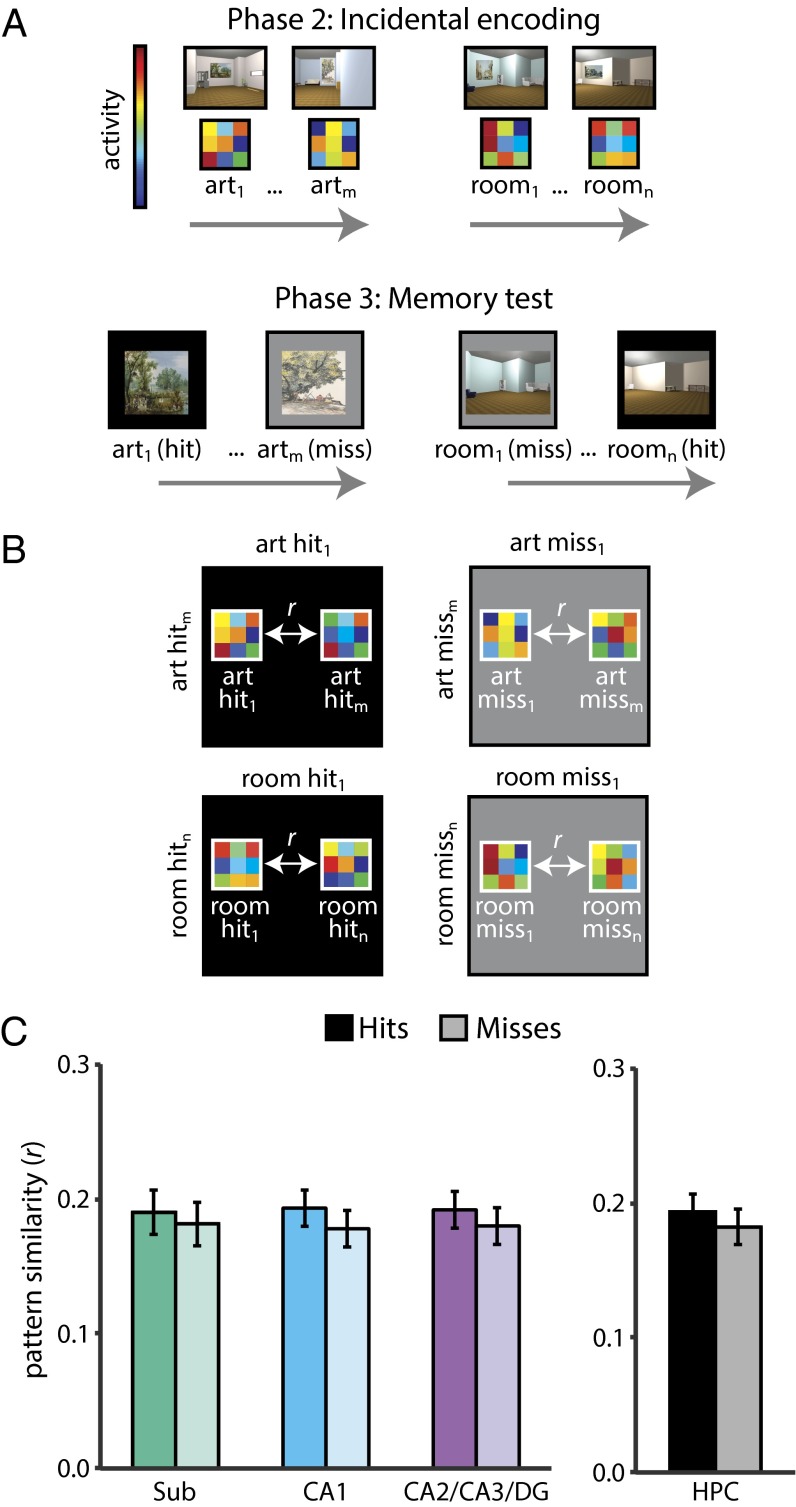
The first analysis tested whether there are hippocampal states related to good vs. bad encoding, irrespective of attention per se. For example, because of pattern separation, the activity patterns at encoding in phase 2 for items that were later remembered might be less correlated with one another than encoding patterns for items that were later forgotten (37). To examine such correlations (Fig. 5), we partialed out the corresponding attentional-state template from each encoding pattern, because the greater match to this template for hits vs. misses could have confounded and inflated the similarity of hits to one another. Still, there were no reliable differences in pattern similarity for subsequent hits and misses in any hippocampal subfield (subiculum: F1,30 = 0.56, P = 0.46; CA1: F1,30 = 1.79, P = 0.19; CA2/CA3/DG: F1,30 = 1.20, P = 0.28), nor in the hippocampus considered as a whole (F1,30 = 1.16, P = 0.29). These effects did not differ between art and room tasks (Ps > 0.68).
Fig. 5.
Subsequent memory analysis of generic pattern similarity in the hippocampus. (A) Activity patterns for each encoding trial in phase 2 were extracted from each ROI. Trials were then binned according to memory in phase 3. (B) Within each task at encoding (art and room), the activity patterns for all subsequent hits were correlated with one another and the activity patterns for all subsequent misses were correlated with one another, controlling for their similarity to the task-relevant attentional-state template. These partial correlations were then averaged across tasks separately for hits and misses. (C) There was no similarity difference for hits vs. misses in any hippocampal subfield or in the hippocampus as a whole. Error bars depict ±1 SEM of the within-participant hits vs. misses difference.
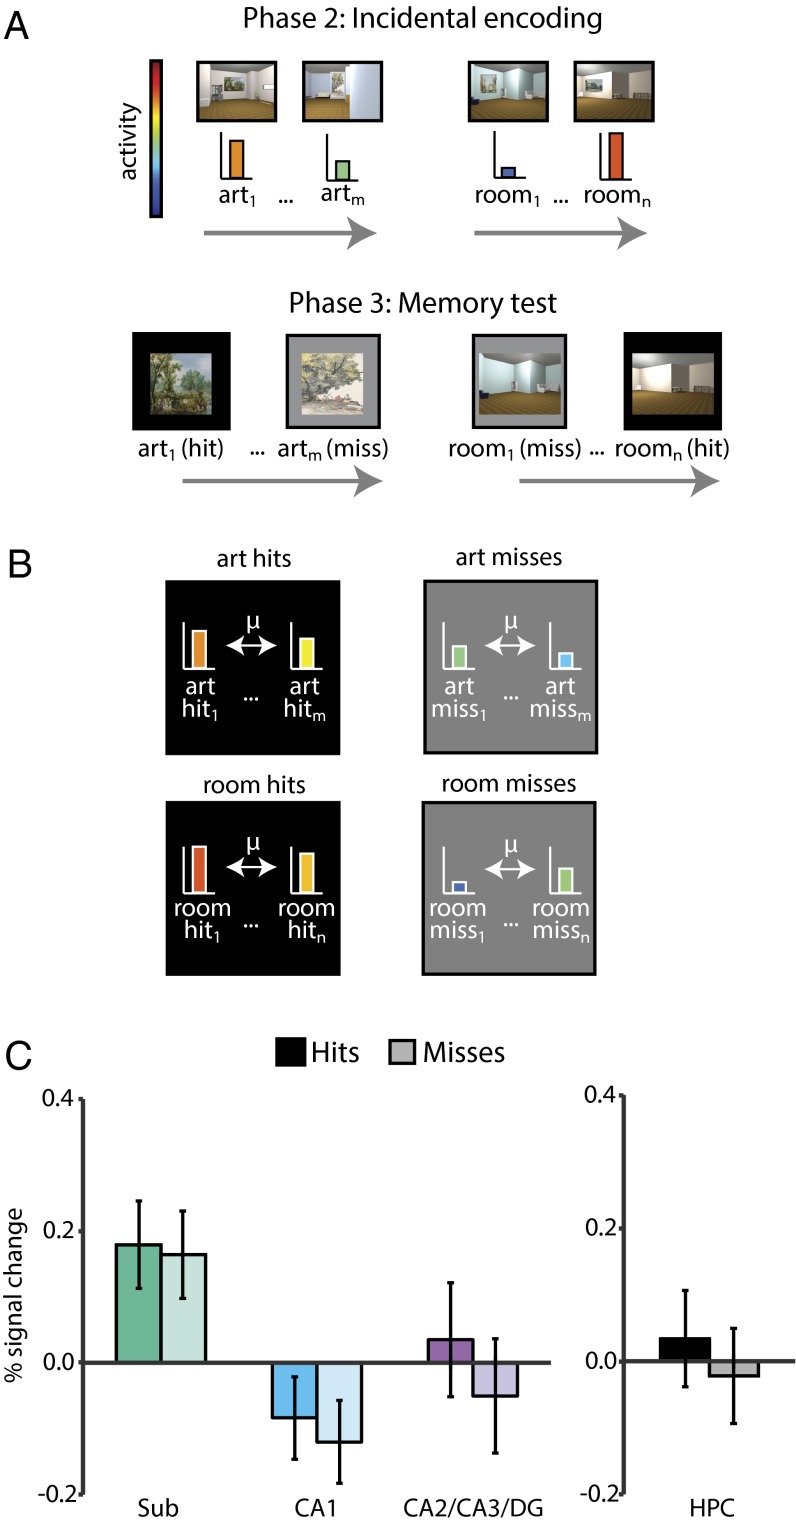
The second analysis tested the possibility that there is more hippocampal engagement during good vs. bad encoding. If so, then the average evoked activity across voxels should be greater for subsequently remembered vs. forgotten items during encoding in phase 2 (Fig. 6). However, there were no reliable differences in univariate activity between subsequent hits and misses in any hippocampal subfield (subiculum: F1,30 = 0.05, P = 0.83; CA1: F1,30 = 0.34, P = 0.56; CA2/CA3/DG: F1,30 = 0.98, P = 0.33) nor in the hippocampus considered as a whole (F1,30 = 0.59, P = 0.45). The effects did not differ between art and room tasks (Ps > 0.33). These control analyses demonstrate that the attentional state of the hippocampus—and CA2/CA3/DG in particular—provides uniquely meaningful information about memory formation.
Fig. 6.
Subsequent memory analysis of univariate activity in hippocampus. (A) The average evoked activity over voxels was extracted from each encoding trial in phase 2 for each ROI. Trials were then binned according to memory in phase 3. (B) Univariate activity was averaged separately for all subsequent hits and for all subsequent misses. (C) There was no difference between hits and misses in any hippocampal subfield or in the hippocampus considered as a single ROI. Error bars depict ±1 SEM of the within-participant hits vs. misses difference.
Where Else in the Brain Does Attentional State at Encoding Predict Memory?
Is the hippocampus the only region where attentional states at encoding predict memory? To assess the anatomical selectivity of this finding, we repeated the analysis linking attentional states to memory encoding (Fig. 4 A–C) in several other regions that are involved in memory formation or modulated by attention. First, we examined MTL cortical areas (PHc, PRc, and ERc) that serve as the main interface between the hippocampus and neocortex, using anatomical ROIs manually segmented for each participant (Fig. 2). Next, we functionally defined (using neurosynth.org) several object- and scene-selective ROIs (Fig. 7): for objects, fusiform gyrus (FG), lateral occipital cortex (LOC), and superior lateral occipital cortex (sLOC); for scenes, posterior collateral sulcus (CS), precuneus (PCN), and retrosplenial cortex (RSC). We focused on these categories because our stimuli consisted of objects and scenes: paintings were outdoor scenes with objects and rooms were indoor scenes with objects.
Fig. 7.
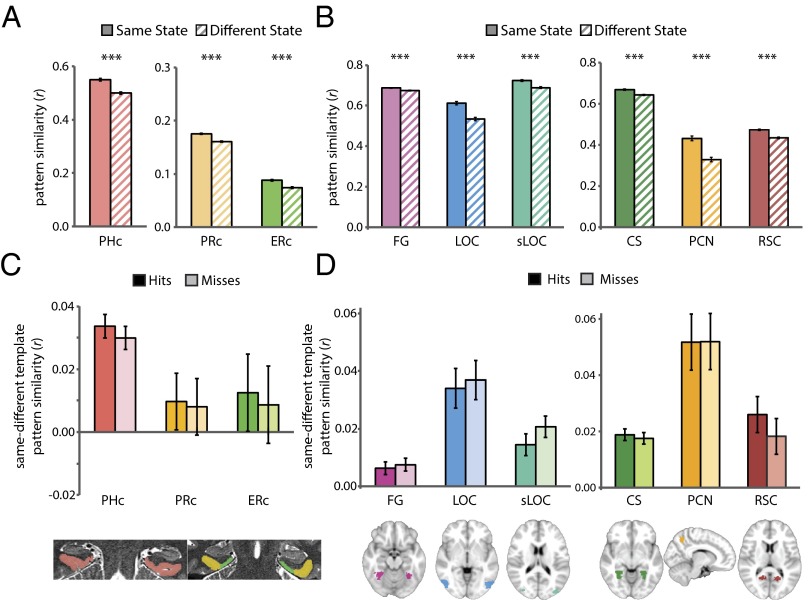
Attention and memory signals outside of the hippocampus. During the phase 1 attention task, state-dependent activity patterns were observed in (A) MTL cortex and (B) object-/scene-selective cortex. Error bars depict ±1 SEM of the within-participant same vs. different state difference. During phase 2 encoding, there was no difference in attentional-state template match between subsequent hits vs. misses in (C) MTL cortex or (D) object-/scene-selective cortex. Error bars depict ±1 SEM of the within-participant hits vs. misses difference. ***P < 0.001.
Before examining whether the attentional state of these ROIs predicted memory, we sought to establish that they had reliable attentional-state representations in the first place. We repeated the same phase 1 analysis as for the hippocampus (Fig. 3), calculating correlations in activity patterns for trials of the same vs. different attentional states. All ROIs showed state-dependent activity patterns, including MTL cortex (Fig. 7A) (PHc: t31 = 9.93, P < 0.0001; PRc: t31 = 8.55, P < 0.0001; ERc: t31 = 6.91, P < 0.0001) and object- and scene-selective cortex (Fig. 7B) (FG: t31 = 7.07, P < 0.0001; LOC: t31 = 8.64, P < 0.0001; sLOC: t31 = 7.60, P < 0.0001; CS: t31 = 8.76, P < 0.0001; PCN: t31 = 9.60, P < 0.0001; RSC: t31 = 9.76, P < 0.0001).
As for the hippocampus, we then examined whether the presence of these state representations during phase 2 encoding predicted memory in phase 3. There was no reliable difference between subsequent hits and misses in the match to the task-relevant vs. -irrelevant attentional-state template in any MTL cortical ROI (Fig. 7C) (PHc: F1,30 = 1.38, P = 0.25; PRc: F1,30 = 0.04, P = 0.85; ERc: F1,30 = 0.09, P = 0.77) or any object/scene ROI (Fig. 7D) (FG: F1,30 = 0.29, P = 0.59; LOC: F1,30 = 0.16, P = 0.69; sLOC: F1,30 = 2.74, P = 0.11; CS: F1,30 = 0.39, P = 0.54; PCN: F1,30 = 0.004, P = 0.95; RSC: F1,30 = 1.50, P = 0.23). This result did not differ between art and room tasks in any ROI (Ps > 0.55), except sLOC, where there was a marginal interaction (F1,30 = 3.60, P = 0.07) driven by the opposite pattern of results (misses > hits) for the art task.
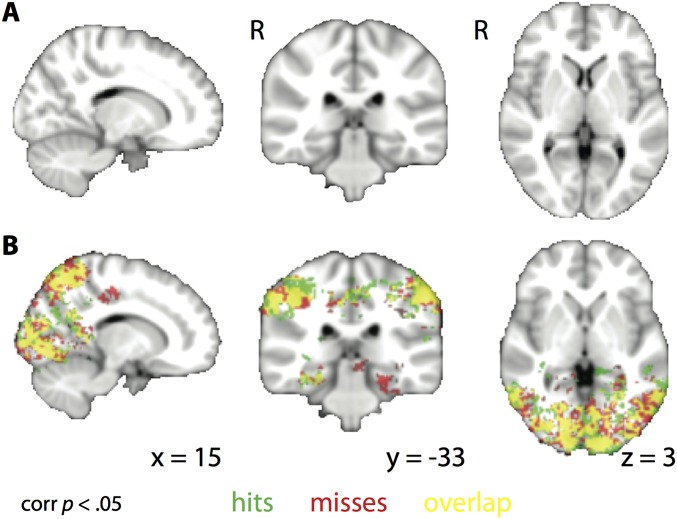
Finally, in case this ROI analysis was too narrow, we conducted a searchlight analysis over the whole brain. A number of regions showed greater overall pattern similarity to the task-relevant vs. -irrelevant attentional-state template during encoding in phase 2. However, unlike CA2/CA3/DG, this match effect did not differ for items that were later remembered vs. forgotten in phase 3 (Fig. S7). Together, these analyses reveal that attentional effects are widespread in the brain, but only predictive of memory in the hippocampus.
Fig. S7.
Attentional-state representations during encoding. (A) Whole-brain searchlight analysis showing regions where there was a greater correlation between trial-by-trial encoding activity patterns and the matching vs. mismatching attentional-state template for subsequent hits vs. misses. No clusters survived correction for multiple comparisons. (B) The same analysis as for A, but shown separately for hits and misses, with overlap in yellow. Many regions in the occipital and temporal cortex showed greater evidence for the task-relevant attentional-state representation during encoding, but this did not differ based on memory success. P < 0.05 TFCE-corrected.
What Other Regions Support the Memory Effect in CA2/CA3/DG?
Although individual ROIs outside the hippocampus did not predict memory, their interactions with CA2/CA3/DG may be important for encoding. For example, even though MTL and category-selective regions may always represent the current attentional state (for both hits and misses), their communication with CA2/CA3/DG may vary across trials. Specifically, during moments of enhanced communication, the features processed by these regions may be better incorporated into memories, and these richer representations may support better performance on the memory test, which required fine-grained discrimination.
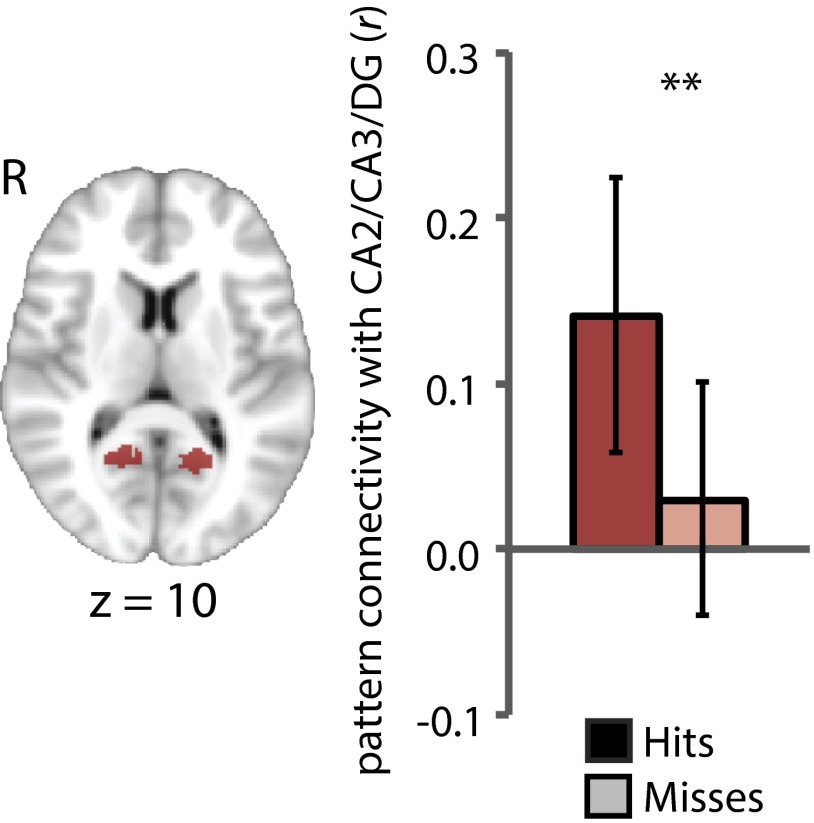
To evaluate this possibility, we used an analysis of pattern connectivity (41, 42), correlating the match for the task-relevant vs. -irrelevant attentional-state template in CA2/CA3/DG with that in each of the MTL and category-selective ROIs across trials, separately for items that were later remembered vs. forgotten. For RSC (Fig. 8), there was greater pattern connectivity with CA2/CA3/DG for hits than misses (P < 0.01), which did not differ between art and room tasks (P = 0.89). This was not found in any other object/scene ROI (Ps > 0.29), nor in the MTL cortical ROIs (Ps > 0.36).
Fig. 8.
Pattern connectivity between RSC and CA2/CA3/DG during memory encoding. RSC (Left) showed greater pattern connectivity with CA2/CA3/DG for subsequent hits vs. misses. Error bars depict 95% bootstrap confidence intervals. **P < 0.01.
Discussion
The environment around us contains substantially more information than what we encode into memory. Despite extensive research on memory formation, the mechanisms that support the selective nature of encoding are largely unknown. In the present study, we manipulated attention as a way of understanding selective memory formation. Attention not only selects information in the environment that will guide online behavior, but also information that will be retained in long-term memory (3). We therefore tested the hypothesis that attention modulates what we remember by establishing activity patterns in the hippocampus that prioritize the information most relevant to our goals (13).
We found that attention induced state-dependent patterns of activity throughout visual cortex, MTL cortex, and the hippocampus, but that the attentional state of the hippocampus itself was most closely linked to the formation of memory. Specifically, the hippocampus contained stronger representations of the task-relevant attentional state during the encoding of items that were subsequently remembered vs. forgotten: a state–memory relationship that was not reliable in any MTL cortical region, category-selective region, or anywhere else in the brain. The attentional state of cortex may nevertheless have contributed to memory behavior: Coupling between the attentional states of CA2/CA3/DG and RSC during encoding was associated with better subsequent memory. Taken together, these results offer mechanistic insight into why we remember some things and not others, with the attentional state of the hippocampus, and its relationship to the state of certain cortical regions, determining what we remember about an experience.
Relation to Prior Studies of Memory Encoding.
A major breakthrough in understanding memory formation was the finding that the overall level of activity in a number of brain regions, including the hippocampus and MTL cortex, was predictive of what information would be subsequently remembered (5, 23, 40). Advances in high-resolution fMRI enabled the investigation of the encoding functions of hippocampal subfields, and highlighted a special role for CA2/3 and DG (24–26). Later work demonstrated that patterns of activity in the hippocampus and MTL cortex could also be used to predict subsequent memory (37). These studies reveal the neural correlates of memory formation, but leave open the key question of why memories are formed for some events and not others.
Recent research has made strides toward answering this question (43). For example, when items are viewed multiple times, greater reliability in their evoked activity patterns in visual cortex is associated with better memory (39); this suggests that reactivation of a common neural representation strengthens the memory trace. Successful memory formation is also associated with greater neural evidence for the category of a stimulus, as evidenced by patterns of activity in temporal and frontal regions (44); thus, more robust neural representations are more likely to be remembered. The impact of similarity to other items in a category on subsequent memory varies across regions: in MTL cortex, more similar representations are associated with better memory, whereas in hippocampus, more distinct representations are beneficial (37). Finally, reward information in the hippocampus is associated with better memory for rewarding events (27); thus, motivational salience can modulate hippocampal encoding.
These studies shed light on the factors that contribute to memory formation when there is no competition for encoding; that is, when the information to be encoded is determined by the external stimulus. However, in complex environments with multiple competing stimuli, what information gets encoded might be determined by attention. This prioritization can be established in a stimulus-driven manner, based on salience from novelty, emotion, and reward, or in a goal-directed manner, based on the current behavioral task (1). Goal-directed attention has consequences for behavioral expressions of memory (3) and for the magnitude of encoding-related activity in the hippocampus (4–7). The present study manipulated goal-directed attention as well: the images in the art- and room-encoding tasks contained the same elements—rooms with furniture and a painting—and thus only the participant’s goal systematically influenced what information was processed and encoded into memory. Unlike prior studies, however, we were able to directly examine how the goal representation in the hippocampus influenced encoding.
We did not find a significant link between the state of CA1 during encoding and memory, although there were theoretical reasons to expect CA1 modulation, including that CA1 activity is influenced by goal states during memory retrieval (28). Future studies will be needed to clarify how and when attention modulates mnemonic processes in different subfields. For example, tasks that manipulate attention in the context of expectations (45) may place a greater demand on the comparator function of CA1 (29, 30), resulting in a tighter coupling of attentional modulation in this region to memory encoding and retrieval.
Attentional States and Pattern Separation.
The neural architecture of the hippocampus enables the formation of distinct representations for highly similar events. Such pattern separation is necessary for episodic memory because events that share many features nevertheless need to be retained as distinct episodes (e.g., remembering where you locked your bike today vs. yesterday). Computational models and animal electrophysiology have pointed to a prominent role for the DG in pattern separation, with CA3 contributing at moderate to low levels of event similarity (32). Recently, human neuroimaging studies have linked distinct hippocampal representations to better memory, both at encoding (37) and retrieval (46), with an emphasis on CA3 and/or DG (34, 46, 47).
We found that greater similarity in CA2/CA3/DG between encoding activity patterns and the task-relevant attentional-state representation predicted memory. On the surface, this seems to contradict prior findings that more distinct hippocampal representations benefit memory. However, these two effects—common attentional-state representations and distinct pattern-separated representations—are not mutually exclusive. The activity pattern for an item that is later remembered might contain information about the current attentional state (shared with other items), as well as unique information about that particular item. Both shared and unique components are important for memory: relatively greater match between an encoding activity pattern and the task-relevant attentional-state representation indicates that selective attention is better tuned toward the stimulus features relevant for the behavioral goal, and this in turns increases the likelihood of that information being retained in memory. If the encoding activity pattern more closely matches the other attentional-state representation, then attention is not as strongly oriented toward the features for which memory will be tested, and the likelihood of encoding them successfully is lower. Once attention is successfully engaged by the relevant stimulus dimensions, however, distinct representations for the specific task-relevant features on that trial would benefit memory: such representations would help avoid interference between highly similar items encountered during encoding, as well as improve discrimination between encoded items and similar lures during retrieval.
We found evidence for the mnemonic benefit of shared attentional-state representations, but did not find evidence of pattern separation that predicted memory. Comparing items to each other, we found that CA2/CA3/DG representations for subsequently remembered items were no more distinct from each other than were forgotten items. Importantly, this analysis controlled for the similarity between each encoding activity pattern and the task-relevant attentional-state template, preventing this shared variance—especially for subsequently remembered items—from masking otherwise distinctive item representations. Future studies will be needed to characterize the relative contribution and interaction of attentional states and pattern separation to episodic memory formation. Finally, note that this is not the only case of similar hippocampal representations at encoding benefitting memory; another example is highly rewarding contexts (27).
RSC and Scene Processing.
Although our findings emphasize a key role for the hippocampus, they also suggest that its interactions with other regions of the brain might be important for understanding the interplay between attention and memory. Specifically, we found that the attentional states of CA2/CA3/DG and RSC were more correlated on subsequently remembered vs. forgotten trials. This multivariate pattern connectivity may offer a means by which visuospatial representations are transformed into long-term memories. The hippocampus and RSC are reciprocally connected, and both have well-established roles in spatial and episodic memory, navigation, and scene perception (48–51). Spatial representations in these regions are complementary: the hippocampus contains allocentric (viewpoint-independent) representations of the environment, whereas RSC may translate between allocentric hippocampal representations and egocentric (viewpoint-dependent) representations in the parietal cortex (52). RSC is also important for linking perceived scenes with information about them in memory (53) and for directional orienting within spatial contexts (48, 50, 54). That communication between the hippocampus and RSC, but not the attentional state of RSC itself (Fig. 7B), is predictive of successful encoding highlights the distributed nature of attentional modulation in the brain and its relationship to memory.
Increased pattern connectivity between CA2/CA3/DG and RSC for remembered items was found during both art and room encoding. This finding may reflect the need for scene processing in both tasks, albeit of different kinds. The scene information in the room task is the layout of the furniture and the configuration of the walls. Although the painting might be processed as an object in the context of the entire room, once it is attended in the art task it can be processed as a scene (all paintings we selected depicted outdoor places). Both varieties of scenes—those we can navigate and those we view—are processed by the hippocampus and RSC (48–51, 53, 55, 56). State-dependent representations in CA2/CA3/DG and RSC, and interactions between these regions, may therefore enable the integration of multiple visuospatial cues during perception and their retention in long-term memory.
Conclusions
The present study sheds light on the mechanisms by which particular pieces of information are selected from environmental input and retained in long-term memory. We show that information is more likely to be remembered when activity patterns in the hippocampus are indicative of an attentional state that prioritizes that type of information. In this way, attention not only affects what we perceive, but also what we remember.
Materials and Methods
Participants.
Thirty-two individuals participated for monetary compensation (15 male; age: mean = 22.6 y, SD = 3.9; education: mean = 15.4 y, SD = 2.7). The study was approved by the Institutional Review Board at Princeton University. All participants gave informed consent. One participant did not have any high-confidence hits on the room memory task and could not be included in certain subsequent memory analyses.
Behavioral Tasks.
Stimuli.
The Psychophysics Toolbox for Matlab (psychtoolbox.org) was used for stimulus presentation and response collection. The stimuli were rooms and paintings. Rooms were rendered with Sweet Home 3D (sweethome3d.com). Each room had multiple pieces of furniture and a unique shape and layout. A second version of each room was created with a 30° viewpoint rotation (half clockwise, half counterclockwise) and altered so that the content was different but the spatial layout was the same: wall colors were changed and furniture replaced with different exemplars of the same category (e.g., one bookcase for another). The set of paintings contained two works from each artist, similar in style but not necessarily content, chosen from the Google Art Project.
Phase 1 was allocated 40 rooms (20 in two perspectives each) and 40 paintings (20 artists with two paintings each). A nonoverlapping set of 120 rooms (60 in two perspectives each) and 120 paintings (60 artists with two paintings each) were allocated to phases 2 and 3. An additional 12 rooms (six in two perspectives each) and 12 paintings (six artists with two paintings each) were used for phase 1 practice.
Phase 1: Attention task.
A total of 120 images were created by pairing each of the 40 rooms with a painting from three different artists, and each of the 40 paintings with three different rooms. For every participant, 10 of these images (unique art and room combinations) were chosen as “base images.” These were used to create 10 “base sets” with a base image, a room match (a remaining image with same layout but different artist), an art match (a remaining image with same artist but different layout), and four distractors (remaining images with different layouts and artists). Room and art matches for one base set could serve as distractors for other base sets. Base images were not used as distractors or matches for other base sets; however, base images for one participant served as different image types for other participants.
Each base set was used to generate 10 trials. The cues for these trials were split evenly between tasks (five room, five art). There was a 50% probability of the task-relevant match being present (e.g., room match on room-task trials), and independently, a 50% probability of the task-irrelevant match being present (e.g., art match on room-task trials). Distractors were selected to fill out the remaining slots in the search set of four images. Probes matched the cues with 80% probability (valid trials); the remaining trials were invalid. The 100 total trials were divided evenly into four runs. Trial order was randomized with the constraint that trials from the same base set could not occur back-to-back, and the 10 trials from each base set were equally divided between two adjacent runs.
Each trial consisted of a fixation dot for 500 ms, the “ART” or “ROOM” cue for 500 ms, the base image for 2 s, the four search-set images for 1.25 s each, separated by 100 ms, and then the “ART” or “ROOM” probe for a maximum of 2 s. Participants responded “yes” or “no” with a button box using their index and middle fingers, respectively. The probe disappeared once a response was made. After a blank interval of 8 s, the next trial began. At the end of each run, accuracy was displayed along with feedback (e.g., “You are doing pretty well!”).
Participants came for instructions and practice (for phase 1) the day before the scan. The task was identical to the scanned phase 1 except that feedback (“You are correct!” or “You are incorrect.”) was given after every trial. Participants repeated the practice until they reached >70% accuracy. Participants were not given instructions about phases 2 and 3 in advance.
Phase 2: Incidental encoding.
A total of 360 images were created by pairing each of the 120 rooms with a painting from three different artists, and each of the 120 paintings with three different rooms. From this set, 40 unique images (i.e., no art or room matches), and 10 other images plus their matches (i.e., five images with an art match and five images with a room match) were selected for each participant.
Participants completed two blocks of a one-back task (one art, one room; order counterbalanced), which served as the manipulation of attention in this phase. Each block consisted of 30 images: 20 were unique and the rest were five matched pairs (i.e., two images with the same layout or two images with paintings by the same artist). In the art block, participants looked for two paintings in a row painted by the same artist. In the room block, participants looked for two rooms in a row with the same layout. Trial order was randomized with the constraint that pairs of repetition trials could not occur back-to-back. Participants indicated a target by pushing the first button on a button box with their index finger. Each image was presented for 2.5 s. Half of the intertrial intervals were 3.5 s and the remainder were 5.5 s; this jittering was used to facilitate deconvolution of event-related blood-oxygen level-dependent (BOLD) responses. Participants were not told that their memory would be tested. Images in the art block for some participants were used in the room block for other participants. Moreover, images in phase 2 for some participants served as test lures in phase 3 for others.
Phase 3: Memory test.
Memory for the task-relevant aspect of images from phase 2 (e.g., room layouts from the room one-back task) was tested in phase 3. Participants completed one art memory test and one room memory test. Test order was the same as the phase 2 task order for that participant. None of the one-back targets or their matches (i.e., the first member of each pair) were included. The remaining images (20 paintings and 20 rooms) were targets in the tests. Each target had a matched lure: a room with the same layout from a different perspective or a painting by the same artist. The 40 images (targets + lures) for each memory test were presented one at a time in a random order. On each trial, participants made self-paced responses using a four-point confidence scale (sure old, maybe old, maybe new, sure new). Participants were told to make an “old” judgment if they saw a painting or room that was identical to one viewed during the corresponding (art or room) one-back task and to respond “new” otherwise. They were also instructed to make use of the different confidence levels to indicate the strength and quality of their memories.
Eye-Tracking.
Because different types of information were relevant in the art and room tasks, restricting fixation may have disadvantaged performance in one task over the other; thus participants were free to move their eyes. Nevertheless, we monitored eye position during the fMRI scan to enable follow-up analyses on eye movements and their relation to fMRI results and behavior (Supporting Information). Eye-tracking data were collected with a SensoMotoric Instruments iView X MRI-LR system sampling at 60 Hz, and analyzed using BeGaze software and custom Matlab scripts.
MRI Acquisition.
MRI data were collected on a 3T Siemens Skyra scanner with a 20-channel head coil. Functional images were obtained with a multiband EPI sequence (TR = 2 s, TE = 40 ms, flip angle = 71°, acceleration factor = 3, voxel size = 1.5-mm isotropic), with 57 slices parallel to the long axis of the hippocampus acquired in an interleaved order. There were four functional runs for phase 1 and two for phase 2. Two structural scans were collected: whole-brain T1-weighted MPRAGE images (1.0-mm isotropic) and T2-weighted TSE images (54 slices perpendicular to the long axis of the hippocampus; 0.44 × 0.44-mm in-plane, 1.5-mm thick). Field maps were collected for registration (40 slices of same orientation as EPIs, 3-mm isotropic).
fMRI Analysis.
Software.
Preprocessing and general linear model (GLM) analyses were conducted using FSL. ROI analyses were performed with custom Matlab scripts. Searchlight analyses were performed using Simitar (www.princeton.edu/∼fpereira/simitar) and custom Matlab scripts.
ROI definition.
Hippocampal subfield and MTL cortical ROIs were manually segmented on each participant’s T2-weighted images (see segmentation guide in ref. 10). Category-selective ROIs were functionally defined using Neurosynth (neurosynth.org) using keywords “object” and “scene”. We refined the resulting ROIs to those voxels for which all participants had functional data and ensured that no ROIs overlapped (Fig. 7).
Preprocessing.
The first three volumes of each run were discarded for T1 equilibration. Preprocessing included brain extraction, motion correction, high-pass filtering (maximum period = 128 s), and spatial smoothing (3-mm full-width half-maximum Gaussian kernel). Field map preprocessing was based on the FUGUE user guide (fsl.fmrib.ox.ac.uk/fsl/fslwiki/FUGUE/Guide).
Phase 1: Attention task.
The analysis of this phase closely followed our previous work (10). Pattern similarity was calculated based on the output of a single-trial GLM, which contained 25 regressors of interest: one for every trial in a run, modeled as 8-s epochs from cue onset to the offset of the last search-set image. There was also a single regressor for all probe/response periods, modeled as 2-s epochs from probe onset. All regressors were convolved with a double-γ hemodynamic response function. The six directions of head motion were included as nuisance regressors. Autocorrelations in the time series were corrected with FILM prewhitening. Each run was modeled separately in first-level analyses, resulting in four different models per participant. Only valid trials were analyzed further. We included trials with both correct and incorrect responses to balance the number of trials per participant.
When extracting data from MTL ROIs, first-level parameter estimates were registered to the participant’s T2 image and up-sampled to the T2 resolution. When extracting data from Neurosynth ROIs (defined in standard space), parameter estimates were registered to 1.5-mm Montreal Neurological Institute (MNI) space. This registration process was the same for all subsequent analyses with these ROIs.
In each ROI, parameter estimates for a given trial were extracted from all voxels and reshaped into a vector. Correlations between all pairs of trial vectors within adjacent runs were calculated (42). To identify state-dependent activity patterns, we compared correlations for trials of the same attentional state (i.e., art/art and room/room) to correlations for trials of different states (i.e., art/room), and same-state correlations were compared between states (i.e., art/art vs. room/room). Correlations were averaged across (pairs of) runs within participant, Fisher-transformed to ensure normality, and compared at the group level with random-effects paired t tests.
We also obtained mean “template” patterns of activity for each attentional state in each ROI, which were to be correlated with trial-specific encoding activity patterns from phase 2. These templates were obtained by averaging the activity patterns within each ROI across all art trials (for the art state template) and across all room trials (for the room state template).
Phase 2: Incidental encoding.
Phase 2 data were analyzed in terms of pattern similarity, univariate activity, searchlights, and pattern connectivity.
As for phase 1, pattern similarity analyses were based on a single-trial GLM, this time with a regressor for each of the 30 trials, modeled as 2.5-s epochs from image onset to offset. Only trials for which memory was later tested (i.e., not the one-back targets or paired matches) were analyzed further.
For each trial, parameter estimates across voxels within each ROI were reshaped into a vector and correlated with the phase 1 attentional-state templates. We took the difference between the correlation with the task-relevant attentional-state template (e.g., art encoding, art template) and the task-irrelevant template (e.g., art encoding, room template) as a selective measure of how much activity on that trial more closely resembled the task-relevant attentional state. The mean of this measure was calculated for subsequent hits (i.e., items remembered with high confidence in phase 3) and subsequent misses (i.e., items given a low-confidence “old” response or a “new” response in phase 3), separately for the art and room tasks. This method of comparing high-confidence hits to low-confidence hits and all misses is common practice for examining episodic memory encoding (e.g., refs. 22 and 23; see also refs. 35 and 36).
Group analyses of attentional template similarity were conducted with a two (state: art or room) by two (memory: hit or miss) repeated-measures ANOVA on Fisher-transformed correlations. Because there were a different number of art vs. room hits and misses (within and across participants), we verified that the same pattern of results was obtained when this and all subsequent analyses were repeated with averages weighted by the proportion of trials contributed by art- vs. room-encoding tasks.
Additionally, we examined whether pattern similarity provided predictive information about subsequent memory without reference to attentional-state templates. Within each run, we separately correlated encoding patterns for all subsequent hits and misses using partial correlation, controlling for the similarity between each encoding activity pattern and the task-relevant attentional-state template. Group analyses were conducted with a two (state: art or room) by two (memory: hit or miss) repeated-measures ANOVA on Fisher-transformed correlations.
For univariate analyses, parameter estimates from the single-trial GLMs were converted to percent signal change. These values were extracted from all voxels in each ROI, and averaged separately for subsequent hits and misses in the art and room tasks. Group analyses were conducted with a two (state: art or room) by two (memory: hit or miss) repeated-measures ANOVA.
Searchlight analyses were conducted to examine the relationship between phase 2 encoding patterns and phase 1 attentional-state templates over the whole brain. The process was the same as for the ROIs but repeated for all possible 27-voxel cubes (3 × 3 × 3) in 1.5-mm MNI space. First, the mean activity pattern for the art and room states in phase 1 was obtained for each cube. These attentional-state templates were separately correlated with the activity pattern for each encoding trial from phase 2, and the results for each cube were assigned to the center voxel. We then took the difference between the correlations with the task-relevant state (e.g., art encoding, art template) and task-irrelevant state (e.g., art encoding, room template). Next, these correlation differences were separately averaged for subsequent hits and misses in the art and room tasks. We subtracted the resulting scores (i.e., hits minus misses) within each task and averaged across tasks. Group analyses were performed with random-effects nonparametric tests (using “randomise” in FSL), corrected for multiple comparisons with threshold-free cluster enhancement (57), and thresholded at P < 0.05 corrected.
To examine interactions between regions, we correlated the trial-by-trial match of phase 2 encoding patterns to the phase 1 task-relevant vs. -irrelevant attentional-state templates across regions (i.e., pattern connectivity) (41, 42). We wanted to compare such interregional correlations separately for subsequent hits and misses; however, because each participant provided relatively few hits (art: mean = 6.6 trials, SD = 2.7; room: mean = 5.0, SD = 2.4), within-participant correlational analyses would be underpowered. We thus pooled data across all participants and performed a supersubject analysis with random-effects bootstrapping (22).
The steps were as follows: First, to prevent individual differences from driving effects at the supersubject level, we z-scored the pattern similarity measures within participant for each ROI, separately for the art and room tasks. We then separately pooled the data for art hits, art misses, room hits, and room misses across participants for each ROI. The resulting super-subject data were correlated across ROIs to obtain pattern connectivity for each of those conditions. Finally, pattern connectivity was averaged across the art and room tasks, separately, for hits and misses. To assess random-effects reliability, we conducted a bootstrap test in which we resampled entire participants with replacement and performed the same analyses on the resampled data (58). The P value (for hits > misses) was the proportion of iterations out of 10,000 with a negative difference (i.e., in the unhypothesized direction).
SI Text
Univariate Analyses of Phase 1.
The GLM for univariate analyses contained four regressors of interest: valid and invalid trials for the art and room states. These were modeled as 8-s epochs from cue onset to the offset of the last image. Additionally, there was a regressor for trials in which the participant did not respond (modeled the same way), and a regressor for the probe/response period, which was modeled as a 2-s epoch from probe onset. All regressors were convolved with a double-γ hemodynamic response function and their temporal derivatives were also entered. Finally, the six directions of head motion were included as nuisance regressors. Autocorrelations in the time series were corrected with FILM prewhitening. Each run was modeled separately in first-level analyses, resulting in four different models per participant. Only valid trials (i.e., trials in which the text cue at the beginning of the trial matched the text probe at the end) were analyzed further.
For analyses of MTL ROIs (defined on each participant’s T2 image), the first-level parameter estimate images were registered to the participant’s T2 image and up-sampled to the T2 resolution. For analyses of Neurosynth ROIs (defined in standard space), the parameter estimate images were registered to 1.5-mm MNI space. Parameter estimates were then extracted from each anatomical ROI and averaged across voxels and runs. Group analyses consisted of random-effects paired t tests across participants.
For whole-brain analyses, first-level parameter estimates for each participant were registered to 1.5-mm MNI space, with the aid of field maps and the brain-extracted MPRAGE image. These were entered into second-level fixed-effects analyses for each participant, to combine across runs, and then into third-level random-effects analyses, to combine across participants. The group-level contrast images were corrected for multiple comparisons with threshold-free cluster enhancement (TFCE) (57). The resulting corrected P maps were thresholded at P < 0.05.
Eye-Tracking.
Participants were free to move their eyes during all three phases of the study, and we monitored these eye movements for the first two (scanned) phases. Because of calibration problems, we were unable to acquire eye-tracking data for 7 of the 32 participants. Thus, phase 1 analyses are based on 25 participants. An additional participant had to be excluded from phase 2 analyses because of unreliable eye-tracking data. Finally, one participant did not have any high-confidence hits on the room memory task, and therefore could not be included in repeated-measures ANOVAs across art and room memory and analyses of room memory generally. Thus, phase 2 analyses are based on 23 participants.
Phase 1.
We assessed several different eye-tracking measures during the course of each trial, from cue onset to probe offset (see, for example, ref. 10). There were more saccades in the room vs. art states (room: mean = 19.60, SD = 3.94; art: mean = 15.24, SD = 4.02; t24 = 9.14, P < 0.0001), and correspondingly a greater number of fixations (room: mean = 20.42, SD = 3.68; art: mean = 16.06, SD = 3.64; t24 = 8.73, P < 0.0001). However, there were no differences between states in the total time spent making saccades (room: mean = 0.82 s, SD = 0.60; art: mean = 0.78 s, SD = 0.60; t24 = 1.48, P = 0.15) or fixating (room: mean =7.83 s, SD = 1.33; art: mean = 7.68 s, SD = 1.65; t24 = 1.38, P = 0.18).
Differences in eye movements were expected because different kinds of information were useful in the art vs. room states. Thus, good performance entails differential sampling of the images to focus on the task-relevant information. To ensure that the differences between the states that we observed in univariate and multivariate fMRI analyses did not reflect these differences in eye movements, we conducted several follow-up analyses examining the relationship between saccades, univariate activity, and pattern similarity. We focused on saccades because saccade frequency increases BOLD activity across a number of brain regions (59).
If saccade frequency causes the differences between the art and room states in univariate activity (Fig. S2) and pattern similarity (Fig. S3), then the difference in the number of saccades for room vs. art states should be related to the difference in univariate activity and pattern similarity for room vs. art states. We examined this relationship across individuals using robust correlation methods, focusing on ROIs that showed reliable differences between states. We found no significant correlations for either univariate activity (PHc: r23 = 0.33, P = 0.11; subiculum: r23 = −0.35, P = 0.08; CA1: r23 = −0.13, P = 0.53; CA2/CA3/DG: r23 = −0.13, P = 0.53; entire hippocampus: r23 = −0.19, P = 0.35) or pattern similarity (PHc: r23 = 0.09, P = 0.65; PRc: r23 = −0.31, P = 0.14; ERc: r23 = −0.22, P = 0.28; subiculum: r23 = 0.006, P = 0.98; CA1: r23 = −0.06, P = 0.79; CA2/CA3/DG: r23 = 0.02, P = 0.94; entire hippocampus: r23 = −0.04, P = 0.84). Thus, for all ROIs, differences in univariate activity and pattern similarity between states were not driven by differences in eye movements.
Fig. S3.
Comparison of pattern similarity between states. (A) BOLD activity was extracted from all voxels in each ROI for each trial. (B) Activity patterns were separately correlated across trials of the art state and across trials of the room state. (C) In the MTL cortex, all subregions showed greater pattern similarity for room vs. art states (PHc: t31 = 8.85, P < 0.0001; PRc: t31 = 4.05, P = 0.0003; ERc: t31 = 4.03, P = 0.0003). In the hippocampus, all subfields showed greater pattern similarity for room vs. art states (subiculum: t31 = 8.66, P < 0.0001; CA1: t31 = 8.24, P < 0.0001; CA2/CA3/DG: t31 = 8.31, P < 0.0001). Considered as a single ROI, the hippocampus showed greater pattern similarity for room vs. art states (t31 = 10.54, P < 0.0001). Error bars depict ±1 SEM of the within-participant art vs. room state difference. Results are shown as Pearson correlations, but statistical tests were performed after Fisher transformation. ***P < 0.001.
We additionally examined whether the correlations between room-state pattern similarity and behavior in CA1 (Fig. S5) and CA2/3 (Fig. S1C) could be related to eye movements. There was no correlation between pattern similarity and saccade frequency in either ROI (CA1: r23 = −0.01, P = 0.95; CA2/3: r23 = 0.06, P = 0.76). Furthermore, the correlation between room-state behavioral performance and room-state pattern similarity in CA1 remained significant when controlling for saccade frequency (partial r20 = 0.50, P = 0.02). In CA2/3, this relationship was marginally reliable (partial r18 = 0.41, P = 0.08). Note that, in both cases, the correlations remain numerically high despite the large reduction in sample size (because eye-tracking data were not available for some participants).
Fig. S5.
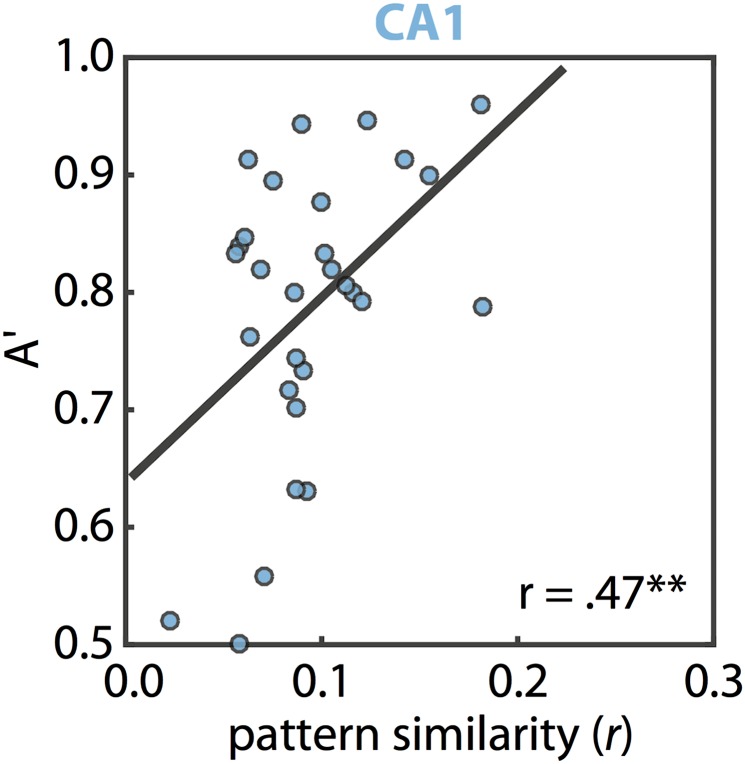
Brain/behavior relationships in the attention task. Individual differences in room-state pattern similarity in CA1 were correlated with individual differences in behavioral performance (A′) on valid trials of the room task [r27 = 0.47, P = 0.01; note that robust correlation methods were used (60)]. This effect was not found in any other region (PHc: r26 = 0.16, P = 0.41; PRc: r26 = −0.01, P = 0.96; ERc: r29 = 0.14, P = 0.46; Sub: r28 = 0.21, P = 0.26; CA2/CA3/DG: r24 = 0.27, P = 0.18). Note, however, that CA2/3 alone did show a reliable effect (see Fig. S1C). Additionally, the correlation for CA1 was specific to room-state pattern similarity and room-state behavior: room-state activity did not predict room-state behavior (r27 = −0.11, P = 0.56) and room-state pattern similarity did not predict art-state behavior (r26 = −0.03, P = 0.87). Finally, controlling for room-state pattern similarity, art-state pattern similarity did not predict room-state behavior (r26 = 0.12, P = 0.56). There were no reliable correlations between art-state pattern similarity and art-state behavior in any ROI (all Ps > 0.10). **P < 0.01.
Phase 2.
We conducted additional analyses to ensure that remembered and forgotten items were not associated with different eye movements during encoding. For each of the four eye-movement measures we examined above (saccades, fixations, saccade duration, fixation duration), we conducted a repeated-measures ANOVA, with attentional state (art or room) and memory (hit or miss) as factors. As in the fMRI analyses, hits were items that received high-confidence “old” judgments on the memory test, and misses were items that received low-confidence “old” judgments or high- or low-confidence “new” judgments.
For saccades, we observed a main effect of attentional state, reflecting more saccades for room vs. art encoding (F1,22 = 45.24, P < 0.0001). There was no main effect of memory (F1,22 = 0.24, P = 0.63), nor an attentional state × memory interaction (F1,22 = 0.05, P = 0.83). Thus, these data replicate the (phase 1) finding of more saccades for the room state, but importantly show no differences in saccade frequency for items that were subsequently remembered vs. forgotten.
This pattern of results was also observed for saccade duration and fixations: there was a main effect of attentional state (saccade duration: F1,22 = 4.89, P = 0.04; fixations: F1,22 = 50.33, P < 0.0001), but no main effect of memory (saccade duration: F1,22 = 0.15, P = 0.71; fixations: F1,22 = 0.08, P = 0.79), nor an attentional state × memory interaction (saccade duration: F1,22 = 0.16, P = 0.69; fixations: F1,22 = 0.38, P = 0.55). For fixation duration, there were no main effects or interactions (main effect of state: F1,22 = 3.54, P = 0.07; main effect of memory: F1,22 = 1.60, P = 0.22; state × memory interaction: F1,22 = 0.09, P = 0.77).
Together, these results show that subsequently remembered and forgotten items were associated with similar eye movements. Thus, differences in fMRI activity or pattern similarity for subsequent hits and misses cannot be attributed to the frequency of saccades or fixations during encoding. Additionally, to the extent that saccades and fixations index sampling of task-relevant information, these data suggest that participants were not merely inattentive during the presentation of images that were subsequently forgotten.
Acknowledgments
This work was supported by National Institutes of Health Grant R01-EY021755 (to N.B.T-B.).
Footnotes
The authors declare no conflict of interest.
This article is a PNAS Direct Submission.
This article contains supporting information online at www.pnas.org/lookup/suppl/doi:10.1073/pnas.1518931113/-/DCSupplemental.
References
- 1.Chun MM, Golomb JD, Turk-Browne NB. A taxonomy of external and internal attention. Annu Rev Psychol. 2011;62:73–101. doi: 10.1146/annurev.psych.093008.100427. [DOI] [PubMed] [Google Scholar]
- 2.Maunsell JHR, Treue S. Feature-based attention in visual cortex. Trends Neurosci. 2006;29(6):317–322. doi: 10.1016/j.tins.2006.04.001. [DOI] [PubMed] [Google Scholar]
- 3.Chun MM, Turk-Browne NB. Interactions between attention and memory. Curr Opin Neurobiol. 2007;17(2):177–184. doi: 10.1016/j.conb.2007.03.005. [DOI] [PubMed] [Google Scholar]
- 4.Carr VA, Engel SA, Knowlton BJ. Top-down modulation of hippocampal encoding activity as measured by high-resolution functional MRI. Neuropsychologia. 2013;51(10):1829–1837. doi: 10.1016/j.neuropsychologia.2013.06.026. [DOI] [PMC free article] [PubMed] [Google Scholar]
- 5.Davachi L, Wagner AD. Hippocampal contributions to episodic encoding: Insights from relational and item-based learning. J Neurophysiol. 2002;88(2):982–990. doi: 10.1152/jn.2002.88.2.982. [DOI] [PubMed] [Google Scholar]
- 6.Kensinger EA, Clarke RJ, Corkin S. What neural correlates underlie successful encoding and retrieval? A functional magnetic resonance imaging study using a divided attention paradigm. J Neurosci. 2003;23(6):2407–2415. doi: 10.1523/JNEUROSCI.23-06-02407.2003. [DOI] [PMC free article] [PubMed] [Google Scholar]
- 7.Uncapher MR, Rugg MD. Selecting for memory? The influence of selective attention on the mnemonic binding of contextual information. J Neurosci. 2009;29(25):8270–8279. doi: 10.1523/JNEUROSCI.1043-09.2009. [DOI] [PMC free article] [PubMed] [Google Scholar]
- 8.Desimone R, Duncan J. Neural mechanisms of selective visual attention. Annu Rev Neurosci. 1995;18:193–222. doi: 10.1146/annurev.ne.18.030195.001205. [DOI] [PubMed] [Google Scholar]
- 9.Gilbert CD, Li W. Top-down influences on visual processing. Nat Rev Neurosci. 2013;14(5):350–363. doi: 10.1038/nrn3476. [DOI] [PMC free article] [PubMed] [Google Scholar]
- 10.Aly M, Turk-Browne NB. Attention stabilizes representations in the human hippocampus. Cereb Cortex. 2015 doi: 10.1093/cercor/bhv041. [DOI] [PMC free article] [PubMed] [Google Scholar]
- 11.Dudukovic NM, Preston AR, Archie JJ, Glover GH, Wagner AD. High-resolution fMRI reveals match enhancement and attentional modulation in the human medial temporal lobe. J Cogn Neurosci. 2011;23(3):670–682. doi: 10.1162/jocn.2010.21509. [DOI] [PMC free article] [PubMed] [Google Scholar]
- 12.O’Craven KM, Downing PE, Kanwisher N. fMRI evidence for objects as the units of attentional selection. Nature. 1999;401(6753):584–587. doi: 10.1038/44134. [DOI] [PubMed] [Google Scholar]
- 13.Muzzio IA, Kentros C, Kandel E. What is remembered? Role of attention on the encoding and retrieval of hippocampal representations. J Physiol. 2009;587(Pt 12):2837–2854. doi: 10.1113/jphysiol.2009.172445. [DOI] [PMC free article] [PubMed] [Google Scholar]
- 14.Rowland DC, Kentros CG. Potential anatomical basis for attentional modulation of hippocampal neurons. Ann N Y Acad Sci. 2008;1129:213–224. doi: 10.1196/annals.1417.014. [DOI] [PubMed] [Google Scholar]
- 15.Jackson J, Redish AD. Network dynamics of hippocampal cell-assemblies resemble multiple spatial maps within single tasks. Hippocampus. 2007;17(12):1209–1229. doi: 10.1002/hipo.20359. [DOI] [PubMed] [Google Scholar]
- 16.Kelemen E, Fenton AA. Dynamic grouping of hippocampal neural activity during cognitive control of two spatial frames. PLoS Biol. 2010;8(6):e1000403. doi: 10.1371/journal.pbio.1000403. [DOI] [PMC free article] [PubMed] [Google Scholar]
- 17.Fenton AA, et al. Attention-like modulation of hippocampus place cell discharge. J Neurosci. 2010;30(13):4613–4625. doi: 10.1523/JNEUROSCI.5576-09.2010. [DOI] [PMC free article] [PubMed] [Google Scholar]
- 18.Kentros CG, Agnihotri NT, Streater S, Hawkins RD, Kandel ER. Increased attention to spatial context increases both place field stability and spatial memory. Neuron. 2004;42(2):283–295. doi: 10.1016/s0896-6273(04)00192-8. [DOI] [PubMed] [Google Scholar]
- 19.Muzzio IA, et al. Attention enhances the retrieval and stability of visuospatial and olfactory representations in the dorsal hippocampus. PLoS Biol. 2009;7(6):e1000140. doi: 10.1371/journal.pbio.1000140. [DOI] [PMC free article] [PubMed] [Google Scholar]
- 20.Holdstock JS, et al. Under what conditions is recognition spared relative to recall after selective hippocampal damage in humans? Hippocampus. 2002;12(3):341–351. doi: 10.1002/hipo.10011. [DOI] [PubMed] [Google Scholar]
- 21.Norman KA, O’Reilly RC. Modeling hippocampal and neocortical contributions to recognition memory: A complementary-learning-systems approach. Psychol Rev. 2003;110(4):611–646. doi: 10.1037/0033-295X.110.4.611. [DOI] [PubMed] [Google Scholar]
- 22.Kim G, Lewis-Peacock JA, Norman KA, Turk-Browne NB. Pruning of memories by context-based prediction error. Proc Natl Acad Sci USA. 2014;111(24):8997–9002. doi: 10.1073/pnas.1319438111. [DOI] [PMC free article] [PubMed] [Google Scholar]
- 23.Wagner AD, et al. Building memories: Remembering and forgetting of verbal experiences as predicted by brain activity. Science. 1998;281(5380):1188–1191. doi: 10.1126/science.281.5380.1188. [DOI] [PubMed] [Google Scholar]
- 24.Eldridge LL, Engel SA, Zeineh MM, Bookheimer SY, Knowlton BJ. A dissociation of encoding and retrieval processes in the human hippocampus. J Neurosci. 2005;25(13):3280–3286. doi: 10.1523/JNEUROSCI.3420-04.2005. [DOI] [PMC free article] [PubMed] [Google Scholar]
- 25.Suthana NA, et al. High-resolution 7-Tesla fMRI of human hippocampal subfields during associative learning. J Cogn Neurosci. 2015;27(6):1194–1206. doi: 10.1162/jocn_a_00772. [DOI] [PMC free article] [PubMed] [Google Scholar]
- 26.Zeineh MM, Engel SA, Thompson PM, Bookheimer SY. Dynamics of the hippocampus during encoding and retrieval of face-name pairs. Science. 2003;299(5606):577–580. doi: 10.1126/science.1077775. [DOI] [PubMed] [Google Scholar]
- 27.Wolosin SM, Zeithamova D, Preston AR. Distributed hippocampal patterns that discriminate reward context are associated with enhanced associative binding. J Exp Psychol Gen. 2013;142(4):1264–1276. doi: 10.1037/a0033609. [DOI] [PMC free article] [PubMed] [Google Scholar]
- 28.Duncan K, Ketz N, Inati SJ, Davachi L. Evidence for area CA1 as a match/mismatch detector: A high-resolution fMRI study of the human hippocampus. Hippocampus. 2012;22(3):389–398. doi: 10.1002/hipo.20933. [DOI] [PMC free article] [PubMed] [Google Scholar]
- 29.Elfman KW, Aly M, Yonelinas AP. Neurocomputational account of memory and perception: Thresholded and graded signals in the hippocampus. Hippocampus. 2014;24(12):1672–1686. doi: 10.1002/hipo.22345. [DOI] [PubMed] [Google Scholar]
- 30.Hasselmo ME, Wyble BP. Free recall and recognition in a network model of the hippocampus: Simulating effects of scopolamine on human memory function. Behav Brain Res. 1997;89(1-2):1–34. doi: 10.1016/s0166-4328(97)00048-x. [DOI] [PubMed] [Google Scholar]
- 31.Carr VA, Rissman J, Wagner AD. Imaging the human medial temporal lobe with high-resolution fMRI. Neuron. 2010;65(3):298–308. doi: 10.1016/j.neuron.2009.12.022. [DOI] [PMC free article] [PubMed] [Google Scholar]
- 32.Yassa MA, Stark CEL. Pattern separation in the hippocampus. Trends Neurosci. 2011;34(10):515–525. doi: 10.1016/j.tins.2011.06.006. [DOI] [PMC free article] [PubMed] [Google Scholar]
- 33.Bonnici HM, et al. Multi-voxel pattern analysis in human hippocampal subfields. Front Hum Neurosci. 2012;6:Article 290. doi: 10.3389/fnhum.2012.00290. [DOI] [PMC free article] [PubMed] [Google Scholar]
- 34.Chadwick MJ, Bonnici HM, Maguire EA. CA3 size predicts the precision of memory recall. Proc Natl Acad Sci USA. 2014;111(29):10720–10725. doi: 10.1073/pnas.1319641111. [DOI] [PMC free article] [PubMed] [Google Scholar]
- 35.Diana RA, Yonelinas AP, Ranganath C. Imaging recollection and familiarity in the medial temporal lobe: A three-component model. Trends Cogn Sci. 2007;11(9):379–386. doi: 10.1016/j.tics.2007.08.001. [DOI] [PubMed] [Google Scholar]
- 36.Yonelinas AP, Aly M, Wang W-C, Koen JD. Recollection and familiarity: Examining controversial assumptions and new directions. Hippocampus. 2010;20(11):1178–1194. doi: 10.1002/hipo.20864. [DOI] [PMC free article] [PubMed] [Google Scholar]
- 37.LaRocque KF, et al. Global similarity and pattern separation in the human medial temporal lobe predict subsequent memory. J Neurosci. 2013;33(13):5466–5474. doi: 10.1523/JNEUROSCI.4293-12.2013. [DOI] [PMC free article] [PubMed] [Google Scholar]
- 38.Watanabe T, et al. Prediction of subsequent recognition performance using brain activity in the medial temporal lobe. Neuroimage. 2011;54(4):3085–3092. doi: 10.1016/j.neuroimage.2010.10.066. [DOI] [PubMed] [Google Scholar]
- 39.Xue G, et al. Greater neural pattern similarity across repetitions is associated with better memory. Science. 2010;330(6000):97–101. doi: 10.1126/science.1193125. [DOI] [PMC free article] [PubMed] [Google Scholar]
- 40.Brewer JB, Zhao Z, Desmond JE, Glover GH, Gabrieli JDE. Making memories: brain activity that predicts how well visual experience will be remembered. Science. 1998;281(5380):1185–1187. doi: 10.1126/science.281.5380.1185. [DOI] [PubMed] [Google Scholar]
- 41.Coutanche MN, Thompson-Schill SL. Informational connectivity: Identifying synchronized discriminability of multi-voxel patterns across the brain. Front Hum Neurosci. 2013;7:Article 15. doi: 10.3389/fnhum.2013.00015. [DOI] [PMC free article] [PubMed] [Google Scholar]
- 42.Kriegeskorte N, Mur M, Bandettini P. Representational similarity analysis—Connecting the branches of systems neuroscience. Front Hum Neurosci. 2008;2:Article 4. doi: 10.3389/neuro.06.004.2008. [DOI] [PMC free article] [PubMed] [Google Scholar]
- 43.Rissman J, Wagner AD. Distributed representations in memory: Insights from functional brain imaging. Annu Rev Psychol. 2012;63:101–128. doi: 10.1146/annurev-psych-120710-100344. [DOI] [PMC free article] [PubMed] [Google Scholar]
- 44.Kuhl BA, Rissman J, Wagner AD. Multi-voxel patterns of visual category representation during episodic encoding are predictive of subsequent memory. Neuropsychologia. 2012;50(4):458–469. doi: 10.1016/j.neuropsychologia.2011.09.002. [DOI] [PMC free article] [PubMed] [Google Scholar]
- 45.Summerfield C, Egner T. Expectation (and attention) in visual cognition. Trends Cogn Sci. 2009;13(9):403–409. doi: 10.1016/j.tics.2009.06.003. [DOI] [PubMed] [Google Scholar]
- 46.Copara MS, et al. Complementary roles of human hippocampal subregions during retrieval of spatiotemporal context. J Neurosci. 2014;34(20):6834–6842. doi: 10.1523/JNEUROSCI.5341-13.2014. [DOI] [PMC free article] [PubMed] [Google Scholar]
- 47.Bakker A, Kirwan CB, Miller M, Stark CEL. Pattern separation in the human hippocampal CA3 and dentate gyrus. Science. 2008;319(5870):1640–1642. doi: 10.1126/science.1152882. [DOI] [PMC free article] [PubMed] [Google Scholar]
- 48.Epstein RA. Parahippocampal and retrosplenial contributions to human spatial navigation. Trends Cogn Sci. 2008;12(10):388–396. doi: 10.1016/j.tics.2008.07.004. [DOI] [PMC free article] [PubMed] [Google Scholar]
- 49.Lee ACH, Yeung L-K, Barense MD. The hippocampus and visual perception. Front Hum Neurosci. 2012;6(91):91. doi: 10.3389/fnhum.2012.00091. [DOI] [PMC free article] [PubMed] [Google Scholar]
- 50.Ranganath C, Ritchey M. Two cortical systems for memory-guided behaviour. Nat Rev Neurosci. 2012;13(10):713–726. doi: 10.1038/nrn3338. [DOI] [PubMed] [Google Scholar]
- 51.Vann SD, Aggleton JP, Maguire EA. What does the retrosplenial cortex do? Nat Rev Neurosci. 2009;10(11):792–802. doi: 10.1038/nrn2733. [DOI] [PubMed] [Google Scholar]
- 52.Byrne P, Becker S, Burgess N. Remembering the past and imagining the future: A neural model of spatial memory and imagery. Psychol Rev. 2007;114(2):340–375. doi: 10.1037/0033-295X.114.2.340. [DOI] [PMC free article] [PubMed] [Google Scholar]
- 53.Epstein RA, Parker WE, Feiler AM. Where am I now? Distinct roles for parahippocampal and retrosplenial cortices in place recognition. J Neurosci. 2007;27(23):6141–6149. doi: 10.1523/JNEUROSCI.0799-07.2007. [DOI] [PMC free article] [PubMed] [Google Scholar]
- 54.Park S, Chun MM. Different roles of the parahippocampal place area (PPA) and retrosplenial cortex (RSC) in panoramic scene perception. Neuroimage. 2009;47(4):1747–1756. doi: 10.1016/j.neuroimage.2009.04.058. [DOI] [PMC free article] [PubMed] [Google Scholar]
- 55.Aly M, Ranganath C, Yonelinas AP. Detecting changes in scenes: The hippocampus is critical for strength-based perception. Neuron. 2013;78(6):1127–1137. doi: 10.1016/j.neuron.2013.04.018. [DOI] [PMC free article] [PubMed] [Google Scholar]
- 56.Zeidman P, Mullally SL, Maguire EA. Constructing, perceiving, and maintaining scenes: Hippocampal activity and connectivity. Cereb Cortex. 2015;25(10):3836–3855. doi: 10.1093/cercor/bhu266. [DOI] [PMC free article] [PubMed] [Google Scholar]
- 57.Smith SM, Nichols TE. Threshold-free cluster enhancement: Addressing problems of smoothing, threshold dependence and localisation in cluster inference. Neuroimage. 2009;44(1):83–98. doi: 10.1016/j.neuroimage.2008.03.061. [DOI] [PubMed] [Google Scholar]
- 58.Efron B, Tibshirani R. Bootstrap methods for standard errors, confidence intervals, and other measures of statistical accuracy. Stat Sci. 1986;1(1):54–77. [Google Scholar]
- 59.Kimmig H, et al. Relationship between saccadic eye movements and cortical activity as measured by fMRI: Quantitative and qualitative aspects. Exp Brain Res. 2001;141(2):184–194. doi: 10.1007/s002210100844. [DOI] [PubMed] [Google Scholar]
- 60.Pernet CR, Wilcox R, Rousselet GA. Robust correlation analyses: False positive and power validation using a new open source Matlab toolbox. Front Psychol. 2012;3:606. doi: 10.3389/fpsyg.2012.00606. [DOI] [PMC free article] [PubMed] [Google Scholar]


