Significance
Cell migration and adhesion play critical roles in animal development and tumor metastasis and are regulated by protein phosphorylation. Here we identified the human phosphatase hCDC14A (human cell-division cycle 14A) as F-actin binding protein at the leading edge that regulates both processes. Loss of hCDC14A activity promotes cell mobility and reduces cell adhesion. Importantly, cells devoid of hCDC14A activity were more invasive in a colony-forming assay. Database analysis indicates that hCDC14A expression is frequently down-regulated in cancer tissues and is associated with poor patient prognosis. Thus, the promigratory impact of hCDC14A inactivation upon the F-actin cytoskeleton supports tumor proliferation and metastasis. This hCDC14A function is clearly distinct from the mitotic functions of the budding and fission yeast orthologs Cdc14/Flp1.
Keywords: CDC14, cell migration, cell adhesion, phosphatase
Abstract
Cell adhesion and migration are highly dynamic biological processes that play important roles in organ development and cancer metastasis. Their tight regulation by small GTPases and protein phosphorylation make interrogation of these key processes of great importance. We now show that the conserved dual-specificity phosphatase human cell-division cycle 14A (hCDC14A) associates with the actin cytoskeleton of human cells. To understand hCDC14A function at this location, we manipulated native loci to ablate hCDC14A phosphatase activity (hCDC14APD) in untransformed hTERT-RPE1 and colorectal cancer (HCT116) cell lines and expressed the phosphatase in HeLa FRT T-Rex cells. Ectopic expression of hCDC14A induced stress fiber formation, whereas stress fibers were diminished in hCDC14APD cells. hCDC14APD cells displayed faster cell migration and less adhesion than wild-type controls. hCDC14A colocalized with the hCDC14A substrate kidney- and brain-expressed protein (KIBRA) at the cell leading edge and overexpression of KIBRA was able to reverse the phenotypes of hCDC14APD cells. Finally, we show that ablation of hCDC14A activity increased the aggressive nature of cells in an in vitro tumor formation assay. Consistently, hCDC14A is down-regulated in many tumor tissues and reduced hCDC14A expression is correlated with poorer survival of patients with cancer, to suggest that hCDC14A may directly contribute to the metastatic potential of tumors. Thus, we have uncovered an unanticipated role for hCDC14A in cell migration and adhesion that is clearly distinct from the mitotic and cytokinesis functions of Cdc14/Flp1 in budding and fission yeast.
Cell migration and adhesion play key roles in embryonic development, tissue remodeling and cancer metastasis (1). Many oncoproteins, such as Yes-associated protein 1 (YAP), STAT3, and K-RAS, regulate cancer metastasis by enhancing cell migration and invasion (2–4). The dynamic behavior of the actin cytoskeleton drives migration and invasion and is regulated by a combined impact of Rho GTPases, membrane phospholipids, and protein phosphorylation (5). The switch of phosphorylation at the cell leading edge is crucial for rapid turnover of actin filaments. For example, focal adhesion kinase (FAK) can be activated by integrins and various growth factors. Once activated, FAK regulates actin polymerization, membrane protrusion and cell migration by promoting the phosphorylation of the actin cytoskeleton remodelers p130cas, GRB2/7, and WASP (5, 6). The tyrosine phosphatase SHP2 increases cell mobility through activation of the SRC kinase family to promote tumor metastasis (7). Conversely, the lipid phosphatase PTEN inhibits tumor invasion by suppressing the activation of RAC GTPases (8). There is also extensive evidence for control of cancer cell migration and invasion through the phosphatase PP2A upon Wnt/beta-catenin signaling, metal matrix proteases, and ERK kinase (9–11).
At the G2/M transition, cyclin-dependent kinase 1 (CDK1) is activated to trigger mitotic entry and its kinase activity remains high until metaphase to maintain the cell in a mitotic state (12). With mitotic exit, the proteins that were phosphorylated by CDK1 are dephosphorylated, so that cells can return to the nonmitotic, interphase status (13). In Saccharomyces cerevisiae, cell-division cycle 14 (Cdc14) is the major phosphatase that counteracts Cdk1 activity after the metaphase–anaphase transition (14). The function of Cdc14 in budding yeast has been well studied and two regulatory networks have been identified that promote the release of Cdc14 from the RENT complex in the nucleolus: “Cdc Fourteen Early Anaphase Release” (FEAR) and “Mitotic Exit Network” (MEN) (15–17).
Despite the conservation of the N-terminal catalytic phosphatase domain and the ability of human CDC14B to complement the essential functions of budding yeast CDC14 (18), Cdc14 phosphatases play divergent roles in different organisms. Schizosaccharomyces pombe Cdc14/Flp1 primarily participates in the regulation of the phosphatase Cdc25 and cytokinesis (19). Vertebrate CDC14s have been linked to diverse functions ranging from centrosome maturation and separation, DNA damage checkpoint control, DNA repair, and cytokinesis control (20–24). These studies have unraveled novel functions of mammalian CDC14 phosphatases; however, they reveal striking inadequacies in our understanding of this important phosphatase family.
Here, we have addressed the function of hCDC14A (human cell-division cycle 14A) using human genetically engineered hCDC14A phosphatase dead cell lines (PD). Mobility and spreading were both enhanced by ablation of hCDC14A, whereas cell–cell adhesion was reduced. Moreover, ectopic hCDC14A expression inhibited migration and the actin cytoskeleton was remodeled when hCDC14A activity was impaired. Consistent with these actin-modulating functions, a pool of hCDC14A associated with F-actin filaments at the leading edge where it colocalized with the Hippo pathway component kidney- and brain-expressed protein (KIBRA). KIBRA overproduction rescued the migration and adhesion defects in the hCDC14APD cells. Our study therefore reveals a previously unidentified function of hCDC14A. As hCDC14A expression is down-regulated in a variety of cancers, including colorectal, and this down-regulation is associated with poor prognosis, our results suggest that hCDC14A regulates tumor metastasis and is therefore of considerable clinical relevance.
Results
A Pool of hCDC14A Localizes to the Cell Leading Edge and F-Actin Fibers.
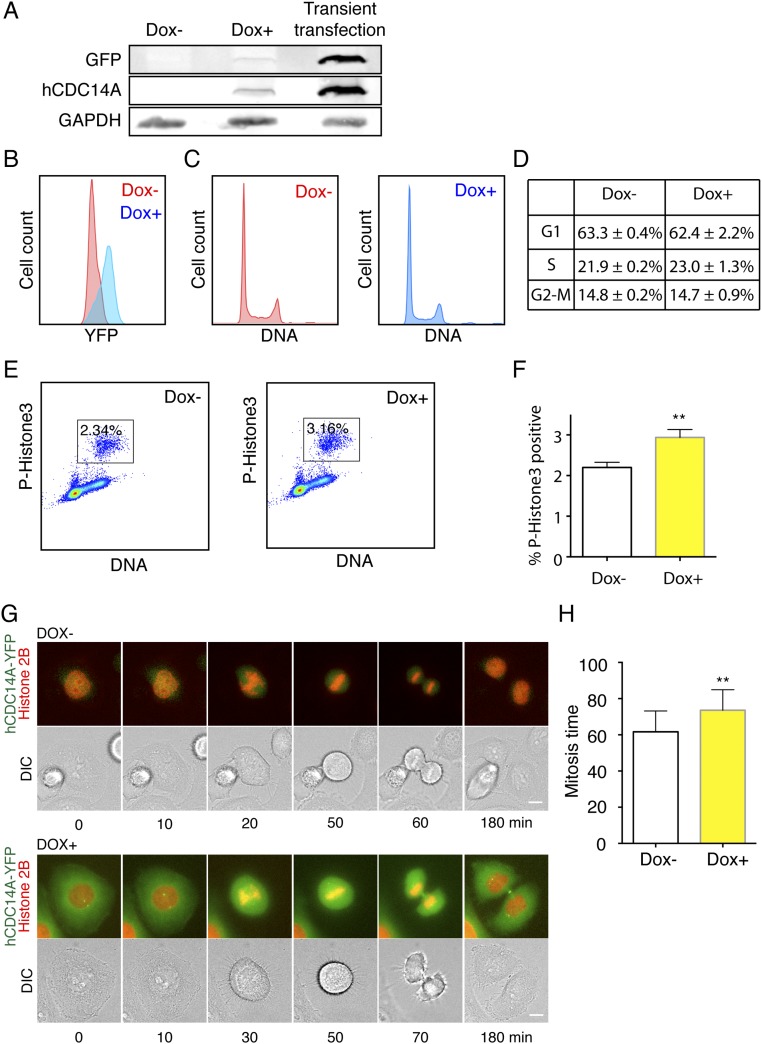
Whether hCDC14 phosphatases impact upon actin-related functions is yet to be addressed. To this end, we monitored the distribution of a hCDC14A-YFP fusion protein stably integrated in the HeLa cell genome as a single copy via the Flp-in T-Rex system. The levels of ectopic hCDC14A expression achieved by induction were much lower than those arising from transient transfection (Fig. S1A) and did not generate obvious toxicity or adverse impact upon cell cycle progression based on the propidium iodide DNA staining (Fig. S1 B–D). Phosphohistone 3 serine 10 staining revealed that the ectopic expression of hCDC14A only slightly increased the mitotic index (Fig. S1 E and F). This was further confirmed by live cell imaging, which revealed only a modest increase in the duration of mitosis upon ectopic hCDC14A expression (Fig. S1 G and H).
Fig. S1.
Impact of ectopic hCDC14A expression upon doxycycline induction on cell cycle progression. (A) Comparison of hCDC14A levels between stable HeLa FRT cell lines and transient transfection by immunoblotting. GAPDH is the loading control. (B) Flow cytometry showed the induction of hCDC14A-YFP after adding doxycycline (blue curve). (C) Flow cytometry of HeLa FRT T-Rex cells without (Dox−) or with (Dox+) ectopic hCDC14A expression. (D) Statistics of the cell cycle phase distribution without (Dox−) or with (Dox+) ectopic hCDC14A expression. (E) Mitotic index of cells without (Dox−) or with (Dox+) ectopic hCDC14A expression. Cells were stained with phosphohistone 3 (serine 10) antibodies. (F) Statistics of E. **P < 0.01. (G) Mitotic progression of HeLa FRT hCDC14A-YFP stable cells transfected with Di-HcRed-histone 2B were measured by live cell imaging. To induce hCDC14A-YFP expression, doxycycline was added 24 h before live cell imaging. (Scale bar: 10 µm.) (H) Statistics of G. **P < 0.01. n = 20.
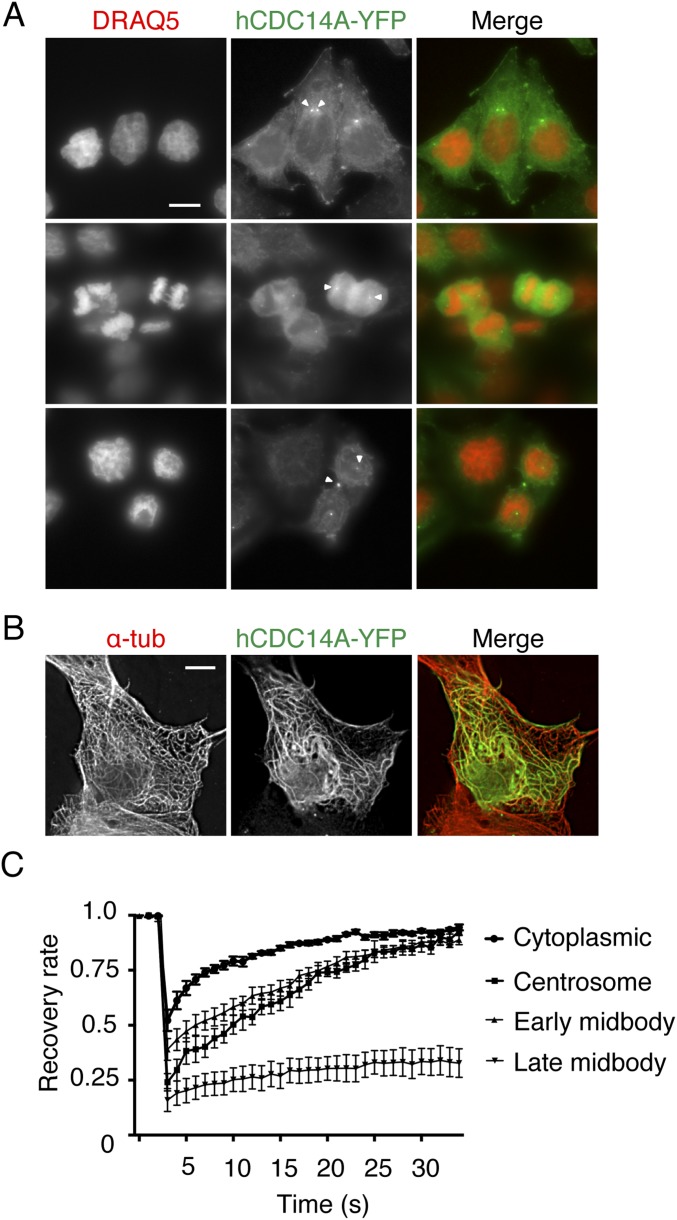
As in previous reports (22, 25), hCDC14A was found in the cytoplasm, at centrosomes of interphase cells and at the midbody during cytokinesis (Fig. S2A). In the Flp-in T-Rex cell line, we failed to detect the reported association of hCDC14A with microtubules (18). However, strong overexpression of hCDC14A-YFP through transient transfection generated a signal that showed partial overlap with microtubules (Fig. S2B). Fluorescence recovery after photobleaching (FRAP) analysis revealed different rates of recovery for hCDC14A at different locations. In general, hCDC14A was quite dynamic (half recovery time <10 s, Fig. S2C) with the exception of the late midbody pool that was relatively immobile (Fig. S2C). Thus, hCDC14A binds dynamically to the centrosome and early midbody.
Fig. S2.
hCDC14A localization in different cell cycle phase, microtubule localization of hCDC14A in transient transfection, and hCDC14A-YFP FRAP. (A) Localization of hCDC14A throughout the cell cycle. HeLa FRT T-Rex cells stably expressing hCDC14A-YFP were incubated with the DNA dye DRAQ5 for 30 min. In interphase cells, hCDC14A localized to the centrosome and the cell leading edge. In mitotic cells, hCDC14A localized to centrosomes. At cytokinesis, hCDC14A localized to centrosomes and the midbody. (B) RPE1 cells with a high level of ectopic hCDC14A-YFP showed microtubule localization of hCDC14A. (Scale bar: 10 µm.) (C) FRAP of hCDC14A-YFP pools in HeLa FRT T-Rex cells of B. n = 10. Error bars are ±SEM of individual cells.
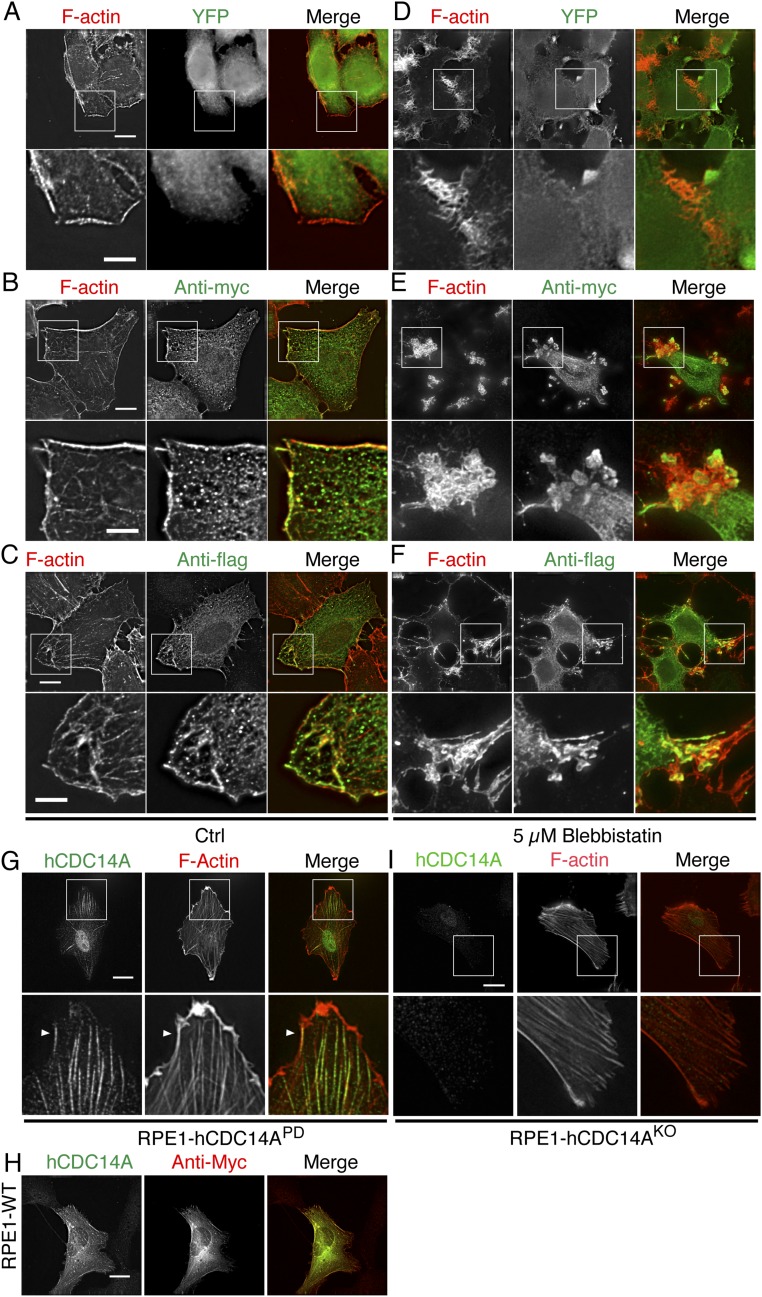
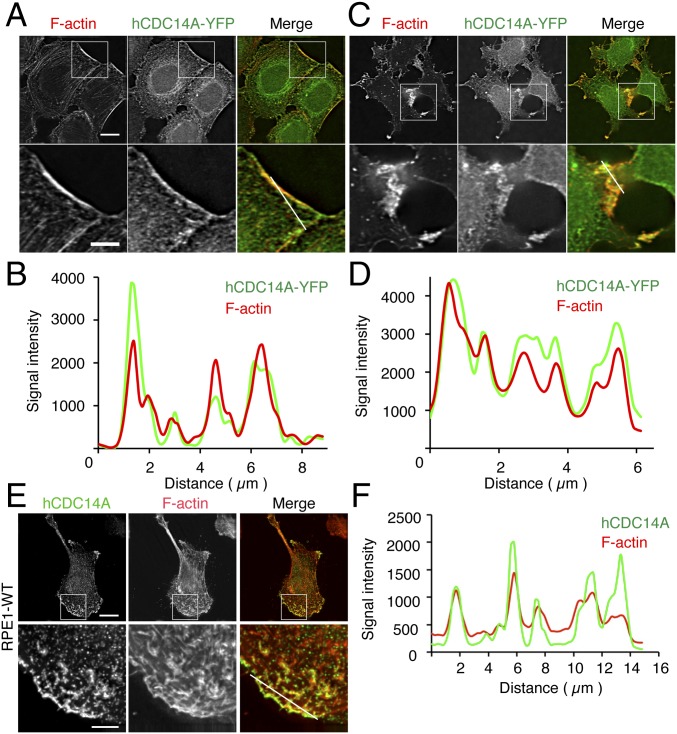
Importantly, hCDC14A-YFP, but not YFP (Fig. S3A), localized to the protruding actin filaments at the leading edge of HeLa cells (Fig. 1A). Line scans of GFP nanobody and phalloidin stainings revealed extensive overlap between the hCDC14A-YFP and F-actin signals in these protruding areas (Fig. 1B). To exclude the possibility that this apparent colocalization was a property bestowed by the YFP tag, we transfected myc-hCDC14A or flag-hCDC14A into HeLa cells. These hCDC14A constructs exhibited similar colocalization with F-actin structures as shown by hCDC14-YFP (Fig. S3 B and C). To determine whether hCDC14A localization changes upon perturbation of the F-actin cytoskeleton, we treated cells with blebbistatin, a myosin II inhibitor that inhibits F-actin formation. Blebbistatin treatment prompted all three tagged versions of hCDC14A to join F-actin remnants in relocalizing to peripheral regions of the cell (Fig. 1 C and D and Fig. S3 E and F), whereas unfused YFP did not colocalize with these collapsed F-actin structures (Fig. S3D).
Fig. S3.
Different tagged hCDC14A localized to F-actin at the leading edge and responded to blebbistatin treatment. (A–C) myc- (B) and flag-tagged hCDC14A (C) were colocalized with F-actin at the cell leading edge, whereas YFP (A) itself did not have this colocalization. (Lower) Regional magnification of the Upper panel. (Scale bars: Upper, 10 µm; Lower, 5 µm.) (D–F) Myc- (E) and flag-tagged hCDC14A (F) relocalized to the remnants of F-actin upon blebbistatin treatment, whereas YFP (D) itself did not have this relocalization. (Lower) Regional magnification of the Upper panel. (Scale bars: Upper, 10 µm; Lower, 5 µm.) (G) hCDC14A antibodies gave a signal on F-actin fibers near the cell leading edge (arrowheads). (Lower) Magnification of the boxed area in the Upper panel. (Scale bar: 20 µm.) (H) RPE1 WT cells were transfected with myc-hCDC14A. Cells were analyzed by indirect immunofluorescence with anti-hCDC14A and anti-myc antibodies. (Scale bar: 10 µm.) (I) The hCDC14A signal is no longer detectable in the RPE1 hCDC14AKO cells. Indirect immunofluorescence as in Fig. 1E using RPE1 hCDC14AKO cells. (Scale bar: 20 µm.)
Fig. 1.
hCDC14A colocalizes with F-actin at the cell leading edge. (A) hCDC14A-YFP colocalizes with F-actin at the leading edge of HeLa FRT T-Rex hCDC14A-YFP cells (Upper). (Scale bar: 10 µm.) (Lower) Regional magnification of the boxed area in the Upper panel. (Scale bar: 5 µm.) The white line indicates the scanned segment in B. (B) Line scan of hCDC14A-YFP and F-actin from A. (C) hCDC14A-YFP relocalizes with F-actin remnants after blebbistatin treatment. (Lower) Regional magnification of the area highlighted in the Upper panel. The white line indicates the scanned segment that is shown in D as line scan. (D) Line scan of hCDC14A-YFP and F-actin from C. (E) Anti-hCDC14A antibodies show colocalization with F-actin at the leading edge of RPE1 WT cells. (Scale bar: 20 µm.) (Lower) Regional magnification of the Upper panel. (Scale bar: 4 µm.) The white line indicates the scanned segment in F. (F) Line scan of the hCDC14A and F-actin signals from E.
We next monitored the distribution of endogenous hCDC14A with polyclonal antibodies that had been raised against the divergent C terminus of hCDC14A (26, 27). These anti-hCDC14A antibodies costained the cell leading edge and the nearby actin filaments (Fig. 1 E and F and Fig. S3G). Two lines of evidence suggest that this staining was specific. First, this antibody recognized overexpressed myc-hCDC14A as the myc and hCDC14A signals overlapped (Fig. S3H). Second, the F-actin associated signal of the anti-hCDC14A antibodies was not observed in hTERT-immortalized retinal pigment epithelial (RPE1) hCDC14AKO cells (Fig. S3I) from which exon 2 had been removed to introduce a frameshift that blocked the production of hCDC14A protein (22). We note that the anti-hCDC14A antibodies detected a weak nuclear signal that may arise from the cross-reactivity with a nuclear protein in some RPE1 hCDC14AKO cells. The inability of the anti-hCDC14A antibody to detect the protein in immunoblots suggests that it recognizes a conformation-specific antigen.
Taken together, our data indicate that a fraction of hCDC14A associates with F-actin along the leading edge of cells.
hCDC14APD Cell Lines.
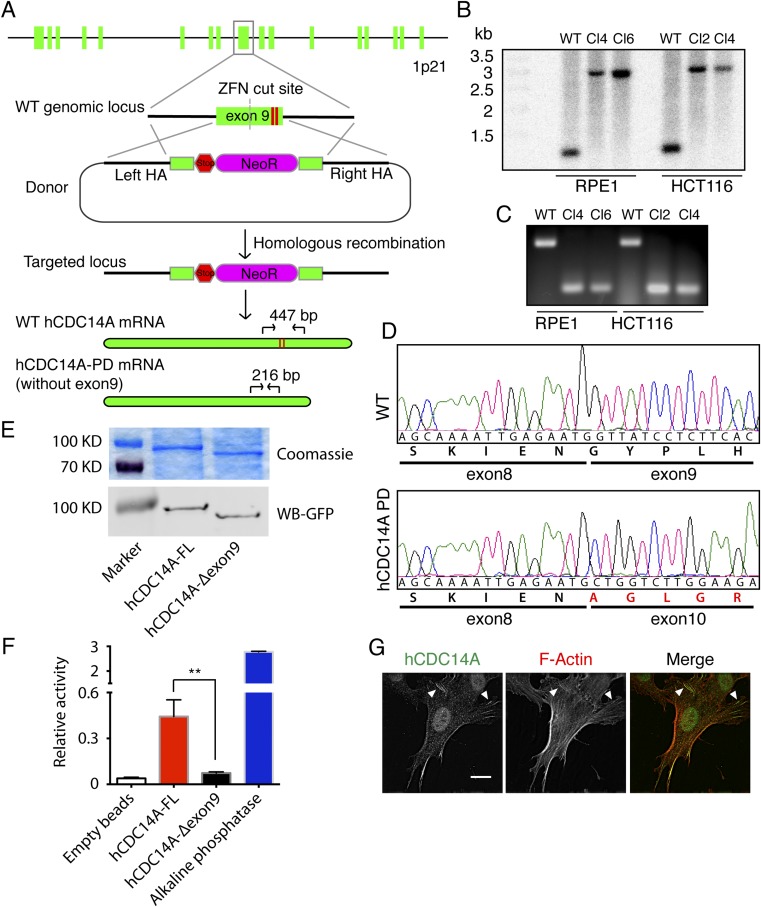
Studies that relied upon siRNA depletion of hCDC14A/B have revealed a number of functions of these phosphatases but a coherent picture as to hCDC14 functions is yet to emerge (20–22, 24, 25, 28). We therefore turned to genome editing as a strategy for hCDC14A inactivation. We previously reported the construction of an RPE1 hCDC14AKO cell line through two rounds of adenovirus-mediated gene knockout (22). However, for confident interpretation of phenotypic analysis, it was important to study independent gene knockout clones to exclude the possibility of clonal variation. In addition, we wanted to analyze hCDC14KO phenotypes in cell lines of different origins. We therefore constructed independent cell lines that lacked hCDC14A activity by using zinc finger nuclease (ZFN)-induced homolog recombination (29). We chose RPE1 and human colon cancer (HCT116) cells because they each have a stable genotype (30). Phosphatase activity of hCDC14A critically depends on three amino acid residues, of which D251 and C278 are encoded by exon 9 (31). Mutant yeast Cdc14 and human CDC14 proteins that harbor a mutation at C278 are catalytically inactive and nonfunctional (20, 32, 33). We therefore chose to interfere with hCDC14A’s phosphatase activity by targeting exon 9.
A ZFN cut in exon 9 together in the presence of a homologous neomycin resistance donor cassette (Fig. S4A) induced homologous recombination. Southern blot analysis indicated that exon 9 had been successfully targeted by our strategy and that the donor was integrated into the ZFN cut site (Fig. S4B). To further confirm disruption of exon 9, we carried out RT-PCR to amplify the mRNA of hCDC14A from the wild-type (WT) cells and putative hCDC14A-KO (knockout) clones of both cell lines. Surprisingly, in clones from either cell line the hCDC14A RT-PCR detected a band of 216 bp in hCDC14A-KO cells, whereas the PCR product was 447 bp in wild-type cells (Fig. S4C). Sequence analysis indicated that exon 9 together with the neomycin gene was spliced out in the mRNA of the hCDC14A-KO cells (Fig. S4D). The exon 9-skipped mRNA lacked exon 9 of 231 nucleotides, and so encoded a protein with an internal deletion of 77 amino acids. This truncated hCDC14A no longer carried the two essential D251 and C278 residues and so should lack phosphatase activity. This was confirmed by an in vitro phosphatase assay using immunoprecipitated hCDC14A-Δexon9 from transfected HEK 293T cells (Fig. S4 E and F). We therefore named these cell lines hCDC14APD (phosphatase dead). Analysis of these cells by indirect immunofluorescence confirmed the presence of the hCDC14APD mutant protein (Fig. S4G).
Fig. S4.
hCDC14APD cell lines and phosphatase assay. (A) Strategy for construction of hCDC14APD cell lines. A pair of custom-designed zinc finger nucleases (ZFNs) that specifically cut in exon 9 (the two red lines represented D251 and C278, two essential residues for phosphatase activity) of the hCDC14A gene locus was used to generate a double strand break (DSB). A DNA donor containing two homologous arms, stop codon, and neomycin resistance cassette was used to repair the DSB via homologous recombination. This resulted in a truncated hCDC14A protein lacking an essential region that is needed for phosphatase activity. Primers that bound to exons 8 and 10 were used to amplify the target region (shown in mRNA graphs at the Bottom). (B) Southern blot of WT and mutant RPE1 and HCT116 cells. The genomic DNA was digested by HindIII and then analyzed with a probe that bound to the left homology arm. The result shows that RPE1 clones 4 and 6 and HCT116 clones 2 and 4 were successfully targeted (2.9 kb versus 1.2 kb). (C) RT-PCR confirmation of the positive clones. In WT sample, primers that bound to exons 8 and 10 (see A) amplified a fragment that was 447 bp long. In double allele knockout samples, the size of the fragment was 216 bp due to exon 9 loss. (D) DNA sequencing of the RT-PCR products from C confirmed the loss of exon 9 in the hCDC14A mRNA of hCDC14PD cells. (E, Upper) Coomassie staining showed the immunoprecipitated full-length hCDC14A-YFP (FL) and the truncated hCDC14A-Δexon9-YFP. (Lower) Immunoblot of the precipitated hCDC14A proteins using GFP antibodies. (F) Quantification of the in vitro phosphatase assay. The truncated hCDC14A-Δexon9-YFP is phosphatase dead. **P < 0.01. (G) Anti-hCDC14A antibodies detected the hCDC14APD protein by indirect immunofluorescence. White arrowheads indicate colocalization of hCDC14APD and F-actin. (Scale bar: 20 µm.)
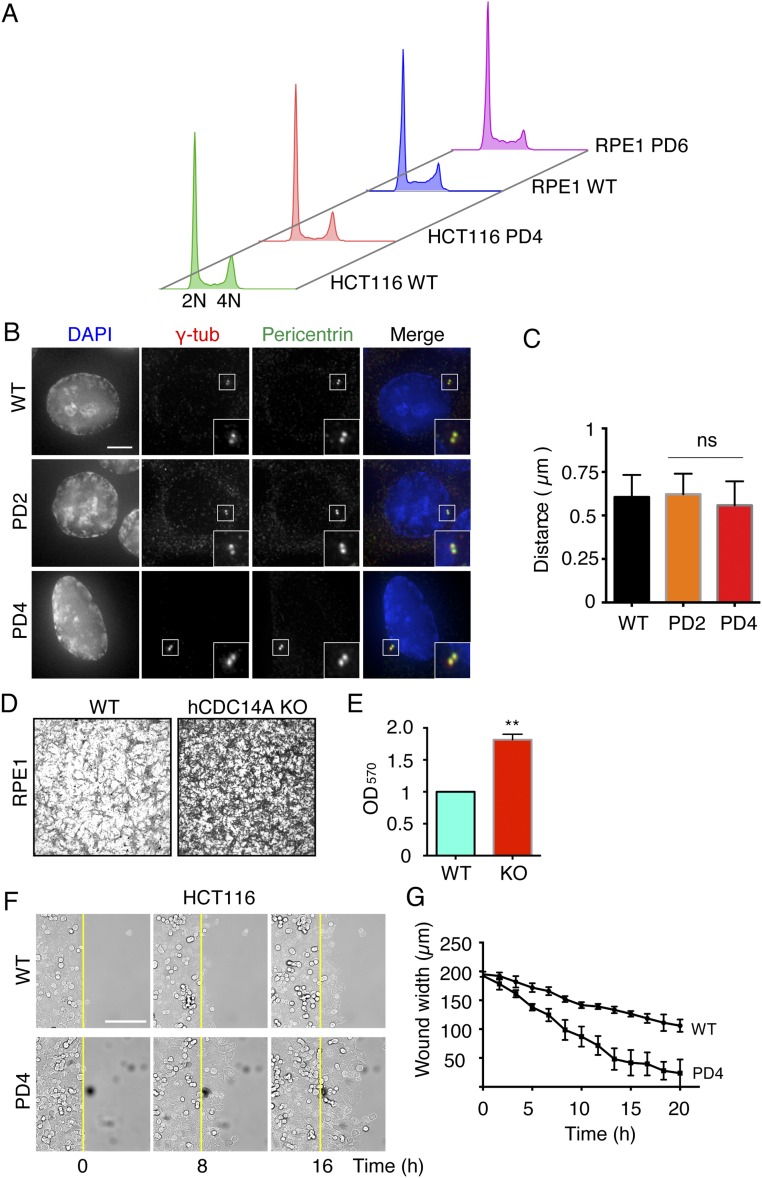
Consistent with previous reports of hCDC14KO cells (22, 28), the hCDC14APD cells were viable. Flow cytometry (FACS) comparisons with WT cells revealed no significant differences in the distribution of cell cycle phases in hCDC14APD (Fig. S5A). Moreover, centrosome number and centrosome separation distances of HCT116 hCDC14APD cells were indistinguishable from the behavior of WT hCDC14A cells (Fig. S5 B and C). We therefore concluded that hCDC14A is not essential for cell viability, centrosome duplication, and centrosome linker assembly in either HCT116 or RPE1 cells.
Fig. S5.
Flow cytometry of cell cycle analysis and centrosome distance between WT and hCDC14PD cells. (A) Cell cycle analysis by flow cytometry between HCT116 WT and HCT116 hCDC14APD cells, RPE1 WT and RPE1 hCDC14APD cells. (B) Centrosome separation distance in HCT116 WT and hCDC14APD cells. (Scale bar: 5 µm.) (C) Quantification of B. n = 50–75. Error bars are ± SD between individual cells. (D) Representative view of the Transwell membrane. RPE1 WT and RPE1 hCDC14AKO cells were used in this experiment. See Fig. 2A for details. (E) Quantification of the result from D. n = 3. Error bars are ±SEM between three independent experiments. **P < 0.01. (F) Wound healing assay of HCT116 WT (Upper) and HCT116 hCDC14APD cells (Lower). (Scale bar: 100 µm.) (G) Quantification of F. n = 3. Error bars are ±SEM between three independent experiments. **P < 0.01.
hCDC14A Regulates Cell Mobility.
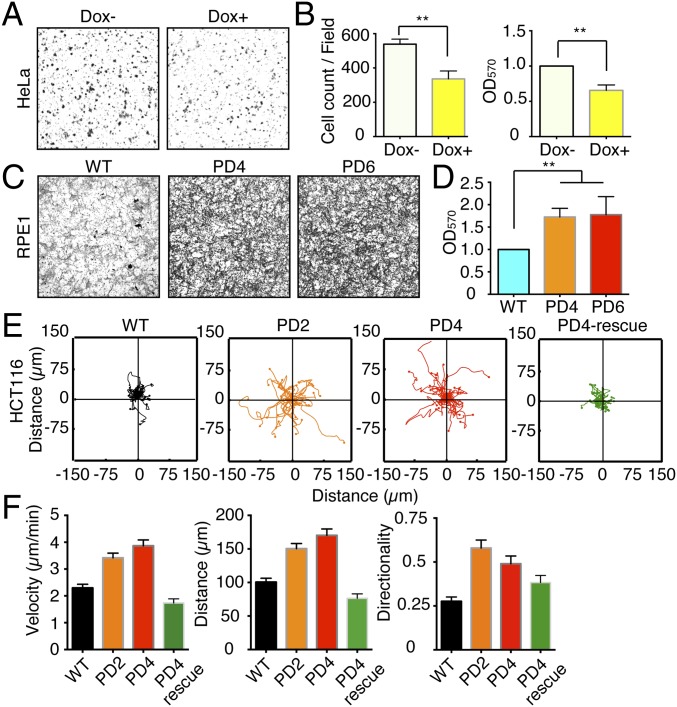
Given the colocalization of hCDC14A with F-actin at the leading edge of cells, we asked whether hCDC14A has a function in cell migration. We used four different assays to address this question. First, we used Transwell chambers to test the migratory behavior of Flp-in T-Rex HeLa cells following doxycycline-induced expression of hCDC14A. hCDC14A expression led to a 1.8-fold decrease in cell migration in the Transwell assay (Fig. 2 A and B). We then monitored the RPE1 hCDC14APD cell line in the same assay. The fibroblast-like morphology of RPE1 cells made it difficult to score cell number on the chamber membrane. To circumvent this problem, we stained the cells with crystal purple before eluting the dye with acetic acid from the attached cells. Compared with WT cells, both independent hCDC14APD clones 4 and 6 displayed patterns that were indicative of enhanced cell migration (Fig. 2 C and D). Enhanced migration was also seen in the RPE1 hCDC14AKO cell line (Fig. S5 D and E). We therefore conclude that hCDC14A normally restrains migration of HeLa and RPE1 cells.
Fig. 2.
hCDC14A regulates cell mobility. (A) Representative view of Transwell membranes. HeLa FRT T-Rex hCDC14A inducible cells cultured for 24 h with or without doxycycline in a Transwell chamber. Cells on the transside of the chamber were fixed and stained with crystal violet. (B) Quantification of A. The cell number was counted (Left graphs) or the crystal violet was eluted with 30% acidic acid and then measured at 570 nm (Right graphs). n = 3. Error bars are ±SEM of three independent experiments. (C) Representative view of the Transwell membrane. RPE1 WT and RPE1 hCDC14APD clones 4 and 6 were used in this experiment. (D) Quantification of C using crystal violet as in B. n = 3. Error bars are ±SEM between three independent experiments. (E) Plot graphs of cell tracking experiments. HCT116 WT cells, HCT116 hCDC14APD clones 2 and 4, and HCT116 hCDC14APD clone 4 transfected with hCDC14A-YFP (PD4-rescue) were seeded onto the live-imaging chamber and tracked for 4 h. (F) Quantification of E. HCT116 hCDC14APD clones 2 and 4 migrate faster than the HCT116 WT cells. This enhanced migratory phenotype was reversed to wild-type levels by the introduction of hCDC14A-YFP into the HCT116 hCDC14APD cells (PD4-rescue). n = 25–30. Error bars are ±SEM of individual cells.
We next asked whether the observations made in HeLa and RPE1 cells also applied to HCT116 cells. We measured the mobility of adherent WT and hCDC14APD HCT116 cells by live cell imaging. The WT and two independent hCDC14APD clones, clones 2 and 4, were seeded onto the fibronectin-coated surface and allowed to attach for 24 h before measuring cell migration. Cell tracking revealed that both of the HCT116 hCDC14APD clones migrated ∼60% more rapidly than corresponding WT cells (Fig. 2 E and F). Importantly, transfection of hCDC14A-YFP into the hCDC14APD cell lines reversed this enhanced migratory phenotype to wild-type levels (Fig. 2 E and F). Finally, we measured directed cell migration using a wound-healing assay. As observed with the other assay systems, hCDC14APD HCT116 cells migrated faster than WT HCT116 cells (Fig. S5 F and G). Taken together, our data show that the phosphatase activity of hCDC14A plays an important role in restraining migration of diverse cell types.
hCDC14APD Cells Display Altered Adhesion Behavior and Form More Invasive Microcolonies.
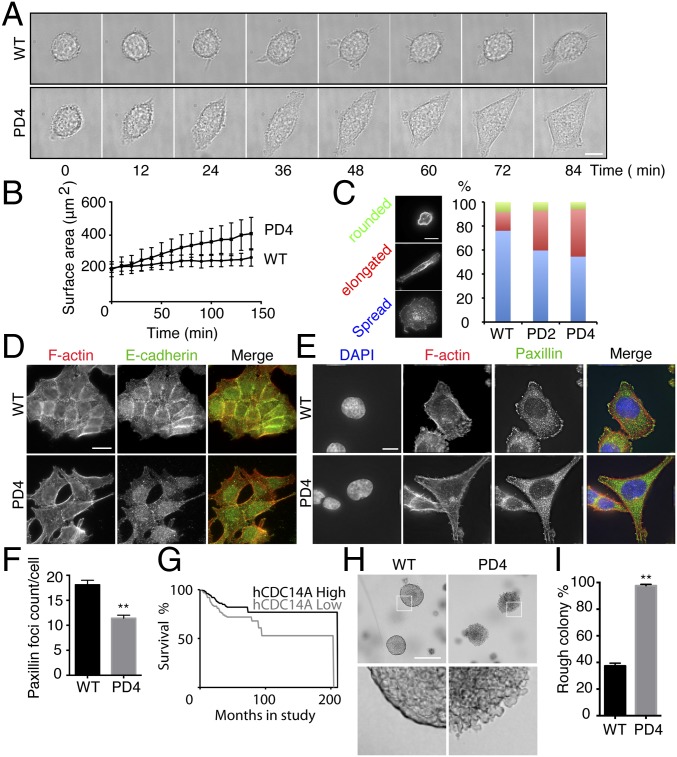
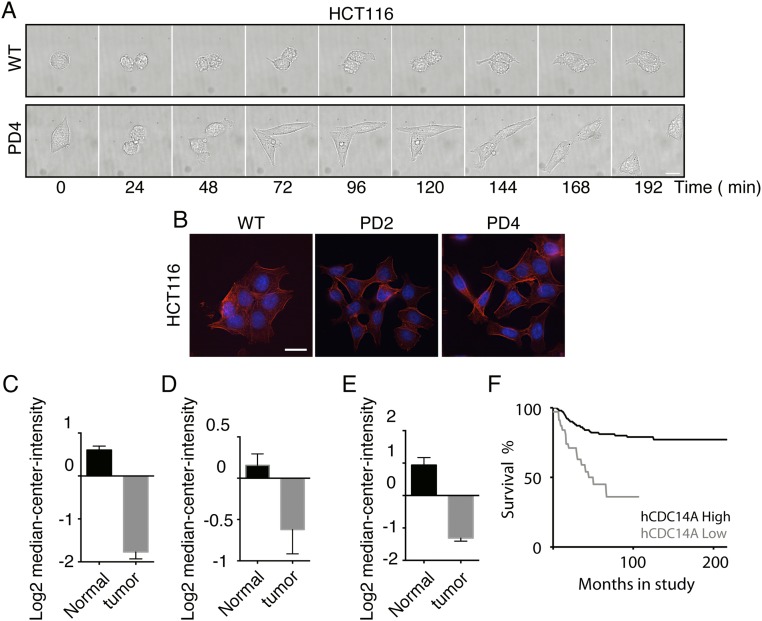
The localization of hCDC14A and the altered migration of hCDC14APD cells indicate that hCDC14A regulates properties of the actin cytoskeleton. To further test this notion, we analyzed cell spreading, cell–cell contact formation, and the formation of focal adhesions in WT and hCDC14APD cells. To analyze cell spreading, HCT116 cells were first trypsinized and then allowed to settle on the fibronectin-coated chamber for 30 min (t = 0). The spreading process was then recorded by light microscopy. After 140 min, all hCDC14APD cells had spread on the chamber surface and achieved an average surface area of 409 μm2. In contrast, HCT116 WT control cells spread more slowly and occupied a much smaller average surface area of 265 μm2 after 140 min (Fig. 3 A and B). A similar acceleration in the cell spreading of hCDC14APD cells was observed when HCT116 cells exited mitosis and reattached to the extracellular matrix (Fig. S6A). After 24 h of seeding onto the surface, ∼30–40% of the hCDC14APD cells had adopted an elongated morphology, whereas only ∼15% of the WT controls had done so (Fig. 3C). Thus, hCDC14APD cells form cell-to-surface adhesion faster and acquire a mature morphology earlier than WT cells.
Fig. 3.
hCDC14APD cells show altered adhesion behavior and form more invasive microcolonies. (A) Time course recording of the HCT116 WT and HCT116 hCDC14APD clone 4 in the spreading assay. (Scale bar: 10 µm.) (B) Quantification of A. n = 10 cells for each cell type. Error bars are ±SEM. (C) Representative views of spread, elongated, and rounded cells stained with phalloidin. (Scale bar: 10 µm.) (Right) Quantification of the cell morphology distribution 24 h after seeding of the indicated cells. (n = WT, 196; PD2, 270; and PD4, 246). (D) E-cadherin is not enriched at cell–cell contact regions of hCDC14APD cells. Indicated cells were seeded onto the fibronectin-coated coverslips for 48 h. Cells were fixed with paraformaldehyde (PFA) and stained with phalloidin (red) and E-cadherin antibodies (green). (Scale bar: 20 µm.) (E) Representative view of fully spread HCT116 WT and HCT116 hCDC14APD cells stained with phalloidin and antipaxillin antibodies. (Scale bar: 10 µm.) (F) Quantification of the paxillin foci count from E. n = 100. Error bars are ±SEM of individual cells. **P < 0.01. (G) Poor prognosis of patients with colon cancer correlated with low level of hCDC14A expression. Kaplan–Meier survival analysis was generated from R2: Genomics Analysis and Visualization Platform (r2.amc.nl). (n = high, 142; low, 136. P = 0.032.) (H) Tumor morphology of HCT116 WT and HCT116 hCDC14APD cells. (Scale bar: 500 µm.) (Lower) Fivefold regional magnification of the Upper panel. (I) Percentage of rough colonies of HCT116 WT and HCT116 hCDC14APD tumors. n = 200. Error bars are ±SEM between three independent experiments. **P < 0.01.
Fig. S6.
Wound healing assay and hCDC14A expression is down-regulated in cancers of different origins. (A) Delay in cell spreading of HCT116 WT cells compared with HCT116 hCDC14APD cells after mitotic exit. (Scale bar: 20 µm.) (B) Representative colony morphology of HCT116 WT and HCT116 hCDC14APD cells. Cells were seeded onto fibronectin-coated coverslips for 48 h, fixed with PFA, and stained with phallodin (red) and DAPI (blue). (Scale bar: 20 µm.) (C–E) mRNA levels of hCDC14A are significantly down-regulated in colorectal tumor, salivary gland carcinoma, and T-cell lymphoma. Error bars are ±SEM between individual samples. Data are adopted from Oncomine database (https://www.oncomine.org/resource/login.html). (F) Poor prognosis of patients with neuroblastoma correlated with low level of hCDC14A mRNA. Kaplan–Meier survival analysis was generated from R2: Genomics Analysis and Visualization Platform (r2.amc.nl) (n = high, 465; low, 33. P < 0.001).
After 48 h, both wild-type and hCDC14APD HCT116 cells formed microcolonies. hCDC14APD microcolonies were less densely packed than the WT control colonies (Fig. S6B). Consistently, the E-cadherin signal of WT cells concentrated at the cell–cell adhesion regions, whereas it was dispersed in hCDC14APD cells even when they were touching (Fig. 3D). We conclude that the lack of hCDC14A activity inhibits the formation of cell–cell contacts.
We next analyzed focal adhesion formation on fibronectin surfaces using the focal adhesion marker paxillin. Fibronectin-attached hCDC14APD cells had fewer focal adhesions than WT cells (Fig. 3 E and F). Because hCDC14A was not detected at focal adhesions (Fig. 1), this defect is most likely to arise as an indirect consequence of the altered actin cytoskeleton of hCDC14APD cells.
hCDC14A mRNA levels are significantly down-regulated in a range of cancers (34–37) (Fig. S6 C–E). When considered alongside the faster cell migration of hCDC14APD cells, this reduction in mRNA levels raises the possibility that hCDC14A may contribute to the aggressive metastatic behavior of tumor cells. Importantly, Kaplan–Meier survival analysis from 278 patients with colon cancer indicated that down-regulation of hCDC14A expression contributes to poor prognosis (Fig. 3G). Similar results were found in neuroblastoma (Fig. S6F). Indeed, in a soft agar colony formation assay, most of the HCT116 WT cells formed compact cell masses with a smooth edge (Fig. 3 H and I). However, the HCT116 hCDC14APD tumors had loose cell–cell contacts with rougher, less clearly defined edges (Fig. 3 H and I). Cancer cells at the periphery were prone to escape from the local mass. The heterogeneous morphology and more aggressive migratory behavior are highly reminiscent of metastatic migration. These data therefore suggest that the lack of hCDC14A increases the tumor aggressiveness by reducing cell adhesion and promoting migration.
hCDC14A Activity Influences Stress Fiber Formation.
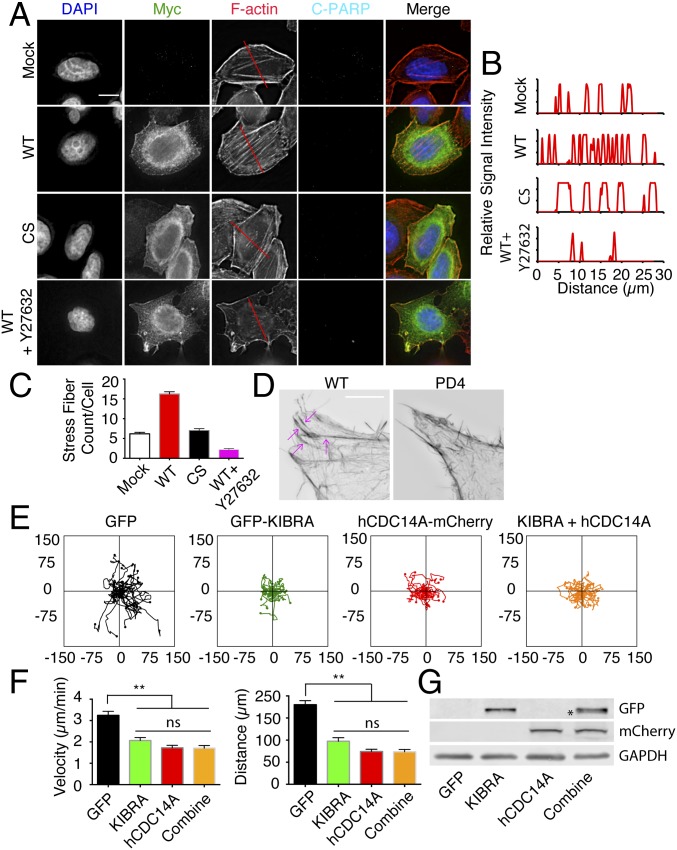
Stress fibers are bundles of ∼20–30 actin filaments that assemble with the help of alpha-actinin. In animal cells, stress fibers are major contractile structures that influence cell movement, the establishment of focal adhesions, and cell–cell attachments (38). Based on the observation that hCDC14A localized to actin fibers and its role in cell migration and adhesion (Figs. 1, 2, and 3), we asked whether hCDC14A affects stress fiber formation. We transfected HeLa cells with active myc-hCDC14A or the phosphatase dead version myc-hCDC14ACS in which the active cysteine at position 278 had been replaced by an alanine residue and stained the cells with phalloidin to visualize the F-actin network. Myc-hCDC14A–transfected cells harbored an average of ∼16 stress fibers, whereas their nontransfected counterparts displayed only ∼6 (Fig. 4 A–C). Importantly, this increase in stress fiber formation was not found when cells had been transfected with the catalytically inactive myc-hCDC14ACS (Fig. 4 A–C), indicating that hCDC14A phosphatase activity was required for this transformation of the actin cytoskeleton. Furthermore, hCDC14A stress fiber induction relied upon rho-associated protein kinase (ROCK) kinase activity as it was blocked by the inhibitor Y27632 (Fig. 4 A–C). hCDC14A expression did not induce apoptosis as indicated by the absence of C-PAPR1 staining (Fig. 4A).
Fig. 4.
hCDC14A levels affect the actin cytoskeleton and hCDC14A and KIBRA function in the same pathway to regulate cell migration. (A) Transient transfection of myc-hCDC14A triggers the formation of F-actin stress fibers. HeLa cells were transfected with the indicated constructs or treated with the ROCK inhibitor Y-27632. Fixed cells were stained with the myc and PARP1 antibodies. F-actin was visualized with phalloidin. DNA was stained with DAPI. The red lines indicate the scanned segments in B. (Scale bar: 20 µm.) (B) Representative results of line-scan profiles from A. The peaks represented the F-actin filaments. (C) Quantification of B. n = 50 per cell type. Error bars are ±SEM of individual cells. (D) The 3D-SIM pictures of the HCT116 WT and HCT116 hCDC14APD clone 4. In the WT cells, F-actin fibers were marked with arrows. (Scale bar: 5 µm.) (E) Plot graphs of cell tracking experiments. HCT116 hCDC14APD clone 4 was transfected with GFP-KIBRA or hCDC14A-mCherry, respectively, or cotransfected with GFP-KIBRA and hCDC14A-mCherry. The transfected cells were seeded onto fibronectin-coated live cell imaging chambers and tracked for 4 h. (F) Quantification of E. Single transfection of GFP-KIBRA or hCDC14A-mCherry had a similar effect on cell migration as cotransfection (combine). This was shown by velocity and accumulated distance. n = 25–30. Error bars are ±SEM of individual cells. **P < 0.01. (G) Immunoblot of the transfected HCT116 hCDC14APD clone 4 cell lysate using GFP and mCherry antibodies. The star shows the slight downshift of GFP-KIBRA in the presence of ectopic hCDC14A-mCherry.
We next compared the F-actin networks of HCT116 WT and hCDC14APD cells. Although 3D structured illumination microscopy (SIM) detected robust and well-organized F-actin fibers in WT cells, it failed to detect any fibers at all in the hCDC14APD cells (Fig. 4D). Thus, hCDC14A activity promotes stress fiber formation.
Overexpression of KIBRA Rescues the Migration and Adhesion Phenotypes of the HCT116 hCDC14APD Cells.
The WW domain protein KIBRA has been described as hCDC14A substrate (39). This upstream regulator of Hippo pathway (40–42) controls the activity of the transcriptional coactivator YAP through its interaction with large-tumor suppressor kinase 1 (LATS1) and LATS2 kinases (42). Alongside these characterized functions in Hippo signaling, recent studies have revealed a role for KIBRA in cell migration and polarization (43–45). Overexpression of KIBRA can inhibit migration of MCF10A cells (44). In contrast, KIBRA knockdown in breast cancer cells induced the epithelial-to-mesenchymal transition (46).
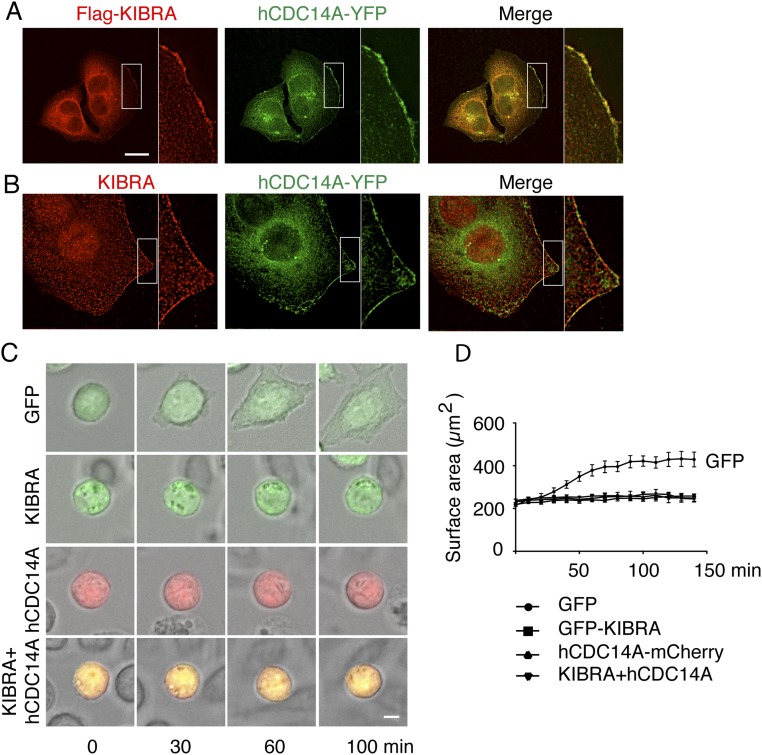
We transfected flag-KIBRA into the hCDC14A-YFP stable HeLa cells and found that flag-KIBRA colocalized with hCDC14A at the leading edge (Fig. S7A). In addition, we found colocalization of endogenous KIBRA with hCDC14A at the leading edge (Fig. S7B). Overexpression of KIBRA could abrogate the enhanced migration (Fig. 4 E and F) and spreading phenotypes (Fig. S7 C and D) arising from the loss of hCDC14A activity in HCT116 hCDC14APD cells, suggesting that hCDC14A may regulate cell mobility and adhesion through KIBRA.
Fig. S7.
KIBRA localizes with hCDC14A at the cell leading edge and its overexpression rescues the adhesion phenotype of hCDC14APD cells. (A) Flag-KIBRA colocalizes with hCDC14A-YFP at the cell leading edge. (Scale bar: 10 µm.) (B) Endogenous KIBRA colocalized with hCDC14A-YFP at the cell leading edge. (Scale bar: 10 µm.) (C) Representative images of transfected HCT116 hCDC14APD cells in the cell spreading assay. Overexpression of GFP-KIBRA, hCDC14A-mCherry alone or in combination inhibited cell spreading. For immunoblots of expression levels see Fig. 4G. (Scale bar: 10 µm.) (D) Quantification of C. Error bars are ±SEM of individual cells. n = 25–30.
To determine whether hCDC14A and KIBRA function in the same pathway, the impact of cotransfection of hCDC14A-mCherry and GFP-KIBRA upon the migration and spreading behavior of hCDC14APD cells was monitored (Fig. 4 E–G and Fig. S7 C and D). A slight downshift in the migration of the KIBRA band on SDS/PAGE was observed in the immunoblot, indicating the dephosphorylation of KIBRA by hCDC14A (39) (Fig. 4G). Single transfection of hCDC14A-mCherry or GFP-KIBRA resulted in a similar reduction of migration and spreading as seen with cotransfection of both constructs (Fig. 4 E and F and Fig. S7 C and D). The nonadditive nature of this behavior suggests that hCDC14A and KIBRA function in the same pathway.
Discussion
Unlike budding yeast CDC14, neither human hCDC14A nor hCDC14B are essential for either cell viability or mitotic exit (22, 28). Rather, hCDC14A has functions outside cell cycle regulation. The combination of localization analyses, overexpression, and hCDC14A knockout approaches used here reveals an important role for hCDC14A in the regulation of cell adhesion and cell migration. We suggest that hCDC14A executes these important functions through the dephosphorylation of F-actin associated proteins. Thus, our work reveals an unanticipated and unidentified function for hCDC14A in modulating properties of actin filaments.
The reduction in the number of stress fibers in hCDC14APD cells and their induction following hCDC14A overexpression indicate that hCDC14A activity stabilizes actin filaments. Stress fibers are important as a major contractile structure for cell morphology, migration, and mechanical signal sensing. Under many conditions, stress fibers restrict cell mobility because their turnover is relatively slow (47). Indeed, many highly motile cells, including invasive cancer cells, lack stress fibers. How hCDC14A regulates the stress fiber dynamics process and how hCDC14A itself is recruited to F-actin filaments remain open questions. One possibility is that hCDC14A dephosphorylates actin modulators such as the guanine nucleotide exchange factors (GEFs) and GTPase-activating proteins (GAPs) that regulate the activity of actin controlling small GTPases. Indeed, components of Rho GTPase pathways such as the nucleotide exchange factor GEF-H1, MyoGEF, RacGAP, and mDia3 are phosphorylated by the mitotic kinases CDK1, Polo kinase 1, and Aurora kinases (48–52). Because hCDC14A is a proline-directed phosphatase (31), it is plausible that it counteracts a proline-directed kinase such as CDK1.
It has been shown that budding yeast Cdc14 plays critical roles in cytokinesis (53), a process that involves rapid actin cytoskeleton rearrangement (54). Yeast cells that lack CDC14 function fail to form an actomyosin ring, whereas it forms prematurely after overexpression of CDC14 (55). Cdc14 regulates F-actin dynamics through dephosphorylation of actin-interacting proteins such as Iqg1 and Aip1 (55, 56). Consistent with these data from yeast, hCDC14A also regulates actin dynamics, however, in interphase. Thus, the actin-remodeling function of CDC14 may be conserved through evolution.
How does hCDC14A regulate actin function? The protein KIBRA is an upstream regulator of Hippo pathway that is critical for the control of contact inhibition and organ size (40). KIBRA was previously reported to be a hCDC14A substrate that also has functions in cell migration (39). We now show that KIBRA colocalizes with hCDC14A at the leading edge and that transient expression of KIBRA bypassed the hCDC14APD cell migration defects. Given that KIBRA is a hCDC14A substrate, these data suggest a function of KIBRA downstream of hCDC14A. Moreover, the nonadditive effect of cotransfection of both genes is most consistent with a function of KIBRA and hCDC14A in one linear pathway. Interestingly, the S. cerevisiae MEN and the metazoa Hippo pathway have a conserved kinase module core structure in common (the Cdc15/Hippo/MST1-Dbf2/LATS1-Mob1 module) (23). Budding yeast Cdc14 feeds back on the MEN by dephosphorylating Cdc15 and Mob1 (53, 57). hCDC14A may regulate the Hippo pathway component KIBRA. Thus, regulation of the MEN and Hippo pathways by CDC14 phosphatases may be a conserved principal.
Down-regulation of hCDC14A expression is associated with poor prognosis in colon cancer and neuroblastoma to reveal an important involvement of hCDC14A in restraining tumor metastasis. Excitingly, the in vitro “tumor formation activity” of HCT116 cells in soft agar assays was enhanced by the hCDC14A inactivating mutation hCDC14APD. We therefore propose that the down-regulation of hCDC14A mRNA seen in many tumors makes a significant contribution to the propagation of cancers by decreasing cell adhesion and enhancing cell migration (34–37).
Materials and Methods
Details are in the SI Materials and Methods including experimental procedures and reagents.
SI Materials and Methods
Cell Culture.
HeLa FRT cells were cultured in DMEM containing 10% (vol/vol) FBS, 100 units/mL penicillin, and 100 mg/mL streptomycin in 5% (vol/vol) CO2 at 37 °C. Stable cell lines were constructed by cotransfection of the plasmids pCDNA5-FRT/TO-Cdc14A-YFP or pCDNA5 FRT/TO-YFP with pOG44 (a Flp recombinase construct) into HeLa FRT cells. Twenty-four hours after transfection, 400 µg/mL hygromycin was added into the medium for 2 wk. Emerging colonies were trypsinized, collected, and expanded. Western blot or live-cell imaging detected the expression of target proteins.
hTERT RPE1 cells were cultured in DMEM-F12 medium containing 10% FBS, 100 units/mL penicillin, and 100 mg/mL streptomycin in 5% CO2 at 37 °C. HCT116 cells were cultured in MycoA medium containing 10% FBS, 100 units/mL penicillin, and 100 mg/mL streptomycin in 5% CO2 at 37 °C. To construct hCDC14A knockout cell lines, 106 cells were transfected with 2.5 µg mRNA of the hCDC14A ZFN targeting (Sigma) and 7 µg of the donor construct. Transfection was carried out in the Neon transfection system (Invitrogen). For RPE1 cells, we used the following conditions: pulse voltage 1,050 V, pulse width 30 ms, and pulse number 2. For HCT116 cells, the pulse voltage was 1,130 V, pulse width 30 ms, and pulse number 2. After electroporation, cells were kept in 5% CO2 at 37 °C for 24 h to recover, followed by 48 h at 30 °C. Cells were then cultured at 37 °C for 3 more days, before trypsinization and seeding into a 96-well plate after single cell dilution. Neomycin (5 μg/mL) was used to selected the positive clones. Two weeks later, the clones were harvested and screened by genomic PCR and RT-PCR. Finally, KO cells were confirmed by Southern blotting.
Primers for Screening.
For junction PCR, the following primers were used: forward TGAATGGGTTACAGATGTGG and reverse GTTGTGCCCAGTCATAGCCG. For RT-PCR, the following primers were used: for primer that bound to exon 8, ATGGTGACTTCAACTGGA; for primer to exon 10, CTTCCAGGAAGTGCTGC. The following primers were used to amplify the probe for the Southern blot: forward CATCGCCGTTCACTGC and reverse ACGTGGGCCTGGAAAG.
Antibodies and Reagents.
Nanobody GFP-Trap against YFP was purchase from Chromotek. In immunofluorescence experiments, GFP nanobodies were used in 1:1,000 dilution. Antibodies for indirect immunofluorescence were anti-flag mouse monoclonal antibody (Cell Signaling 8146, 9A3, 1:1,600), anti-phosphohistone 3 (serine 10) antibodies (Cell Signaling 3377, D2C8, 1:1,600), anti-hCDC14A rabbit polyclonal antibodies (34-8100, Zymed, 1:100), anti-KIBRA rabbit polyclonal antibodies (Cell Signaling 8774, 1:100), anti-Myc mouse monoclonal antibody (Santa Cruz, sc-40, 9E10, 1:100), anti–E-cadherin rabbit monoclonal antibody (Cell Signaling 3195, 1:100), anticleaved PARP1 rabbit monoclonal antibody (Cell Signaling 5625, 1:1,000), and anti-Paxillin rabbit polyclonal antibodies (Y113, ab32084, Abcam, 1:200). Phalloidin for the detection of F-actin was used in 1:500 dilution (Invitrogen A34055). The Rock inhibitor Y-27632 (Sigma Y0503), Blebbstatin (Sigma), and Fibronectin (Santa Cruz, sc-29011) were purchased from the indicated sources.
Immunofluorescence.
Cells on coverslip were fixed with 3% paraformaldehyde (PFA) for 15 min at room temperature, washed with PBS, and then blocked with PBS containing 10% FBS and 0.1% Triton X-100. Samples were incubated with primary antibody diluted in 3% (wt/vol) BSA for 1 h at room temperature, followed by three washes with PBS before incubation with secondary antibodies diluted in 3% BSA for 30 min at room temperature. Finally, cells were mounted with ProLong Gold Antifade Mountant on slides. Images were taken with the Delta Vision Microscopy Imaging System (GE Life Sciences). For 3D-SIM, images were taken on a Nikon Ti inverted microscope with a Nikon Apo TIRF 100× N.A. 1.49 oil immersion objective. Image deconvolution and projections were made with ImageJ.
Flow Cytometry.
The 106 cells were trypsinized and collected for each FACS analysis. Cells were washed twice with PBS, followed by fixation using 70% (vol/vol) ethanol at −20 °C for 3 h before permeabilization with 0.25% Triton X-100 on ice for 15 min. Cells were subsequently treated with 250 μg/mL RNase for 30 min at 37 °C before 25 μg/mL propidium iodide was added to stain the DNA for analysis with a BD FACS Canto II flow cytometer. For phosphohistone 3 serine 10 staining, cells were first incubated with phosphohistone 3 antibody at room temperature for 90 min, then with secondary antibody for 30 min before adding the propidium iodide.
Transwell Assay.
One day before the assay, cells were culture in serum-free medium. The 105 RPE1 or HeLa cells in 100 μL serum-free medium were seeded into the Transwell chamber (Corning, 3422). The bottom chamber was filled with 500 μL medium containing 10% FBS. The whole chamber was incubated in 5% CO2 at 37 °C. After 8 h, the medium in the Transwell chamber was removed and cells on the membrane were fixed with cold methanol for 5 min. Cells attached to the upper side of the membrane were removed by using a cotton swab. Cells remaining on the bottom other side of the membrane were stained with 5% (wt/vol) crystal violet for 10 min at room temperature. To quantify the cell number, five random images were taken at 10× magnification and analyzed using ImageJ. Alternatively, the crystal violet in the stained cells were eluted with 30% (vol/vol) acetic acid. The elution was read at OD570.
Live Cell Imaging and Cell Tracking.
A two-well Labtek chamber (Thermo Scientific, 154461) was coated with fibronectin for 30 min in 37 °C and then washed to remove the remaining fibronectin. The 2 × 10⁵ HCT116 WT or HCT116 hCDC14APD cells suspended in live cell imaging medium (Invitrogen A14291DJ) were seeded into the chamber and allowed to attach for 3 h. Cell movement was recorded at 20× magnification and tracked by using ImageJ software. Tracking results were further analyzed by using the chemotaxis tool plugin. For hCDC14A and KIBRA rescue experiments, HCT116 WT or HCT116 hCDC14APD cells were transfected with 2 µg of hCDC14A-mCherry or KIBRA-GFP constructs using Lipofectamine 2000. After 24 h, cells were trypsinized and collected for live cell imaging. The YFP or GFP signal was used to select the transfected cells.
Wound Healing Assay and Cell Spreading Assay.
Wound healing assays were performed using a culture insertion kit (Ibidi, 80209). The Labtek chamber was coated with fibronectin for 30 min before the culture insert was immobilized onto the chamber surface. HCT116 WT or HCT116 hCDC14APD cells were trypsinized and resuspended in complete medium at a density of 5 × 10⁶ cells/mL. A total of 70 μL of cell suspension was added into each chamber and cells were allowed to attach and grow for 24 h to reach confluency. Then the insert was removed and 2 mL complete live cell imaging medium was added into the chamber. The healing process was recorded at 20× magnification, with a time interval of 10 min between frames and the total recording time was 24 h. The movie was analyzed using ImageJ software.
For observing cell spreading, the Labtek chamber was coated with fibronectin for 30 min. The 2 × 10⁵ HCT116 WT and HCT116 hCDC14APD cells were trypsinized and seeded into the chamber and allowed to settle for 30 min. Cell spreading was recorded at 20× magnification every 10 min for 3 h in live cell imaging medium.
Soft Agar Assay.
The soft agar assay was performed in six-well plates. For each well, 2 mL complete medium containing 0.6% agarose was poured into the well and allowed to set at room temperature to form a bottom layer in the well. The 104 cells were mixed with 2 mL complete medium containing 0.3% agarose. The mixture was poured on top of the bottom layer and allowed to set at room temperature. A total of 1 mL complete medium was added to each well and the medium was changed every 3 d. After 14 d, the colonies were analyzed using a 4× objective lens. Images of the colonies were taken using a Delta Vision microscope.
Southern Blot.
Genomic DNA was isolated using the GenElute Plasmid Miniprep Kit (Sigma). A total of 20 μg DNA was digested with HindIII (NEB) overnight and run for 12 h on 0.8% agarose gel at 30 V. The gel was stained with ethidium bromide to check the digestion. Then the gel was washed with water and denatured using two washed with 0.5 mM NaOH, 1.5 M NaCl. The DNA on the gel was later neutralized with 1.5 M NaCl, 0.5 M Tris⋅HCl and transferred to a GeneScreen Hybridization Membrane (PerkinElmer) in SSC buffer overnight. The membrane was hybridized with a genomic probe synthesized by using the Roche Probe Synthesis Kit overnight, followed by washing. Finally, the membrane was exposed onto a Fujifilm (BAS gauge 2040).
Transfection.
HeLa or HCT116 cells were seeded onto the coverslip in a 12-well plate 1 d before transfection. Cells were transfected at 50% confluence. For each transfection, 0.5 μg plasmid and 1.5 μL Lipofectamine 2000 were used. Six hours after transfection, the medium was refreshed. After 24 h, the cells on the coverslip were fixed with 3% (wt/vol) PFA and followed by indirect immunofluorescence. For hTERT-RPE1 cells, 2.5 μL Lipofectamine LTX and 1.25 μL Plus reagent were used to transfect the cells in a 12-well plate. Six hours after transfection, the medium was refreshed. After 24 h, the cells were fixed with 3% PFA.
In Vitro Phosphatase Assay.
HEK293T cells in 15-cm dishes were transfected with 18 μg construct of hCDC14A-FL-YFP or hCDC14A-Δexon9-YFP using polyethylenimine. Forty-eight hours later, the cells were harvested and the YFP-tagged protein was immunoprecipitated with GFP binder-conjugated Sepharose beads. In the phosphatase assay, the beads were incubated with p-nitrophenyl phosphate substrate in 50 μL phosphatase buffer at 30 °C for 30 min. The phosphatase buffer contains 30 mM imidazole, 1 mM DTT, 1 mM EDTA, 150 mM KCl, 1 mM MgCl and 25 mM K-Hepes. A total of 950 μL 0.25 M NaOH was added to terminate the reaction and the OD value of the solution was measured at 405 nm.
Acknowledgments
We thank Ilaria Lucibello for helpful discussion; Dr. Jixin Dong (University of Nebraska) for KIBRA constructs; and Dr. Ulrike Engel from Nikon Imaging Center (University of Heidelberg) for help with the 3D-SIM imaging. This study is funded by the Deutsche Forschungsgemeinschaft Project DFG Schi 295/3-2.
Footnotes
The authors declare no conflict of interest.
This article is a PNAS Direct Submission.
This article contains supporting information online at www.pnas.org/lookup/suppl/doi:10.1073/pnas.1515605113/-/DCSupplemental.
References
- 1.Ridley AJ, et al. Cell migration: Integrating signals from front to back. Science. 2003;302(5651):1704–1709. doi: 10.1126/science.1092053. [DOI] [PubMed] [Google Scholar]
- 2.Rokavec M, et al. IL-6R/STAT3/miR-34a feedback loop promotes EMT-mediated colorectal cancer invasion and metastasis. J Clin Invest. 2014;124(4):1853–1867. doi: 10.1172/JCI73531. [DOI] [PMC free article] [PubMed] [Google Scholar]
- 3.Whittle MC, et al. RUNX3 controls a metastatic switch in pancreatic ductal adenocarcinoma. Cell. 2015;161(6):1345–1360. doi: 10.1016/j.cell.2015.04.048. [DOI] [PMC free article] [PubMed] [Google Scholar]
- 4.Zhang L, et al. The hippo pathway effector YAP regulates motility, invasion, and castration-resistant growth of prostate cancer cells. Mol Cell Biol. 2015;35(8):1350–1362. doi: 10.1128/MCB.00102-15. [DOI] [PMC free article] [PubMed] [Google Scholar]
- 5.Ridley AJ. Life at the leading edge. Cell. 2011;145(7):1012–1022. doi: 10.1016/j.cell.2011.06.010. [DOI] [PubMed] [Google Scholar]
- 6.Zhao X, Guan JL. Focal adhesion kinase and its signaling pathways in cell migration and angiogenesis. Adv Drug Deliv Rev. 2011;63(8):610–615. doi: 10.1016/j.addr.2010.11.001. [DOI] [PMC free article] [PubMed] [Google Scholar]
- 7.Hartman ZR, Schaller MD, Agazie YM. The tyrosine phosphatase SHP2 regulates focal adhesion kinase to promote EGF-induced lamellipodia persistence and cell migration. Mol Cancer Res. 2013;11(6):651–664. doi: 10.1158/1541-7786.MCR-12-0578. [DOI] [PMC free article] [PubMed] [Google Scholar]
- 8.Mense SM, et al. PTEN inhibits PREX2-catalyzed activation of RAC1 to restrain tumor cell invasion. Sci Signal. 2015;8(370):ra32. doi: 10.1126/scisignal.2005840. [DOI] [PMC free article] [PubMed] [Google Scholar]
- 9.Basu S, Ray NT, Atkinson SJ, Broxmeyer HE. Protein phosphatase 2A plays an important role in stromal cell-derived factor-1/CXC chemokine ligand 12-mediated migration and adhesion of CD34+ cells. J Immunol. 2007;179(5):3075–3085. doi: 10.4049/jimmunol.179.5.3075. [DOI] [PubMed] [Google Scholar]
- 10.Nakada N, Kuroda K, Kawahara E. Protein phosphatase 2A regulatory subunit Bbeta promotes MAP kinase-mediated migration of A431 cells. Cell Physiol Biochem. 2005;15(1-4):19–28. doi: 10.1159/000083635. [DOI] [PubMed] [Google Scholar]
- 11.Xu L, Deng X. Suppression of cancer cell migration and invasion by protein phosphatase 2A through dephosphorylation of mu- and m-calpains. J Biol Chem. 2006;281(46):35567–35575. doi: 10.1074/jbc.M607702200. [DOI] [PubMed] [Google Scholar]
- 12.Malumbres M, Barbacid M. Cell cycle, CDKs and cancer: A changing paradigm. Nat Rev Cancer. 2009;9(3):153–166. doi: 10.1038/nrc2602. [DOI] [PubMed] [Google Scholar]
- 13.Bembenek J, Yu H. Regulation of CDC14: Pathways and checkpoints of mitotic exit. Front Biosci. 2003;8:d1275–d1287. doi: 10.2741/1128. [DOI] [PubMed] [Google Scholar]
- 14.Visintin R, et al. The phosphatase Cdc14 triggers mitotic exit by reversal of Cdk-dependent phosphorylation. Mol Cell. 1998;2(6):709–718. doi: 10.1016/s1097-2765(00)80286-5. [DOI] [PubMed] [Google Scholar]
- 15.Torres-Rosell J, Machín F, Aragón L. Cdc14 and the temporal coordination between mitotic exit and chromosome segregation. Cell Cycle. 2005;4(1):109–112. doi: 10.4161/cc.4.1.1356. [DOI] [PubMed] [Google Scholar]
- 16.Visintin R, Hwang ES, Amon A. Cfi1 prevents premature exit from mitosis by anchoring Cdc14 phosphatase in the nucleolus. Nature. 1999;398(6730):818–823. doi: 10.1038/19775. [DOI] [PubMed] [Google Scholar]
- 17.Shou W, et al. Exit from mitosis is triggered by Tem1-dependent release of the protein phosphatase Cdc14 from nucleolar RENT complex. Cell. 1999;97(2):233–244. doi: 10.1016/s0092-8674(00)80733-3. [DOI] [PubMed] [Google Scholar]
- 18.Cho HP, et al. The dual-specificity phosphatase CDC14B bundles and stabilizes microtubules. Mol Cell Biol. 2005;25(11):4541–4551. doi: 10.1128/MCB.25.11.4541-4551.2005. [DOI] [PMC free article] [PubMed] [Google Scholar]
- 19.Clifford DM, et al. The Clp1/Cdc14 phosphatase contributes to the robustness of cytokinesis by association with anillin-related Mid1. J Cell Biol. 2008;181(1):79–88. doi: 10.1083/jcb.200709060. [DOI] [PMC free article] [PubMed] [Google Scholar]
- 20.Mailand N, et al. Deregulated human Cdc14A phosphatase disrupts centrosome separation and chromosome segregation. Nat Cell Biol. 2002;4(4):317–322. doi: 10.1038/ncb777. [DOI] [PubMed] [Google Scholar]
- 21.Bassermann F, et al. The Cdc14B-Cdh1-Plk1 axis controls the G2 DNA-damage-response checkpoint. Cell. 2008;134(2):256–267. doi: 10.1016/j.cell.2008.05.043. [DOI] [PMC free article] [PubMed] [Google Scholar]
- 22.Mocciaro A, et al. Vertebrate cells genetically deficient for Cdc14A or Cdc14B retain DNA damage checkpoint proficiency but are impaired in DNA repair. J Cell Biol. 2010;189(4):631–639. doi: 10.1083/jcb.200910057. [DOI] [PMC free article] [PubMed] [Google Scholar]
- 23.Mocciaro A, Schiebel E. Cdc14: A highly conserved family of phosphatases with non-conserved functions? J Cell Sci. 2010;123(Pt 17):2867–2876. doi: 10.1242/jcs.074815. [DOI] [PubMed] [Google Scholar]
- 24.Wei Z, et al. Early-onset aging and defective DNA damage response in Cdc14b-deficient mice. Mol Cell Biol. 2011;31(7):1470–1477. doi: 10.1128/MCB.01330-10. [DOI] [PMC free article] [PubMed] [Google Scholar]
- 25.Kaiser BK, Zimmerman ZA, Charbonneau H, Jackson PK. Disruption of centrosome structure, chromosome segregation, and cytokinesis by misexpression of human Cdc14A phosphatase. Mol Biol Cell. 2002;13(7):2289–2300. doi: 10.1091/mbc.01-11-0535. [DOI] [PMC free article] [PubMed] [Google Scholar]
- 26.Ovejero S, Ayala P, Bueno A, Sacristán MP. Human Cdc14A regulates Wee1 stability by counteracting CDK-mediated phosphorylation. Mol Biol Cell. 2012;23(23):4515–4525. doi: 10.1091/mbc.E12-04-0260. [DOI] [PMC free article] [PubMed] [Google Scholar]
- 27.Schindler K, Schultz RM. The CDC14A phosphatase regulates oocyte maturation in mouse. Cell Cycle. 2009;8(7):1090–1098. doi: 10.4161/cc.8.7.8144. [DOI] [PMC free article] [PubMed] [Google Scholar]
- 28.Berdougo E, Nachury MV, Jackson PK, Jallepalli PV. The nucleolar phosphatase Cdc14B is dispensable for chromosome segregation and mitotic exit in human cells. Cell Cycle. 2008;7(9):1184–1190. doi: 10.4161/cc.7.9.5792. [DOI] [PubMed] [Google Scholar]
- 29.Urnov FD, Rebar EJ, Holmes MC, Zhang HS, Gregory PD. Genome editing with engineered zinc finger nucleases. Nat Rev Genet. 2010;11(9):636–646. doi: 10.1038/nrg2842. [DOI] [PubMed] [Google Scholar]
- 30.Stingele S, et al. Global analysis of genome, transcriptome and proteome reveals the response to aneuploidy in human cells. Mol Syst Biol. 2012;8:608. doi: 10.1038/msb.2012.40. [DOI] [PMC free article] [PubMed] [Google Scholar]
- 31.Gray CH, Good VM, Tonks NK, Barford D. The structure of the cell cycle protein Cdc14 reveals a proline-directed protein phosphatase. EMBO J. 2003;22(14):3524–3535. doi: 10.1093/emboj/cdg348. [DOI] [PMC free article] [PubMed] [Google Scholar]
- 32.Wolfe BA, McDonald WH, Yates JR, 3rd, Gould KL. Phospho-regulation of the Cdc14/Clp1 phosphatase delays late mitotic events in S. pombe. Dev Cell. 2006;11(3):423–430. doi: 10.1016/j.devcel.2006.07.016. [DOI] [PubMed] [Google Scholar]
- 33.Sullivan M, Higuchi T, Katis VL, Uhlmann F. Cdc14 phosphatase induces rDNA condensation and resolves cohesin-independent cohesion during budding yeast anaphase. Cell. 2004;117(4):471–482. doi: 10.1016/s0092-8674(04)00415-5. [DOI] [PubMed] [Google Scholar]
- 34.Piccaluga PP, et al. Gene expression analysis of peripheral T cell lymphoma, unspecified, reveals distinct profiles and new potential therapeutic targets. J Clin Invest. 2007;117(3):823–834. doi: 10.1172/JCI26833. [DOI] [PMC free article] [PubMed] [Google Scholar]
- 35.Hong Y, Downey T, Eu KW, Koh PK, Cheah PY. A ‘metastasis-prone’ signature for early-stage mismatch-repair proficient sporadic colorectal cancer patients and its implications for possible therapeutics. Clin Exp Metastasis. 2010;27(2):83–90. doi: 10.1007/s10585-010-9305-4. [DOI] [PubMed] [Google Scholar]
- 36.Frierson HF, Jr, et al. Large scale molecular analysis identifies genes with altered expression in salivary adenoid cystic carcinoma. Am J Pathol. 2002;161(4):1315–1323. doi: 10.1016/S0002-9440(10)64408-2. [DOI] [PMC free article] [PubMed] [Google Scholar]
- 37.Calvisi DF, et al. SKP2 and CKS1 promote degradation of cell cycle regulators and are associated with hepatocellular carcinoma prognosis. Gastroenterology. 2009;137(5):1816–1826.e1–10. doi: 10.1053/j.gastro.2009.08.005. [DOI] [PubMed] [Google Scholar]
- 38.Hotulainen P, Lappalainen P. Stress fibers are generated by two distinct actin assembly mechanisms in motile cells. J Cell Biol. 2006;173(3):383–394. doi: 10.1083/jcb.200511093. [DOI] [PMC free article] [PubMed] [Google Scholar]
- 39.Ji M, et al. Phospho-regulation of KIBRA by CDK1 and CDC14 phosphatase controls cell-cycle progression. Biochem J. 2012;447(1):93–102. doi: 10.1042/BJ20120751. [DOI] [PubMed] [Google Scholar]
- 40.Baumgartner R, Poernbacher I, Buser N, Hafen E, Stocker H. The WW domain protein Kibra acts upstream of Hippo in Drosophila. Dev Cell. 2010;18(2):309–316. doi: 10.1016/j.devcel.2009.12.013. [DOI] [PubMed] [Google Scholar]
- 41.Genevet A, Wehr MC, Brain R, Thompson BJ, Tapon N. Kibra is a regulator of the Salvador/Warts/Hippo signaling network. Dev Cell. 2010;18(2):300–308. doi: 10.1016/j.devcel.2009.12.011. [DOI] [PMC free article] [PubMed] [Google Scholar]
- 42.Xiao L, Chen Y, Ji M, Dong J. KIBRA regulates Hippo signaling activity via interactions with large tumor suppressor kinases. J Biol Chem. 2011;286(10):7788–7796. doi: 10.1074/jbc.M110.173468. [DOI] [PMC free article] [PubMed] [Google Scholar]
- 43.Duning K, et al. KIBRA modulates directional migration of podocytes. J Am Soc Nephrol. 2008;19(10):1891–1903. doi: 10.1681/ASN.2007080916. [DOI] [PMC free article] [PubMed] [Google Scholar]
- 44.Wilson KE, et al. PTPN14 forms a complex with Kibra and LATS1 proteins and negatively regulates the YAP oncogenic function. J Biol Chem. 2014;289(34):23693–23700. doi: 10.1074/jbc.M113.534701. [DOI] [PMC free article] [PubMed] [Google Scholar]
- 45.Yang S, et al. Phosphorylation of KIBRA by the extracellular signal-regulated kinase (ERK)-ribosomal S6 kinase (RSK) cascade modulates cell proliferation and migration. Cell Signal. 2014;26(2):343–351. doi: 10.1016/j.cellsig.2013.11.012. [DOI] [PMC free article] [PubMed] [Google Scholar]
- 46.Moleirinho S, et al. KIBRA exhibits MST-independent functional regulation of the Hippo signaling pathway in mammals. Oncogene. 2013;32(14):1821–1830. doi: 10.1038/onc.2012.196. [DOI] [PubMed] [Google Scholar]
- 47.Tojkander S, Gateva G, Lappalainen P. Actin stress fibers: Assembly, dynamics and biological roles. J Cell Sci. 2012;125(Pt 8):1855–1864. doi: 10.1242/jcs.098087. [DOI] [PubMed] [Google Scholar]
- 48.David M, Petit D, Bertoglio J. Cell cycle regulation of Rho signaling pathways. Cell Cycle. 2012;11(16):3003–3010. doi: 10.4161/cc.21088. [DOI] [PMC free article] [PubMed] [Google Scholar]
- 49.Birkenfeld J, et al. GEF-H1 modulates localized RhoA activation during cytokinesis under the control of mitotic kinases. Dev Cell. 2007;12(5):699–712. doi: 10.1016/j.devcel.2007.03.014. [DOI] [PMC free article] [PubMed] [Google Scholar]
- 50.Asiedu M, Wu D, Matsumura F, Wei Q. Phosphorylation of MyoGEF on Thr-574 by Plk1 promotes MyoGEF localization to the central spindle. J Biol Chem. 2008;283(42):28392–28400. doi: 10.1074/jbc.M801801200. [DOI] [PMC free article] [PubMed] [Google Scholar]
- 51.Touré A, et al. Phosphoregulation of MgcRacGAP in mitosis involves Aurora B and Cdk1 protein kinases and the PP2A phosphatase. FEBS Lett. 2008;582(8):1182–1188. doi: 10.1016/j.febslet.2007.12.036. [DOI] [PubMed] [Google Scholar]
- 52.Cheng L, et al. Aurora B regulates formin mDia3 in achieving metaphase chromosome alignment. Dev Cell. 2011;20(3):342–352. doi: 10.1016/j.devcel.2011.01.008. [DOI] [PMC free article] [PubMed] [Google Scholar]
- 53.König C, Maekawa H, Schiebel E. Mutual regulation of cyclin-dependent kinase and the mitotic exit network. J Cell Biol. 2010;188(3):351–368. doi: 10.1083/jcb.200911128. [DOI] [PMC free article] [PubMed] [Google Scholar]
- 54.Meitinger F, Palani S, Pereira G. The power of MEN in cytokinesis. Cell Cycle. 2012;11(2):219–228. doi: 10.4161/cc.11.2.18857. [DOI] [PubMed] [Google Scholar]
- 55.Miller DP, et al. Dephosphorylation of Iqg1 by Cdc14 regulates cytokinesis in budding yeast. Mol Biol Cell. 2015;26(16):2913–2926. doi: 10.1091/mbc.E14-12-1637. [DOI] [PMC free article] [PubMed] [Google Scholar]
- 56.Kuilman T, et al. Identification of Cdk targets that control cytokinesis. EMBO J. 2015;34(1):81–96. doi: 10.15252/embj.201488958. [DOI] [PMC free article] [PubMed] [Google Scholar]
- 57.Rock JM, Amon A. Cdc15 integrates Tem1 GTPase-mediated spatial signals with Polo kinase-mediated temporal cues to activate mitotic exit. Genes Dev. 2011;25(18):1943–1954. doi: 10.1101/gad.17257711. [DOI] [PMC free article] [PubMed] [Google Scholar]


