Significance
Liver-derived metabolic hormone fibroblast growth factor 21 (FGF21) improves insulin sensitivity and extends lifespan in mice. Aging also compromises the adaptive immune system by reducing T-cell production from the thymus. In this paper, we describe a new immunological function of FGF21 as a regulator of T-cell production from thymus in aging. The overexpression of FGF21 prevents thymic lipoatrophy, which protects the mice from age-induced loss of naïve T cells. FGF21 expression in thymic epithelial cells and signaling in thymic stromal cells support thymic function in aging. Loss of FGF21 in mice increases lethality postirradiation and delays the reconstitution of thymus. Hence, we highlight FGF21 as an immunometabolic regulator that can be harnessed to delay immune senescence.
Keywords: aging, thymus, metabolism, inflammation, FGF21
Abstract
Age-related thymic degeneration is associated with loss of naïve T cells, restriction of peripheral T-cell diversity, and reduced healthspan due to lower immune competence. The mechanistic basis of age-related thymic demise is unclear, but prior evidence suggests that caloric restriction (CR) can slow thymic aging by maintaining thymic epithelial cell integrity and reducing the generation of intrathymic lipid. Here we show that the prolongevity ketogenic hormone fibroblast growth factor 21 (FGF21), a member of the endocrine FGF subfamily, is expressed in thymic stromal cells along with FGF receptors and its obligate coreceptor, βKlotho. We found that FGF21 expression in thymus declines with age and is induced by CR. Genetic gain of FGF21 function in mice protects against age-related thymic involution with an increase in earliest thymocyte progenitors and cortical thymic epithelial cells. Importantly, FGF21 overexpression reduced intrathymic lipid, increased perithymic brown adipose tissue, and elevated thymic T-cell export and naïve T-cell frequencies in old mice. Conversely, loss of FGF21 function in middle-aged mice accelerated thymic aging, increased lethality, and delayed T-cell reconstitution postirradiation and hematopoietic stem cell transplantation (HSCT). Collectively, FGF21 integrates metabolic and immune systems to prevent thymic injury and may aid in the reestablishment of a diverse T-cell repertoire in cancer patients following HSCT.
The degenerative changes in thymus precede age-related loss of function in other organs (1–4). As human lifespan continues to increase, it has been hypothesized that the ability to retain a functional level of thymic lymphopoiesis beyond the time limit set by evolutionary pressures may be an important strategy to extend healthspan (3, 4). Therefore, the ability to enhance thymic lymphopoiesis is thought to be central to the rejuvenation of T-cell–mediated immune surveillance in the elderly (1–7). Aging is associated with marked perturbations in the stromal cell microenvironment of the thymus (8, 9). This includes a reduction in thymopoiesis-supporting thymic epithelial cells (TECs) (10), an increase in fibroblasts (11, 12), and emergence of adipocytes (4, 13) of unknown origin and function. Accordingly, recent efforts have focused on targeting TECs for the rejuvenation of the aging thymus (12, 14). Emerging evidence indicates that immune–metabolic interactions control several aspects of the thymic involution process and age-related inflammation (13). We have shown that byproducts of thymic fatty acids and lipids result in accumulation of “lipotoxic DAMPs” (damage-associated molecular patterns), which triggers innate immune-sensing mechanisms such as inflammasome activation that link aging to thymic demise (15). Immune–metabolic interactions within the aging thymus produce a local proinflammatory state that directly compromises the thymic stromal microenvironment, thymic lymphopoiesis, and serves as a precursor of systemic immune dysregulation in the elderly (5, 8). Despite progress in the field, the thymic growth factors that regulate thymic involution are incompletely understood.
The fibroblast growth factors (FGFs) constitute a family of 22 proteins that regulate diverse biological processes such as growth, development, differentiation, and wound repair (16). Prior studies showed that FGF7/keratinocyte growth factor (KGF) administration in aged mice partially reversed thymic involution (17–19). Notably, unlike most FGFs, FGF21 lacks affinity for heparan sulfate in the extracellular matrix and thus can be secreted to act in an endocrine fashion (20). FGF21 is predominantly secreted from liver but is also expressed in thymus (21). FGF21 is a prolongevity hormone that elicits it biological effects by binding to βKlotho in complex with FGF receptor (FGFR) 1c, 2c, or 3c, but not FGFR4 (16, 22, 23). FGF21 supports host survival during states of energy deficit by increasing ketogenesis and fuel utilization through mitochondrial fatty acid oxidation (16, 23, 24). Interestingly, energy deficit induced by the prolongevity intervention of caloric restriction (CR) reduces ectopic thymic lipid and maintains thymopoiesis in aged mice (13). This raises the question of whether signals that stimulate mobilization of ectopic lipid mediate the salutary effects of CR on immune function. Here we present evidence that FGF21 and βKlotho are coexpressed in TECs and maintain T-cell diversity in models of aging and hematopoietic stem cell transplantation (HSCT) by enhancing thymic function.
Results
FGF21 and βKlotho Are Expressed in Thymic Stromal Cells.
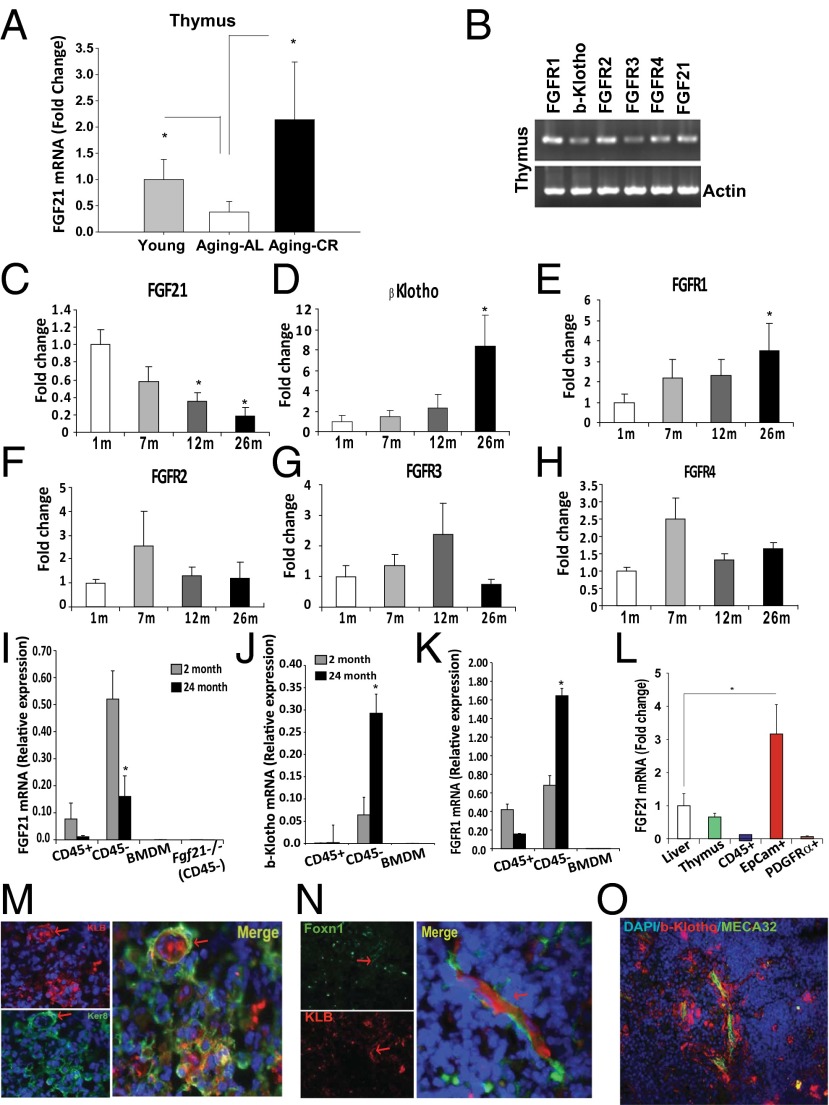
Our initial microarray profiling studies revealed that thymic Fgf21 expression declines with age. To confirm these findings, real-time PCR analysis showed that aging is associated with a reduction in thymic FGF21 mRNA expression, whereas CR significantly protected against loss of Fgf21 expression in thymus (Fig. 1A). Consistent with prior studies (17, 21), Fgf21 and FGF receptors are expressed in thymus along with βKlotho (Klb) (Fig. 1B). Interestingly, although thymic FGF21 is reduced with age (Fig. 1C), Klb and Fgfr1 showed a reciprocal increase in expression (Fig. 1 D and E), whereas no age-dependent regulation of Fgfr2, Fgfr3, or Fgfr4 was found (Fig. 1 F–H). In analyses of hematopoietic and stromal cells from young and old mice, we found that Fgf21, Klb, and Fgfr1 mRNA are predominantly expressed in thymic stromal cells (TSCs) and regulated with aging (Fig. 1 I–K).
Fig. 1.
Regulated expression of FGF21 signaling components during aging. (A) Real-time PCR analysis of Fgf21 mRNA in thymi derived from 2- and 24-mo-old C57B6 mice fed for ad libitum consumption and 24-mo-old C57B6 mice undergoing 40% CR (n = 6–8 per group). (B) Representative gel image showing RT-PCR analysis of Fgfrs, Klb, and Fgf21 mRNA in thymus of 2-mo-old mice. Real-time PCR analysis of (C) Fgf21, (D) Klb, (E) Fgfr1, (F) Fgfr2, (G) Fgfr3, and (H) Fgfr4 in thymi of 1-, 7-, 12-, and 26-mo-old mice fed a normal chow diet for ad libitum consumption. (I–K) The thymi from 2- and 24-mo-old mice were enzymatically dispersed to release thymocytes and TSCs. CD45+ lymphoid cells and CD45− TSCs were isolated using magnetic bead-based cell selection. Real-time PCR analysis of CD45+, CD45−, and bone marrow-derived macrophages (BMDM) revealed that Fgf21, Klb, and Fgfr1 mRNAs are specifically regulated with aging in TSCs and not expressed in hematopoietic cells and macrophages (n = 6 per group). (L) TECs (CD45−EpCAM+) and fibroblasts (CD45−PDGFRα+) were FACS-sorted from 3-mo-old C57B6 mice and Fgf21 mRNA in relation to liver was quantified by real-time PCR. The mRNA expression was normalized to Gapdh and shown as relative expression (ΔΔCt). Data are presented as means ± SEM, *P < 0.05. (M) Immunohistochemical analysis of thymic cryosections immunostained with cTEC marker (keratin8 AlexaFluor 488, green) and KLB (AlexaFluor 594). Arrows show colocalization in thymic nurse cells. (N) βKlotho immunostaining in young FoxN1Cre:mT/mG mice in which FoxN1 lineage cells were indelibly marked with mGFP. (O) Thymic cryosection imaged at the corticomedullary junction showing colocalization of βKlotho in PCVs stained with the endothelial cell marker MECA32.
To further characterize FGF21 expression in thymus, we sorted TECs (CD45−Epcam+) and fibroblasts (CD45−PDGFRα+) from young mice. FGF21 mRNA expression was highest in TECs (Fig. 1L), where it was present at greater than threefold higher levels than in liver, the primary source of circulating FGF21. Immunostaining of thymic cryosections revealed that βKlotho is expressed in a subpopulation of Keratin8+ cortical TECs (Fig. 1M), some of which seem to be thymic nurse cells (25). In complementary studies, we also examined whether βKlotho is expressed in TECs expressing FoxN1, a transcription factor that is critical for thymopoiesis (26). To do this, we used transgenic mice harboring a fluorescent membrane dTomato/membrane EGFP (mT/mG) Cre reporter construct (27) that marks FoxN1 Cre excision by a heritable switch from membrane-targeted tdTomato expression to membrane-targeted EGFP expression. Examination of Foxn1-Cre:mT/mG mice thymi revealed that βKlotho is colocalized with Foxn1+ TECs (Fig. 1N). In addition, βKlotho was expressed in endothelial cells of double-walled postcapillary venules (PCVs) in the corticomedullary junction of the thymus (Fig. 1O). PCVs are critical for import of hematopoietic stem cells into thymus and export of mature CD4 and CD8 cells. These data suggest that FGF21 may regulate thymic function by acting on both TECs and PCVs.
FGF21 Overexpression Prevents Age-Related Thymic Involution.
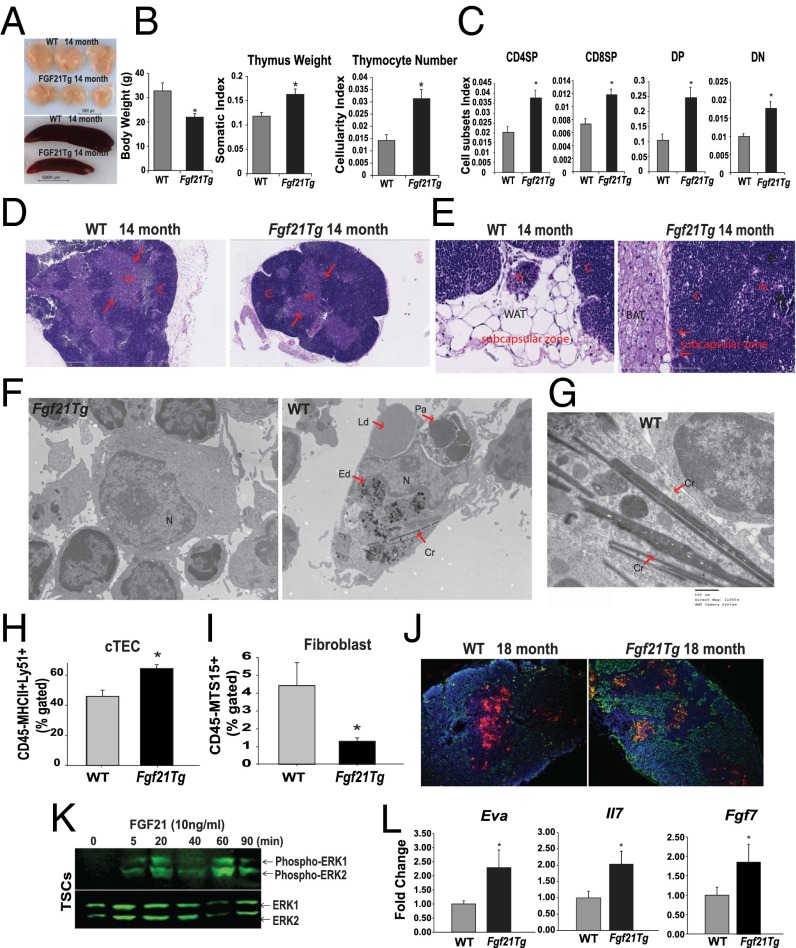
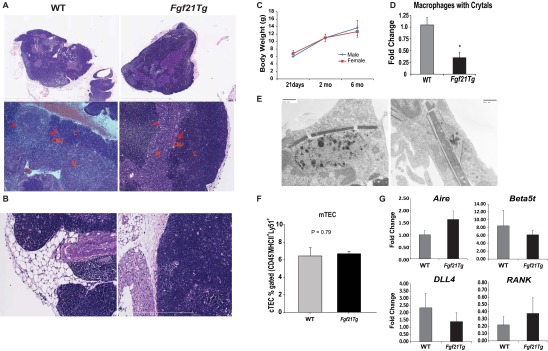
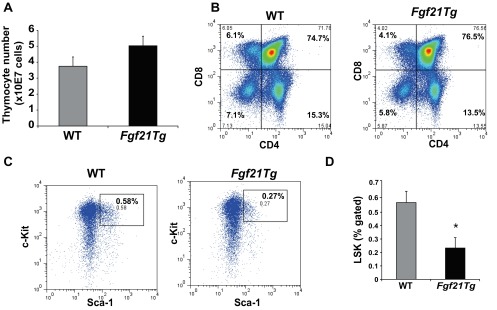
Given that Fgf21 expression in thymus decreases with aging, we next investigated thymic status in a line of Fgf21-transgenic (tg) mice that compared with WT animals show 50–100 times higher circulating FGF21 concentrations (28). Therefore, the Fgf21tg and WT littermates were aged up to 18 mo to examine the impact of FGF21 overexpression on age-related thymic involution. Consistent with an overall reduction in body weight and size (29), the thymi and spleens of middle-aged Fgf21tg mice were significantly smaller than those of WT littermates (Fig. 2 A and B). When normalized for total body weight, the thymic size as well as cellularity of Fgf21tg mice were significantly higher than those of the control littermates (Fig. 2 A and B). The male and female Fgf21Tg mice do not display a difference in body weight (see Fig. S2C). Overexpression of FGF21 did not alter the T-cell development stages (Fig. S1 A and B), but when normalized to body weight, FGF21 gain of function significantly (P < 0.05) increased the total CD4 single-positive (CDSP), CD8 single-positive (CD8SP), CD4+CD8+ double-positive (DP), and CD4−CD8− double-negative (DN) thymocyte subpopulations (Fig. 2C). In addition, compared with WT controls, the middle-aged Fgf21tg mice displayed a significant reduction in Lin−Sca1+Kit+ (LSK) in bone marrow (Fig. S1 C and D). However, the reduction in LSKs in Fgf21tg mice was not associated with thymic involution and could represent increased exit of these progenitors from bone marrow. Hallmark features of thymic aging include loss of corticomedullary junctions and emergence of ectopic adipocytes (1–4). Examination of thymic architecture revealed that in comparison with age-matched WT littermates, 14-mo-old Fgf21tg mice displayed preservation of cortical and medullary cellularity (Fig. 2D and Fig. S2A). Interestingly, overexpression of FGF21 was associated with a reduction in ectopic adipocytes in the subcapsular zone of thymus (Fig. 2E). Furthermore, instead of the typical accumulation of white adipocytes in the perithymic region of middle-aged WT animals, the Fgf21tg mice had an increase in brown adipose tissue adjacent to thymus (Fig. 2 D and E and Fig. S2 A and B). These data agree with the prior finding that FGF21 causes browning of white adipose tissue (30).
Fig. 2.
FGF21 overexpression protects against age-related thymic lipoatrophy. (A) The thymic and spleen size and (B) body weight and thymic weight and cellularity normalized to body weight in 14-mo-old WT and Fgf21tg mice. (C) Cellularity index of thymocyte subsets in 14-mo-old WT and FGF21Tg mice (n = 9 per group). (D) Representative H&E-stained sections from 14-mo-old WT and Fgf21tg mice (n = 4 per group). Loss of cortical regions (c) medullary areas (m) in WT mice is prevented in Ffg21Tg mice. (E) High-magnification (40×) image of thymic sections shows the increase in subcapsular white adipocytes in 14-mo-old WT mice with thymic remnant (Tr) and lipoatrophy. (E) Fourteen-month-old Fgf21tg mice show an increase in perithymic brown adipose tissue (BAT) and lack of ectopic adipocytes in thymic subcapsular zone. WAT, white adipose tissue. (F) Representative electron micrograph of macrophages from thymi of WT and Fgf21tg mice (14 mo old). The macrophages from involuting thymi display phagocytosed lipid droplets (Ld), protein aggregates (Pa), electron dense material in lysosomes (Ed), and crystalline material (Cr) in cytoplasm. N, nucleus. F shows macrophages with surrounding thymocytes in FGF21tg mice. (G) Spiculate crystalline material resembling Charcot–Leyden crystals within thymic macrophages of 14-m-old WT mice. (H and I) The thymi from 12- to 14-mo-old WT and Fgf21tg mice were enzymatically dispersed and cells were labeled with CD45, EpCAM, MHC-II, Ly5.1, and MTS15 to identify cTEC (CD45−EpCAM+MHCII+Ly5.1+) and fibroblast subsets (CD45−EpCAM−MTS15+) (n = 4–6 per group). (J) Thymic cryosection of 18-mo-old WT and Fgf21tg stained with UEA-1 (for mTECs) and Troma1 (for cTECs) (n = 3). (K) CD45− TSCs were isolated from 2-mo-old thymi and treated with FGF21(10 ng/mL) and analyzed at various time points. The representative immunoblot analysis of pERK reveals FGF21 acts directly on TSCs. The experiment was repeated twice with groups of three mice. (L) Real-time PCR analysis of Eva, Il7, and Fgf7 in thymi of 14-mo-old WT and Fgf21tg mice (n = 5). The mRNA expression was normalized to Gapdh and is shown as relative expression (ΔΔCt). Data are presented as means ± SEM, *P < 0.05.
Fig. S2.
Impact of FGF21 overexpression on thymic architecture. (A) Representative image (5× and 20×) of H&E-stained sections of formalin-fixed, paraffin-embedded thymus from 14-mo-old WT and Fgf21tg mice. Corticomedullary junctions (CMJ) are shown by red arrows. (B) Representative image (40×) of H&E-stained sections of formalin-fixed, paraffin-embedded thymus from 14-mo-old WT and Fgf21tg mice. The perithymic adipocytes in WT mice are similar to white adipocytes, whereas Fgf21tg mice show an increase in brown adipose tissue around the perithymic region. (C) Body weight at three different ages in male and female Fgf21 tg mice. (D) The macrophages with crystals were quantified by counting three sections each of WT and Fgf21tg mice (n = 4–5). The overexpression of FGF21 reduces the amount of crystalline material in macrophages. (E) Electron micrographs of macrophages with crystalline material. (F) The quantification of FACS analysis from mTECs (Ly5.1−MHCII+) gated on CD45−EpCAM+ cells in thymi of 12- to 14-mo-old WT and Fgf21tg mice. (G) Real-time PCR analysis of Aire, Beta5t, DLL, and RANK in thymi of 14-mo-old WT and Fgf21tg mice (n = 5). The mRNA expression was normalized to Gapdh and is shown as relative expression (ΔΔCt). Data are presented as means ± SEM, *P < 0.05.
Fig. S1.
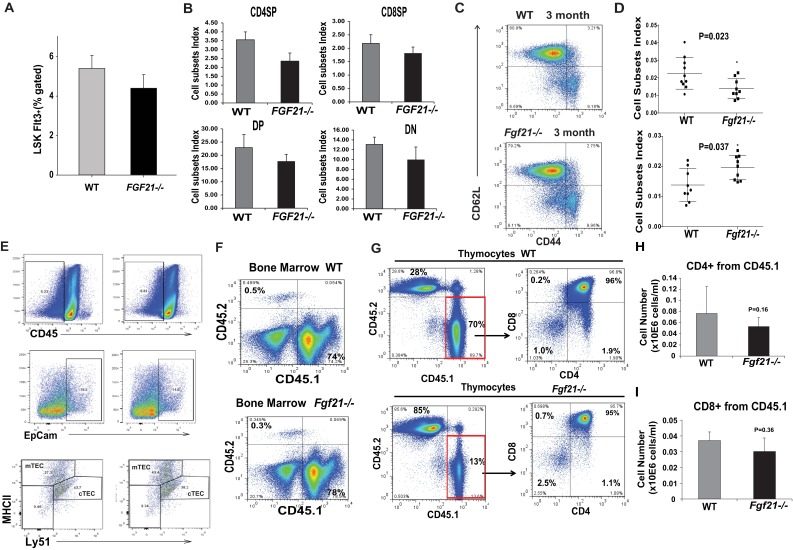
Impact of FGF21 overexpression on primary lymphoid organs. (A) Total thymocyte number from 14-mo-old WT and Fgf21tg mice (n = 6). (B) The representative FACS dot plots of thymocytes stained with CD4 and CD8 in 14-mo-old WT and Fgf21tg mice. (C and D) The bone marrow cells were stained with Sca1 and c-Kit and gated on lineage markers to identify hematopoietic stem cells (HSC) that are LSK. Compared with 14-mo-old WT mice, the frequency of LSKs is significantly reduced in Fgf21tg mice (n = 6).
The channelling of ectopic lipid into nonoxidative pathways can lead to the generation of ceramides, which causes NLRP3 inflammasome-dependent thymic macrophage activation and inflammation (3, 15). Interestingly, electron microscopy analysis revealed that macrophages in the aging WT thymi contained spiculate crystalline material reminiscent of Charcot–Leyden crystals (Fig. 2 F and G) (31, 32), phagocytosed lipid droplets, and large protein aggregates, suggesting defective autophagy. There were also enlarged lysosomes with electrodense material (Fig. 2F and Fig. S2 D and E), which are associated with NLRP3 inflammasome activation and thymic involution (15). Although βKlotho is not expressed in macrophages (Fig. 1J), consistent with reduced thymic damage, thymi from Fgf21tg mice had significantly reduced macrophages with large crystals (Fig. S2D). These data suggest that enhanced FGF21 signaling in TSCs reduces the overall burden of DAMP clearance by macrophages, which may indirectly participate in lowering age-related thymic inflammation.
Stromal cells in thymus, including cortical (c) and medullary (m)TECs, are essential for T-cell development (10–12, 25). Aging is associated with reduced proliferation and survival of TECs (8, 9, 11). We found an increase in the number of cTECs (Fig. 2H) without any change in mTECs in Fgf21tg mice (Fig. S2F). Although mTECs predominate in thymus, the relative increase in the cTEC:mTEC ratio in middle-aged mice is consistent with prior studies (11). Aging is also associated with changes in the composition of TSCs, with a typical increase in thymic fibroblasts (8, 9, 11). The overexpression of FGF21 prevented the age-related increase in thymic fibroblasts (Fig. 2I) and maintained the cTEC architecture (Fig. 2J). To determine the mechanism of FGF21’s effects on thymic function, we evaluated whether FGF21 can act on thymic stroma. Consistent with our finding that βKlotho and FGFRs are expressed in TSCs, FGF21 treatment induced the phosphorylation of ERK (Fig. 2K), suggesting that FGF21 acts directly on TSCs. Furthermore, the preservation of cTEC function was reflected by increased expression of TEC-specific genes, early V antigen (Eva), and growth factors such as Il7 and Fgf7 (Fig. 2L). No significant changes in the expression of Aire, Beta5t, Dll4, or Rank were observed between the thymi of 14-mo-old WT and Fgf21tg mice (Fig. S2G). Together, these data suggest that FGF21 maintains the thymic microenvironment during aging by lowering thymic lipotoxicity and promoting TEC function.
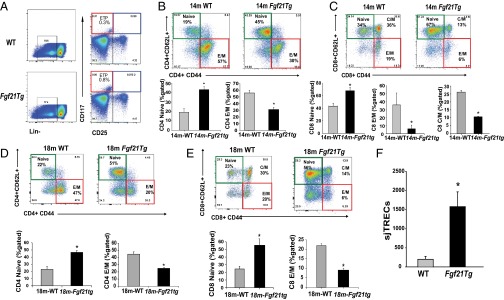
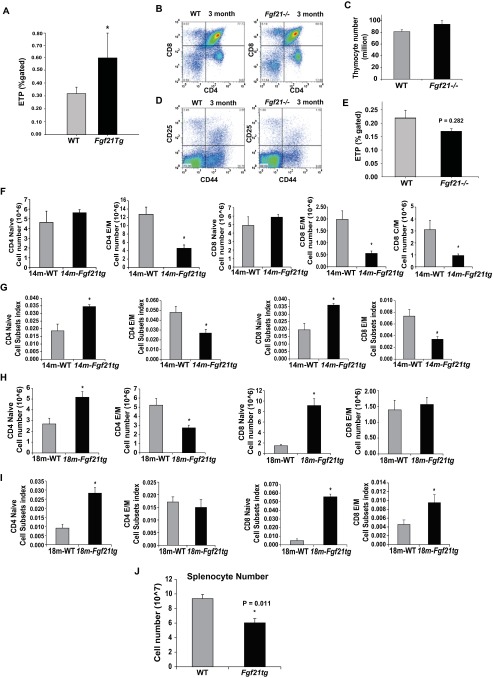
T-cell development is dependent on lympho-stromal interactions that control progression of the earliest thymocyte progenitors (ETPs) into mature T cells (5–7). Age-related thymic involution is also linked to reduction in frequency of ETPs (6). Interestingly, overexpression of FGF21 significantly increased the frequency of ETPs (Fig. 3A and Fig. S3A). Given that decline in T-cell diversity is one of the major mechanisms that contributes to immune senescence and reduced immune surveillance in aging (33, 34), we next investigated the impact of FGF21 on peripheral T-cell diversity in middle-aged mice. Interestingly, compared with 14-mo-old WT mice, age-matched Fgf21tg mice had a significant increase in frequency of CD4 and CD8 naïve (CD62L+CD44lo) cells and a reduction in age-induced expansion of effector memory (E/M) cells (CD62L−CD44hi) (Fig. 3 B and C and Fig. S3 F and G). Furthermore, examination of an additional cohort of 18-mo-old Fgf21tg mice confirmed that FGF21 overexpression protects against age-related loss of naïve and E/M T-cell expansion (Fig. 3 D and E and Fig. S3 H and I). Given that spleen size and total splenocyte counts are lower (Fig. S3J) and proportional to lower body weight in Fgf21tg mice, the total naïve and E/M T-cell counts were normalized to body weight to represent the impact of FGF21 on T-cell diversity (Fig. S3 G and I). Together, data from two cohorts (14 and 18 mo) aged independently in two separate mouse facilities (University of Texas Southwestern Medical Center and Yale School of Medicine) demonstrate robust protective effects of FGF21 on T-cell senescence that are not influenced by husbandry conditions that may influence microbiota.
Fig. 3.
FGF21 overexpression prevents age-related restriction of T-cell diversity. (A) Thymocytes from 12- to 14-mo-old WT and Fgf21tg mice (n = 4–6 per group) were stained to identify ETPs (LinloCD117+CD25−). (B and C) The splenocytes were stained with CD4, CD8, CD62L, and CD44 to identify naïve (CD4/CD8−CD62L+CD44lo) and E/M (CD4/CD8−CD62L−CD44hi) T cells. The FACS analysis in14-mo-old WT and Fgf21tg mice show a significant increase in naive CD4/CD8 and a reduction in E/M CD4/CD8 cells. (n = 6 per group). (D and E) The representative FACS dot plot of splenic naïve and E/M T-cell subpopulations in 18-mo-old WT and Fgf21tg mice (n = 4–6). Frequency of naïve CD4/CD8 and E/M CD4/CD8 cells in 18-mo-old WT and FGF21tg mice shows a significant increase naïve CD4/CD8 cells and reduction in E/M CD4/CD8 cells (n = 6 per group). (F) Real-time PCR analysis of sjTREC levels in DNA from splenic T cells in 14-mo-old WT and Fgf21tg mice (n = 6). Data are presented as means ± SEM, *P < 0.05.
Fig. S3.
Role of FGF21 on thymic development and peripheral T-cell repertoire. (A) The thymocytes from 12- to 14-mo-old WT and Fgf21tg mice (n = 4–6 per group) were stained to identify ETPs (LinloCD117+CD25). There is a significant increase (P < 0.05) in percent gated ETPs. (B) Representative FACS dot plots of thymocytes stained with CD4 and CD8 in 3-mo-old WT and Fgf21−/− mice. (C) Total thymocyte number from 4-mo-old WT and Fgf21−/− mice (n = 6–8). (D) The thymocytes were stained with CD4, CD8 CD44, and CD25 and gated on CD4- and CD8-negative cells to identify thymocyte subsets. Ablation of Fgf21 does not affect T-cell development stages in thymus. (E) The frequency of Lin−CD117+CD25− ETPs in WT and FGF21 null mice at 4 mo of age. (F and G) The cell subsets index and absolute number (in millions of cells) of naïve (CD62L+ CD44− and E/M (CD62L−CD44hi) CD4 and CD8 cells in 14-mo-old WT and Fgf21tg mice (n = 6 per group). (H and I) The calculation of cell subsets and absolute number (in millions of cells) of naïve (CD62L+ CD44− and E/M (CD62L−CD44hi) CD4 and CD8 cells in 18-mo-old WT and Fgf21tg mice (n = 4–6 per group). (J) The splenocyte number in 18-mo-old WT and FGF21 tg mice (n = 4–6).
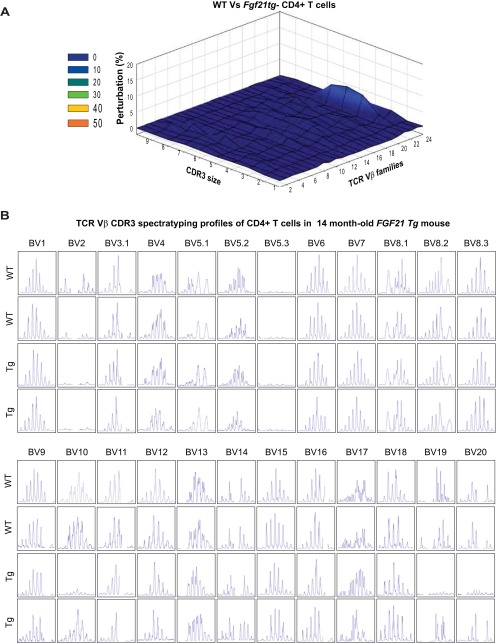
It is known that preexisting naïve T cells in the periphery can also undergo proliferation to compensate for age-related reduction in thymic T-cell export (35, 36). Importantly, Klb is not expressed in T cells, suggesting that FGF21 does not act directly on peripheral T cells. To further evaluate thymic function, we also quantified signal-joint T-cell receptor (TCR) excision circles (sjTRECs) as a surrogate marker for recent thymic emigrants (37, 38). Consistent with an increase in naïve T-cell frequency in middle-aged Fgf21tg mice, the sjTREC content in splenic T cells was also significantly higher than in control WT littermates (Fig. 3F), suggesting increased thymopoiesis. TCR diversity is conferred by VJ and VDJ recombinations in complementarity determining region 3 (CDR3) of newly generated T cells in thymus (33, 39). Hence, each Vβ–Jβ combination is represented as a Gaussian distribution of 6–10 CDR3 lengths with consecutive addition of 3 bp representing in-frame rearrangement (40). The CDR3 polymorphism analysis through TCR spectratyping revealed that 14-mo-old Fgf21tg mice do not display significant perturbations of TCR repertoire (Fig. S4A). Given that these mice are middle-aged, no perturbations in other Vβ subtypes were observed (Fig. S4B). Taken together, these data show that FGF21 prevents age-related deterioration of peripheral T-cell diversity indirectly by increasing thymic T-cell production.
Fig. S4.
Impact of FGF21 overexpression on TCR repertoire. (A) The CD4 cells were sorted from spleen from WT and Fgf21 tg mice (14 mo old) to prepare cDNA that was used for TCR spectratyping. The CDR3 polymorphism analysis revealed that 14-mo-old Fgf21 tg mice do not displayed significant perturbation of TCR diversity. The 3D graph depicts perturbation in CD4 T cells. Each line crossing on the y axis of the landscape denotes change from splenic CD4 cells-specific CDR3 length or size (x axis) of a particular Vβ family (z axis). The perturbation in TCR diversity is shown as landscape surfaces, in which smooth (blue) landscapes show an unchanged TCR diversity. (B) The CD4 cells were sorted from spleen from WT and FGF21 tg mice (14 mo old) to prepare cDNA that was used for TCR spectratyping. TCR diversity of peripheral CD4 T cells was analyzed by measuring the distribution of lengths of the CDR3 of TCR. Representative TCR Vβ profile in aged WT mouse and polyclonal Gaussian distribution of CDR3 lengths in Fgf21tg mice. The data were generated using an ABI 3100 sequencer and analyzed using GeneMapper.
Loss of FGF21 Compromises Thymic Reconstitution.
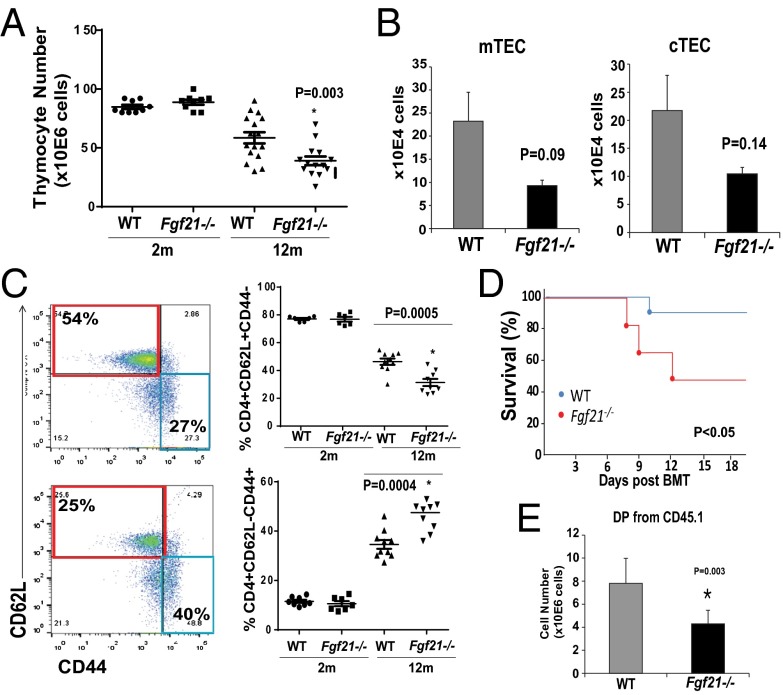
We next investigated whether loss of FGF21 function affects thymic aging. The global FGF21-deficient mice do not display any changes in total thymic cellularity or T-cell development and ETPs at 2–3 mo of age (Fig. 4A and Figs. S3 B–E and S5 A and B) in young Fgf21−/− mice, suggesting that FGF21 is not required for thymic development. Interestingly, by 1 y age of age, ablation of FGF21 was manifested in greater loss of total thymic cellularity (Fig. 4A). Compared with 12-mo-old littermate controls, Fgf21−/− mice displayed a trend toward reduction in cTECs and mTECs that did not reach statistical significance (Fig. 4B and Fig. S5E). The middle-aged Fgf21−/− animals displayed significantly higher loss of naïve T cells and greater frequencies and numbers of E/M cells compared with age-matched littermate control animals (Fig. 4C and Fig. S5D). No changes in CD4 naïve and E/M subsets were observed in young Fgf21−/− mice (Fig. S5C). These data suggest that FGF21 deficiency with age accelerates thymic involution and loss of naïve T cells.
Fig. 4.
Elimination of FGF21 accelerates thymic aging and impedes thymic reconstitution following irradiation and HSCT. (A) Total thymic cellularity in 2- and 12-mo-old WT and Fgf21−/− mice (n = 10–16). (B) The absolute number from FACS analysis of cTECs (Ly5.1+MHCII+) and mTECs (Ly5.1−MHCII+) gated on CD45−EpCAM+ cells in thymi of 12-mo-old WT and Fgf21−/− mice. (C) FACS analysis of splenic naïve and E/M T-cell subpopulations in 2- and 12-mo-old WT and Fgf21tg mice. (D) The Kaplan–Meier survival curves of WT and Fgf21−/− mice (2 mo old, n = 9 per genotype, P < 0.05) following lethal irradiation and HSCT. (E) The total number of donor DP CD4+D8+ thymocytes in 2-mo-old WT and FGF21 null mice 2 wk following HSCT (n = 6–9). The data are expressed as the mean (SEM), *P < 0.05.
Fig. S5.
Impact of FGF21 ablation on immune cell homeostasis. (A) The bone marrow cells were stained with Sca1 and c-Kit and gated on lineage markers to identify HSC that are LSK. Compared with 3-mo-old WT mice, the frequency of LSKs was not affected in Fgf21−/− mice (n = 6). (B) The cell subsets index of thymocyte number from CD4SP, CD8SP, CD4+CD8+DP, and DN in 12-mo-old WT and Fgf21−/− mice (n = 6). (C) The representative FACS dot plots from splenocytes stained with CD4, CD62L, and CD44 in 3-mo-old WT and Fgf21−/− mice (n = 6). Ablation of FGF21 does not affect the frequency of naïve (CD62L+CD44−) or E/M cells (CD62L−CD44hi). (D) The cell subsets index of CD4 (CD62L+CD44−) naïve and E/M (CD62L−CD44hi) cells in 12-mo-old WT and Fgf21−/− mice (n = 6). (E) The FACS analysis of cTECs (Ly5.1+MHCII+) and mTECs (Ly5.1−MHCII+) gated on CD45−EpCAM+ cells in thymi of 12-mo-old WT and Fgf21−/− mice (n = 6). (F) The bone marrow cells from WT and Fgf21−/− mice were stained with CD45.1 (donor) and CD45.2 (recipients) to investigate the percent chimerism following lethal irradiation and HSCT. Ablation of FGF21 does not affect bone marrow chimerism. (G–I) The thymocytes from 2-mo-old WT and Fgf21−/− mice were stained with CD45.1 (for donor cells), CD45.2 (for host cells), CD4, and CD8. The total thymocyte subset numbers gated on donor and host cells from young WT and Fgf21−/− mice are shown (n = 9 per group).
Age-related thymic degeneration is a significant impediment in cancer patients undergoing HSCT because the conditioning regimens damage already reduced stromal cell niches in recipient thymi (41–44). In elderly patients, the impaired T-cell reconstitution due to thymic damage after HSCT results in prolonged posttransplant T-cell deficiency and significant mortality and morbidity (43). We found that compared with WT mice there was increased mortality in Fgf21−/− mice that underwent lethal irradiation and HSCT (Fig. 4D). This was not due to reduced chimerism in bone marrow (Fig. S5F). Consistent with an important role for FGF21 in thymic function, we found that compared with WT mice the ablation of FGF21 significantly reduced thymic reconstitution (Fig. 4E and Fig. S5G). Lack of FGF21 in the host stromal compartment was associated with a significant reduction in donor DPs without changes in the CD4SP and CD8SPs (Fig. 4E and Fig. S5 H and I). These data suggest that loss of FGF21-mediated immune–metabolic interactions impairs thymic reconstitution following HSCT.
Discussion
Thymic involution likely occurs as a consequence of both intrinsic defects in thymocyte progenitors and a failure to maintain a functional TEC compartment (5–7, 41). Aging reduces the number of TECs with a concomitant increase in lipid-laden cells, fibroblasts, and adipocytes (8, 9, 11). Among the FGF family, FGF7/KGF promotes thymic lymphopoiesis by acting on TECs (18, 19, 45). Unlike FGF7, FGF21 lacks the conventional FGF heparin-binding domain and hence can diffuse away from its cellular source of production to act in a paracrine or endocrine manner (20). FGF21 requires βKlotho for its action and is known to increase energy expenditure and exert antidiabetic and prolongevity effects (16, 22). Consistent with prior studies (29) and similar to CR mice (13), overexpression of FGF21 increases brown adipose tissue in the perithymic region and reduces ectopic lipid within the thymic space, suggesting a reduction in thymic lipotoxicity. Our data demonstrate a previously unidentified function of FGF21 as a prothymic molecule that is highly expressed in TECs and may diffuse in thymus to signal via discrete subpopulations of βKlotho-expressing Ker8+ cTECs, FoxN1+ TECs, and PCVs.
In addition, given that FGF21 increases lipid utilization, including enhanced adipose tissue browning, it is likely that FGF21 reduces overall lipid-derived DAMPs in aging thymus. Crystals are seldom formed spontaneously in mammalian tissues. Crystal-storing histiocytosis is a rare disease associated with the accumulation of crystalline material in macrophages and excessive inflammation (31). Surprisingly, in thymi of aged mice, spiculate crystal-containing macrophages were located in thymic medulla. The crystalline material is reminiscent of Ym1-like Charcot–Leyden crystals, which are linked to higher IL-1β secretion and exuberant innate immune response (31, 32). Importantly, the FGF21 coreceptor βKlotho is not expressed in macrophages (Fig. 1J), suggesting that the reduction in ectopic lipid and crystals in macrophages from Fgf21tg mice is secondary to an overall reduction in thymic involution rather than a direct effect on macrophage NLRP3. Understanding precisely how aging and FGF21 overexpression regulates the generation of crystalline material in thymic macrophages will require additional studies.
Prior studies showed that overexpression of FGF21 in mice increases serum adiponectin levels, improves insulin sensitivity, and extends lifespan by ∼40% (16). Given that aging of thymus precedes the development of systemic metabolic abnormalities, our data suggest that FGF21 acts directly on thymus. We have previously published that Fgf21tg mice eat the same or more than WT mice (16, 24). Thus, the effects on thymic biology observed in Fgf21tg mice are not due to caloric restriction. Despite FGF21’s robust effects on longevity and metabolism, Fgf21−/− mice do not display overt changes in metabolism or lifespan, suggesting alternate compensatory mechanisms.
With regard to thymic biology, the FGF21 gain and loss of function studies revealed that FGF21 plays a role on maintaining thymic microenvironment during aging, when the thymus undergoes lipoatrophy. In addition, the increased lethality of FGF21-deficient mice during the conditioning regimen of radiation suggests that FGF21 is required for immune–metabolic interactions that maintain homeostasis and protect against tissue damage. Loss of FGF21 was accordingly associated with reduced T-cell reconstitution in a clinical model of HSCT. However, global deletion of Fgf21 in a knockout mouse model may not mimic the much more discrete and gradual loss of thymic Fgf21 expression over time in aging. Thus, future studies using TEC specific and inducible down-regulation of FGF21 signaling may provide definitive insights on role of this pathway in thymic aging and reconstitution.
FGF21 is currently being pursued for the treatment of obesity and type 2 diabetes (46); our findings suggest that FGF21 also exerts positive immunoregulatory effects. Taken together, our data demonstrate that FGF21 links metabolic and immune systems and regulates peripheral T-cell homeostasis by preventing age-related thymic degeneration.
Materials and Methods
Mice and Animal Care.
The C57BL/6-Tg(Apoe-Fgf21)1Sakl/J mice C57BL/6J Fgf21−/− and control littermates on C57BL6 background were obtained from University of Texas Southwestern Medical Center. Mice were housed in a pathogen-free facility with a 12-h light/12-h dark cycle with free access to food and water. All mice were fed a standard chow diet consisting of 4.5% fat (5002; LabDiet). The WT and 40% caloric-restricted mice were obtained from the National Institute on Aging Rodent Colony.
The lethal irradiation to ablate hematopoietic cells was performed using an X-Rad300, X-ray small animal irradiator. One week before irradiation, the recipient mice were be given acidified, antibiotic water. The lineage-depleted bone marrow cells from CD45.1+ (B6.SJLPtprca Pep3b/BoyJ) were transplanted to irradiated (750 cGy) syngeneic WT, Fgf21tg, and Fgf21−/− mice via tail vein injection. The mice were killed 2 wk after the HSCT for analysis of T-cell reconstitution. All experiments were in compliance with ref. 47 and were approved by the Institutional Animal Care and Use Committee at Pennington Biomedical Research Center and Yale University.
Flow Cytometry.
To identify ETPs, thymocytes were labeled for lineage-positive cell by using PE-conjugated anti-CD11b, Gr-1, CD45R, CD3, CD8, αβTCR, γδTCR, pan-NK, NK1.1, CD11c, CD19, Ter119, and CD127 antibodies but no CD4 (eBioscience), followed by staining with APC-conjugated anti-CD25 and FITC-conjugated anti–c-kit (eBioscience). The PE-labeled lineage-negative cells lacking CD25 and expressing c-kit were designated as ETPs, as previously described. For lymphocytes analysis after bone marrow transplantation, thymocytes are stained for CD4, CD8, CD45.1, and CD45.2 cells followed by staining with FITC-, PE-, PerCP-, and APC-conjugated antibodies (eBioscience). To identify naïve and effecter or memory T cells, splenocytes were incubated with PerCP-conjugated anti-CD4, APC-conjugated anti-CD8, PE-conjugated anti-CD62L, and FITC-conjugated anti-CD44 antibodies. Anti-MTS15 antibody for fibroblast analyses was a generous gift from Richard Boyd, Monash University, Melbourne. All of the FACS data were analyzed by postcollection compensation using FlowJo (Tree Star, Inc.) software.
Western Blot Analysis.
We conducted the immunoblot analysis for phosphor-ERK1, 2 in CD45- and TSCs as described previously (48). The protein immune complexes were detected using specific fluorescent secondary antibodies conjugated with IRDye 800CW (Rockland) and membranes were imaged using an Odyssey infrared imaging system (LI-COR).
Immunohistochemistry and Electron Microscopy.
The thymi were collected from mice and fixed in 4% (vol/vol) buffered paraformaldehyde and embedded in paraffin and optimal cutting temperature compound then cut into 5- to 7-μm-thick sections. Tissue sections were stained with H&E, UEA1/Troma1, KLB/keratin 8, and KLB/MECA32. The images were acquired using Axiovert 40 microscope and Leica SP5 confocal microscope. The animals were perfused with paraformaldehyde fixative and ultrathin thymus sections were cut on a Leica ultramicrotome into 70-nm-thick sections, collected on Formvar-coated single-slot grids, analyzed with Tecnai 12 Biotwin EM (FEI), and evaluated and photographed in a JEM 1010 electron microscope (JEOL) equipped with a Multiscan 792 digital camera (Gatan).
Real-Time RT-PCR.
The total RNA from thymus tissue in different age time point was extracted using RNeasy Lipid Tissue Mini Kit (Qiagen). Total RNA was digested by DNase (Invitrogen). The cDNA synthesis and real-time RT-PCR was performed as described previously (Bio-Rad). Quantitative real-time RT-PCR analyses were done in duplicate on the ABI PRISM 7900 Sequence Detector TaqMan system with the SYBR Green PCR kit as instructed by the manufacturer (Applied Biosystems). GAPDH was used for normalization human and mouse genes accordingly. Primers were designed using NCBI Primer software based on GenBank sequence data. Primer sequences are listed in Table S1. sjTREC real-time PCR and TCR spectratyping details are provided in SI Materials and Methods.
Table S1.
Primers and sequences used in the study
| Primers | Forward 5′ to 3′ | Reverse 5′ to 3′ |
| Real-time PCR primers | ||
| FGF21 | CTGGGGGTCTACCAAGCATA | CACCCAGGATTTGAATGACC |
| FGFR1 | CCAGTGCATCCATGAACTCTGGGGTTCTCC | GGTCACACGGTTGGGTTTGTCCTTATCCAG |
| FGFR2 | TGCCACAGAGAAGGACCTGTCTGATCTGGT | TGCCACAGAGAAGGACCTGTCTGATCTGGT |
| FGFR3 | GCGACAGGTGTCCTTGGAATCTAACTCCTC | CCAATAGCTTCTGCCATGACCACCTGTCCA |
| FGFR4 | GACCAAACCAGCACCGTGGCTGTGAAGATG | GTTTCCCTTGGCGGCACATTCCACAATCAC |
| βKlotho | CTGGCTAAGGTTCAAGTACGGAGACCTCCC | GGAGCTGAGCGATCACTAAGTGAATACGCA |
| EVA | GGCTGGCTTTCCCTGATGTAT | TTAACCGAACATCTGTCCCGT |
| IL7 | GGGAGTGATTATGGGTGGTGAG | TGCGGGAGGTGGGTGTAG |
| FGF7 (KGF) | TTGACAAACGAGGCAAAGTG | CCCTTTGATTGCCACAATTC |
| RT-PCR primers | ||
| FGF21 | TTCTTTGCCAACAGCCAGAT | GTCCTCCAGCAGCAGTTCTC |
| FGFr4 | ACGGGGAGAATCGTATTGG | TCCGAGGGTACCACACTTTC |
| FGFr1 | GAGCGACTTCCATAGCCAGA | CATGGATGCACTGGAGTCAG |
| FGFr2 | CTGTGCACAAGCTGACCAAG | GAGTTCATGGAGGAGCTGGA |
| FGFr3 | GAGCTACTTCCGAGCCTCCT | ACTGAAGTGGCACAGCACAC |
| βKlotho | TCCCCTGTGATTTCTCTTGG | GGGGAGGAGACCGTAAACTC |
SI Materials and Methods
Quantification of sjTRECs.
CD4+ T subsets were isolated from splenocytes using mouse CD4+ T cells positive section kit (Invitrogen). The sorted cells were lysed in 100 mg/L proteinase K (Sigma) for 1 h at 56 °C followed by 10 min at 95 °C. The amount of TRECs in 5 × 10⁶ cells was determined by real-time quantitative PCR using the ABI PRISM 7900 Sequence Detector TaqMan system as described previously (15, 38) (Applied Biosystems). The PCR was performed with mδRec and ψJα specific primers and mδRec-ψJα fluorescent probe as described previously (38). The standard curves for murine TRECs were generated by using δRec ψJα TREC PCR product cloned into a pCR-XL-TOPO plasmid that was generously provided by Gregory Sempowski, Duke University School of Medicine, Durham, NC.
Vβ TCR Spectratyping Analysis.
The analysis of hypervariable CDR3 of β chain offers a practical approach for the global 26 qualitative assessment of diversity of TCR repertoire. For TCR spectratyping and CDR3 length analysis PCR, a FAM-labeled nested constant β-region primer is used in combination with 24 multiplexed forward murine Vβ-specific primers. PCR was performed for 35 cycles with denaturation at 94 °C for 30 s, annealing for 55 °C for 30 s, and 1 min extension at 72 °C and the PCR products were analyzed on an ABI3130 genetic analyzer as described previously (13, 15). Each Vβ–Jβ rearrangement is visualized by six to eight peaks and each peak represents one or a set of T-cell clones bearing the same CDR3 length. Each peak was analyzed and quantified with ABI PRISM GeneScan analysis software (Applied Biosystems), based on size and density. Data were used to calculate the area under the curve for each Vβ family. Each peak, representing a distinct CDR3 of a certain length, was quantified with statistical software (BioMed Immunotech).
Statistical Analyses.
A two-tailed Student’s t test was used to test for differences between genotypes or treatments (*P < 0.05 and P < 0.01). The results are expressed as the mean ± SEM. The differences between means and the effects of treatments were determined by one-way ANOVA using Tukey’s test (Sigma Stat), which protects the significance (P < 0.05) of all pair combinations.
Acknowledgments
We thank Kim Nguyen, Angie Bookout, and Yuan Zhang for assistance with animal experiments; Klara Szigeti-Buck for electron microscopy analyses of thymus; and Emily L. Goldberg for reading the manuscript. This work is supported in part by NIH Grants AG043608, AI105097, and DK090556 (to V.D.D.) and R01DK067158 (to S.A.K. and D.J.M.) and Robert A. Welch Foundation Grants I-1558 (to S.A.K.) and I-1275 (to D.J.M.). D.J.M. was supported by the Howard Hughes Medical Institute.
Footnotes
The authors declare no conflict of interest.
This article is a PNAS Direct Submission.
This article contains supporting information online at www.pnas.org/lookup/suppl/doi:10.1073/pnas.1514511113/-/DCSupplemental.
References
- 1.Lynch HE, et al. Thymic involution and immune reconstitution. Trends Immunol. 2009;30(7):366–373. doi: 10.1016/j.it.2009.04.003. [DOI] [PMC free article] [PubMed] [Google Scholar]
- 2.Dorshkind K, Montecino-Rodriguez E, Signer RA. The ageing immune system: Is it ever too old to become young again? Nat Rev Immunol. 2009;9(1):57–62. doi: 10.1038/nri2471. [DOI] [PubMed] [Google Scholar]
- 3.Dixit VD. Impact of immune-metabolic interactions on age-related thymic demise and T cell senescence. Semin Immunol. 2012;24(5):321–330. doi: 10.1016/j.smim.2012.04.002. [DOI] [PubMed] [Google Scholar]
- 4.Heng TS, Chidgey AP, Boyd RL. Getting back at nature: Understanding thymic development and overcoming its atrophy. Curr Opin Pharmacol. 2010;10(4):425–433. doi: 10.1016/j.coph.2010.04.006. [DOI] [PubMed] [Google Scholar]
- 5.van Ewijk W. T-cell differentiation is influenced by thymic microenvironments. Annu Rev Immunol. 1991;9:591–615. doi: 10.1146/annurev.iy.09.040191.003111. [DOI] [PubMed] [Google Scholar]
- 6.Min H, Montecino-Rodriguez E, Dorshkind K. Reduction in the developmental potential of intrathymic T cell progenitors with age. J Immunol. 2004;173(1):245–250. doi: 10.4049/jimmunol.173.1.245. [DOI] [PubMed] [Google Scholar]
- 7.Shah DK, Zúñiga-Pflücker JC. An overview of the intrathymic intricacies of T cell development. J Immunol. 2014;192(9):4017–4023. doi: 10.4049/jimmunol.1302259. [DOI] [PubMed] [Google Scholar]
- 8.Youm YH, et al. Deficient ghrelin receptor-mediated signaling compromises thymic stromal cell microenvironment by accelerating thymic adiposity. J Biol Chem. 2009;284(11):7068–7077. doi: 10.1074/jbc.M808302200. [DOI] [PMC free article] [PubMed] [Google Scholar]
- 9.Manley NR, Richie ER, Blackburn CC, Condie BG, Sage J. Structure and function of the thymic microenvironment. Front Biosci (Landmark Ed) 2011;16:2461–2477. doi: 10.2741/3866. [DOI] [PubMed] [Google Scholar]
- 10.Anderson MS, et al. Projection of an immunological self shadow within the thymus by the aire protein. Science. 2002;298(5597):1395–1401. doi: 10.1126/science.1075958. [DOI] [PubMed] [Google Scholar]
- 11.Gray DH, et al. Developmental kinetics, turnover, and stimulatory capacity of thymic epithelial cells. Blood. 2006;108(12):3777–3785. doi: 10.1182/blood-2006-02-004531. [DOI] [PubMed] [Google Scholar]
- 12.Rode I, Boehm T. Regenerative capacity of adult cortical thymic epithelial cells. Proc Natl Acad Sci USA. 2012;109(9):3463–3468. doi: 10.1073/pnas.1118823109. [DOI] [PMC free article] [PubMed] [Google Scholar]
- 13.Yang H, Youm YH, Dixit VD. Inhibition of thymic adipogenesis by caloric restriction is coupled with reduction in age-related thymic involution. J Immunol. 2009;183(5):3040–3052. doi: 10.4049/jimmunol.0900562. [DOI] [PMC free article] [PubMed] [Google Scholar]
- 14.Bredenkamp N, Nowell CS, Blackburn CC. Regeneration of the aged thymus by a single transcription factor. Development. 2014;141(8):1627–1637. doi: 10.1242/dev.103614. [DOI] [PMC free article] [PubMed] [Google Scholar]
- 15.Youm YH, et al. The Nlrp3 inflammasome promotes age-related thymic demise and immunosenescence. Cell Reports. 2012;1(1):56–68. doi: 10.1016/j.celrep.2011.11.005. [DOI] [PMC free article] [PubMed] [Google Scholar]
- 16.Zhang Y, et al. The starvation hormone, fibroblast growth factor-21, extends lifespan in mice. eLife. 2012;1:e00065. doi: 10.7554/eLife.00065. [DOI] [PMC free article] [PubMed] [Google Scholar]
- 17.Erickson M, et al. Regulation of thymic epithelium by keratinocyte growth factor. Blood. 2002;100(9):3269–3278. doi: 10.1182/blood-2002-04-1036. [DOI] [PubMed] [Google Scholar]
- 18.Rossi SW, et al. Keratinocyte growth factor (KGF) enhances postnatal T-cell development via enhancements in proliferation and function of thymic epithelial cells. Blood. 2007;109(9):3803–3811. doi: 10.1182/blood-2006-10-049767. [DOI] [PMC free article] [PubMed] [Google Scholar]
- 19.Alpdogan O, et al. Keratinocyte growth factor (KGF) is required for postnatal thymic regeneration. Blood. 2006;107(6):2453–2460. doi: 10.1182/blood-2005-07-2831. [DOI] [PMC free article] [PubMed] [Google Scholar]
- 20.Kurosu H, et al. Tissue-specific expression of betaKlotho and fibroblast growth factor (FGF) receptor isoforms determines metabolic activity of FGF19 and FGF21. J Biol Chem. 2007;282(37):26687–26695. doi: 10.1074/jbc.M704165200. [DOI] [PMC free article] [PubMed] [Google Scholar]
- 21.Nishimura T, Nakatake Y, Konishi M, Itoh N. Identification of a novel FGF, FGF-21, preferentially expressed in the liver. Biochim Biophys Acta. 2000;1492(1):203–206. doi: 10.1016/s0167-4781(00)00067-1. [DOI] [PubMed] [Google Scholar]
- 22.Kharitonenkov A, et al. FGF-21 as a novel metabolic regulator. J Clin Invest. 2005;115(6):1627–1635. doi: 10.1172/JCI23606. [DOI] [PMC free article] [PubMed] [Google Scholar]
- 23.Badman MK, et al. Hepatic fibroblast growth factor 21 is regulated by PPARalpha and is a key mediator of hepatic lipid metabolism in ketotic states. Cell Metab. 2007;5(6):426–437. doi: 10.1016/j.cmet.2007.05.002. [DOI] [PubMed] [Google Scholar]
- 24.Inagaki T, et al. Endocrine regulation of the fasting response by PPARalpha-mediated induction of fibroblast growth factor 21. Cell Metab. 2007;5(6):415–425. doi: 10.1016/j.cmet.2007.05.003. [DOI] [PubMed] [Google Scholar]
- 25.Takada K, Ohigashi I, Kasai M, Nakase H, Takahama Y. Development and function of cortical thymic epithelial cells. Curr Top Microbiol Immunol. 2014;373:1–17. doi: 10.1007/82_2013_322. [DOI] [PubMed] [Google Scholar]
- 26.Chen L, Xiao S, Manley NR. Foxn1 is required to maintain the postnatal thymic microenvironment in a dosage-sensitive manner. Blood. 2009;113(3):567–574. doi: 10.1182/blood-2008-05-156265. [DOI] [PMC free article] [PubMed] [Google Scholar]
- 27.Jeffery E, et al. Characterization of Cre recombinase models for the study of adipose tissue. Adipocyte. 2014;3(3):206–211. doi: 10.4161/adip.29674. [DOI] [PMC free article] [PubMed] [Google Scholar]
- 28.Bookout AL, et al. FGF21 regulates metabolism and circadian behavior by acting on the nervous system. Nat Med. 2013;19(9):1147–1152. doi: 10.1038/nm.3249. [DOI] [PMC free article] [PubMed] [Google Scholar]
- 29.Inagaki T, et al. Inhibition of growth hormone signaling by the fasting-induced hormone FGF21. Cell Metab. 2008;8(1):77–83. doi: 10.1016/j.cmet.2008.05.006. [DOI] [PMC free article] [PubMed] [Google Scholar]
- 30.Fisher FM, et al. FGF21 regulates PGC-1α and browning of white adipose tissues in adaptive thermogenesis. Genes Dev. 2012;26(3):271–281. doi: 10.1101/gad.177857.111. [DOI] [PMC free article] [PubMed] [Google Scholar]
- 31.Guo L, Johnson RS, Schuh JC. Biochemical characterization of endogenously formed eosinophilic crystals in the lungs of mice. J Biol Chem. 2000;275(11):8032–8037. doi: 10.1074/jbc.275.11.8032. [DOI] [PubMed] [Google Scholar]
- 32.Rydman EM, et al. A single aspiration of rod-like carbon nanaotubes induces asbestos-like pulmonary inflammation mediated in part by the IL-1R. Toxicol Sci. 2015;147(1):140–155. doi: 10.1093/toxsci/kfv112. [DOI] [PubMed] [Google Scholar]
- 33.Nikolich-Zugich J. Ageing and life-long maintenance of T-cell subsets in the face of latent persistent infections. Nat Rev Immunol. 2008;8(7):512–522. doi: 10.1038/nri2318. [DOI] [PMC free article] [PubMed] [Google Scholar]
- 34.Goronzy JJ, Weyand CM. Understanding immunosenescence to improve responses to vaccines. Nat Immunol. 2013;14(5):428–436. doi: 10.1038/ni.2588. [DOI] [PMC free article] [PubMed] [Google Scholar]
- 35.Swain S, Clise-Dwyer K, Haynes L. Homeostasis and the age-associated defect of CD4 T cells. Semin Immunol. 2005;17(5):370–377. doi: 10.1016/j.smim.2005.05.007. [DOI] [PMC free article] [PubMed] [Google Scholar]
- 36.Sprent J, Cho JH, Boyman O, Surh CD. T cell homeostasis. Immunol Cell Biol. 2008;86(4):312–319. doi: 10.1038/icb.2008.12. [DOI] [PubMed] [Google Scholar]
- 37.Douek DC, et al. Changes in thymic function with age and during the treatment of HIV infection. Nature. 1998;396(6712):690–695. doi: 10.1038/25374. [DOI] [PubMed] [Google Scholar]
- 38.Sempowski GD, Gooding ME, Liao HX, Le PT, Haynes BF. T cell receptor excision circle assessment of thymopoiesis in aging mice. Mol Immunol. 2002;38(11):841–848. doi: 10.1016/s0161-5890(01)00122-5. [DOI] [PubMed] [Google Scholar]
- 39.Naylor K, et al. The influence of age on T cell generation and TCR diversity. J Immunol. 2005;174(11):7446–7452. doi: 10.4049/jimmunol.174.11.7446. [DOI] [PubMed] [Google Scholar]
- 40.Nikolich-Zugich J, Slifka MK, Messaoudi I. The many important facets of T-cell repertoire diversity. Nat Rev Immunol. 2004;4(2):123–132. doi: 10.1038/nri1292. [DOI] [PubMed] [Google Scholar]
- 41.Mackall CL, Gress RE. Thymic aging and T-cell regeneration. Immunol Rev. 1997;160:91–102. doi: 10.1111/j.1600-065x.1997.tb01030.x. [DOI] [PubMed] [Google Scholar]
- 42.Holland AM, van den Brink MR. Rejuvenation of the aging T cell compartment. Curr Opin Immunol. 2009;21(4):454–459. doi: 10.1016/j.coi.2009.06.002. [DOI] [PMC free article] [PubMed] [Google Scholar]
- 43.Holländer GA, Krenger W, Blazar BR. Emerging strategies to boost thymic function. Curr Opin Pharmacol. 2010;10(4):443–453. doi: 10.1016/j.coph.2010.04.008. [DOI] [PMC free article] [PubMed] [Google Scholar]
- 44.Griffith AV, et al. Spatial mapping of thymic stromal microenvironments reveals unique features influencing T lymphoid differentiation. Immunity. 2009;31(6):999–1009. doi: 10.1016/j.immuni.2009.09.024. [DOI] [PMC free article] [PubMed] [Google Scholar]
- 45.Min D, et al. Protection from thymic epithelial cell injury by keratinocyte growth factor: A new approach to improve thymic and peripheral T-cell reconstitution after bone marrow transplantation. Blood. 2002;99(12):4592–4600. doi: 10.1182/blood.v99.12.4592. [DOI] [PubMed] [Google Scholar]
- 46.Reitman ML. FGF21 mimetic shows therapeutic promise. Cell Metab. 2013;18(3):307–309. doi: 10.1016/j.cmet.2013.08.014. [DOI] [PMC free article] [PubMed] [Google Scholar]
- 47.National Research Council . Guide for the Care and Use of Laboratory Animals. 8th Ed National Academies; Washington, DC: 2011. [Google Scholar]
- 48.Vandanmagsar B, et al. The NLRP3 inflammasome instigates obesity-induced inflammation and insulin resistance. Nat Med. 2011;17(2):179–188. doi: 10.1038/nm.2279. [DOI] [PMC free article] [PubMed] [Google Scholar]


