Significance
This work, for the first time to our knowledge, distinctly visualizes the two different populations of dendritic cells (DCs) essential for cytotoxic T-cell generation in the skin-draining lymph nodes (SDLNs): the migratory CD103hi DCs that immigrate from other organs including the skin and the CD8αhi DCs that are resident in the SDLNs. By imaging the spatiotemporal dynamics of the migratory and resident subsets of DCs in the SDLNs, we find that these two different populations play different roles in antigen presentation, with the migratory DCs being dramatically more potent in interacting with CD8+ T cells. This work offers critical insights into several areas, including optimizing vaccines for microbes and tumors.
Keywords: dendritic cell, CD8+ T cell, cross-presentation, intravital two-photon imaging, photoconversion
Abstract
Dendritic cells (DCs) are antigen-presenting cells specialized for activating T cells to elicit effector T-cell functions. Cross-presenting DCs are a DC subset capable of presenting antigens to CD8+ T cells and play critical roles in cytotoxic T-cell–mediated immune responses to microorganisms and cancer. Although their importance is known, the spatiotemporal dynamics of cross-presenting DCs in vivo are incompletely understood. Here, we study the T-cell zone in skin-draining lymph nodes (SDLNs) and find it is compartmentalized into regions for CD8+ T-cell activation by cross-presenting DCs that express the chemokine (C motif) receptor 1 gene, Xcr1 and for CD4+ T-cell activation by CD11b+ DCs. Xcr1-expressing DCs in the SDLNs are composed of two different populations: migratory (CD103hi) DCs, which immigrate from the skin, and resident (CD8αhi) DCs, which develop in the nodes. To characterize the dynamic interactions of these distinct DC populations with CD8+ T cells during their activation in vivo, we developed a photoconvertible reporter mouse strain, which permits us to distinctively visualize the migratory and resident subsets of Xcr1-expressing DCs. After leaving the skin, migratory DCs infiltrated to the deep T-cell zone of the SDLNs over 3 d, which corresponded to their half-life in the SDLNs. Intravital two-photon imaging showed that after soluble antigen immunization, the newly arriving migratory DCs more efficiently form sustained conjugates with antigen-specific CD8+ T cells than other Xcr1-expressing DCs in the SDLNs. These results offer in vivo evidence for differential contributions of migratory and resident cross-presenting DCs to CD8+ T-cell activation.
Dendritic cells (DCs) play critical roles in shaping T-cell responses as they present antigenic peptides and provide the requisite costimulatory signals for T-cell activation (1). In primary immune responses, naive T cells receive these antigen and costimulatory signals by physically interacting with DCs in secondary lymphoid tissues such as lymph nodes (LNs). Recent advances in intravital imaging techniques using two-photon excitation fluorescent microscopy reveal the dynamic DC and T-cell behaviors during T-cell activation. When naive T cells encounter DCs presenting sufficient amounts of antigenic peptides, they reduce their motility and attach to the DCs for prolonged periods of time, ranging from 10 min to hours (2–4). A limitation of previous imaging studies was the inability to visually distinguish endogenous DC subpopulations that are distinct from one another in phenotype and function (5–7). This has clouded the ability of the studies to define the relative contributions of the different DC subsets in T-cell activation.
Cytotoxic T cells, which play critical roles in the defense against microorganisms and cancer, are generated from CD8+ T cells through interactions with relatively small populations of DCs. In LNs, it is the CD8α+CD103+ class of DCs that is capable of cross-presenting exogenous antigen-derived peptides on major histocompatibility complex (MHC) class I, making them important for CD8+ T-cell responses. Other DC subsets, including CD11b+ DCs, are mainly involved in CD4+ T-cell responses (5, 8, 9). Among CD8α+CD103+ DCs, CD8αhiCD103int DCs are a LN-resident population (hereafter called LN-resident DCs or CD8αhi DCs) whereas CD8αintCD103hi DCs are a migratory subset derived from peripheral tissues (hereafter called migratory DCs or CD103hi DCs). The migratory DCs constantly immigrate from the skin to the skin-draining LNs (SDLNs). Upon activation by innate stimuli, e.g., double-stranded RNAs, the skin migratory DCs increase their rate of immigration to the SDLNs (10). The first compelling evidence for the differential distribution of distinct DC populations in LNs was reported a decade ago (11). Until recently, however, the distribution of CD8αhi DCs and CD103hi DCs could not be studied because of the difficulty in histologically identifying these cells in LNs. Computational processing of multicolor histological images suggested that these cross-presenting DC subsets were preferentially accumulated in deep areas of the T-cell zone in the SDLNs (12). Other studies directly visualized both DC subsets by histological analyses of chemokine (C motif) receptor 1 (XCR1) expression, which is selectively and highly expressed in both LN-resident DCs and migratory DCs (13–16). These studies have demonstrated the differential localization of cross-presenting DCs and other types of DCs in the SDLNs.
Despite the above advances, there remain many open questions concerning the interactions of DCs and T cells. For example, it is not known whether the activation of CD8+ T cells and CD4+ T cells in the SDLNs is spatially coordinated according to the differential localization of cross-presenting DCs and other DCs. Moreover, little is known about the dynamics of migratory DCs in the SDLNs. In addition, it is difficult to compare the contributions of LN-resident DCs and migratory DCs to CD8+ T-cell activation in the SDLNs. Only somewhat indirect assays have been used; for example, an ex vivo assay using DCs sorted from the SDLNs has been used to study the events of herpes simplex virus type 1 (HSV-1) infection (17). For soluble protein vaccination, the DC subsets that most contribute to CD8+ T-cell activation in the SDLNs remain unknown. Soluble protein antigens administered s.c. are delivered to the SDLNs not only by skin DCs but also via lymph flow in lymphatic sinuses and LN conduits, permitting DCs in the SDLNs to sample them (18, 19). Mechanical disruption of LNs for the ex vivo assay may artificially expose irrelevant DC subsets to soluble protein antigens. Thus, it is important to establish the in vivo assay system to evaluate the differential roles for the migratory and LN-resident DC subsets in CD8+ T-cell activation.
In this study, we have used direct imaging approaches to determine the locations for activation of CD8+ T cells and CD4+ T cells in the SDLNs. Using newly generated reporter mice expressing a photochromic fluorescent protein in DCs that express the XCR1 gene (Xcr1), we have developed a method to distinctively visualize the LN-resident DCs and migratory DCs in the SDLNs. Intravital microscopy has been used to analyze cognate interactions of the DC subsets with CD8+ T cells after immunization with soluble antigen. Our results provide insights into the DC inter- and intratissue migration dynamics, which are associated with in vivo contributions of different DC subsets to CD8+ T-cell activation.
Results
Regionalization of Xcr1-Expressing DCs in the SDLNs.
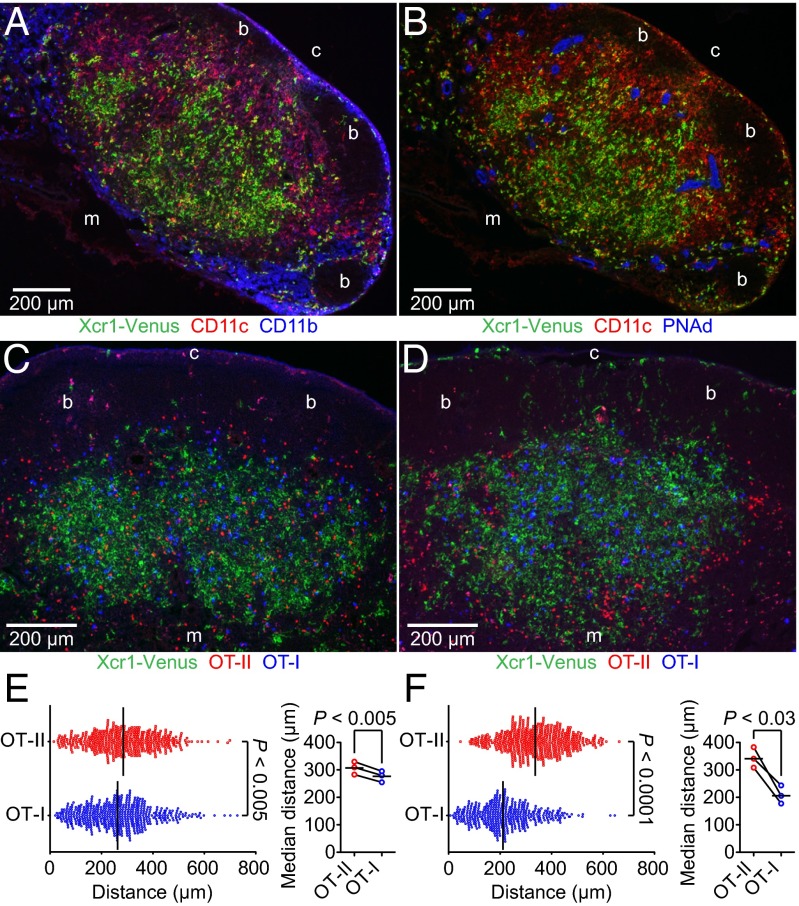
We histologically analyzed the localization of cross-presenting DCs in the SDLNs by using Xcr1Venus/+ mice, in which the coding region of the Xcr1 gene was replaced with a gene encoding the yellow fluorescent protein Venus (16). Xcr1-expressing DCs were found enriched in deep parts of the T-cell zone (Fig. 1A). Xcr1-expressing DCs were sparse in regions of the T-cell zone proximal to B-cell follicles or medullary regions, where many high endothelial venules (HEVs) and CD11b+ DCs were enriched (Fig. 1 A and B and Fig. S1A). These results are consistent with the previous multicolor histological analyses of cross-presenting DCs (12). Xcr1Venus/Venus cross-presenting DCs were found localized normally in the deep parts of the T-cell zone, indicating that XCR1 expression was not required for the localization (Fig. S1B).
Fig. 1.
Localization of Xcr1-expressing DCs and spatial segregation of antigen-engaged CD8+ T cells and CD4+ T cells in the SDLNs. (A and B) Immunofluorescence images of serial inguinal LN sections from an unimmunized Xcr1Venus/+ mouse. Fig. S1 shows the grayscale images of the individual fluorescence channels in A. (C and D) Fluorescence images of inguinal LN sections from Xcr1Venus/+ mice transferred with 5 × 10⁶ DiD-labeled OT-I T cells and 5 × 10⁶ tdTomato+ OT-II T cells. The LN sections are from an unimmunized mouse (C) and a mouse s.c. immunized with soluble OVA plus poly(I:C) for 24 h (D). “b,” “c,” and “m” indicate B-cell follicle, cortical side, and medullary side, respectively. (E and F) (Left) Distances between the Xcr1-Venus+ cell area centroid and individual OT-I or OT-II T cells. Each symbol represents one cell. Bars indicate median values in each group. Data are pooled from three images of different lymph nodes from unimmunized mice (E) or mice immunized with OVA plus poly(I:C) for 24 h (F). Fig. S1 C and D shows the processed images used for data analysis. Bars indicate mean values in each group.
Fig. S1.
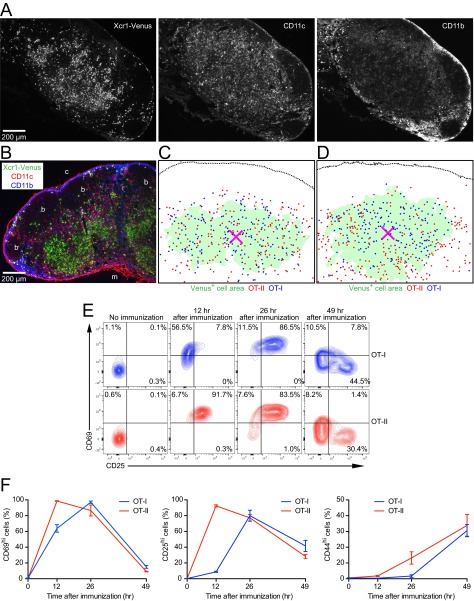
Single-channel images of Fig.1A, XCR1-independent localization of cross-presenting DCs in the SDLN, processed images of Fig. 1 C and D, and up-regulation of T-cell activation markers after immunization. (A) Grayscale images of the individual colors in Fig.1A. (B) Immunofluorescence image of a LN section from an unimmunized Xcr1Venus/Venus mouse. “b,” “c,” and “m” indicate B-cell follicle, cortical side, and medullary side, respectively. (C and D) Processed images of Fig. 1 C and D, respectively, for measuring the distances between the centroid of the Xcr1-expressing DC-rich region and antigen-specific T cells. The magenta X mark represents the area centroid of Xcr1-Venus+ cell area, demarcated as described in SI Materials and Methods. Each dot corresponds to the cell centroid of an OT-I or an OT-II T cell. (E and F) Flow cytometric analysis of activation marker expressions of OT-I T cells and OT-II T cells in SDLNs at indicated time points after immunization. Percentages of CD69hi cells, CD25hi cells, and CD44hi cells are shown in F. Data represent mean ± SEM (n = 3).
To investigate the relationship between the differential localization of the DC subsets and activation of CD8+ T cells and CD4+ T cells, we cotransferred ovalbumin (OVA)-specific TCR transgenic CD8+ (OT-I) T cells (20) and OVA-specific TCR transgenic CD4+ (OT-II) T cells (21) to Xcr1Venus/+ mice. Before immunization, OT-I T cells and OT-II T cells seemed to be evenly distributed throughout the T-cell zone (Fig. 1C). However, quantitative analysis to measure the distance between individual antigen-specific T cells and the centroid of the Xcr1-expressing DC area showed that OT-I T cells were distributed slightly but significantly closer to the Xcr1-expressing DC area centroid than OT-II T cells (Fig. 1E and Fig. S1C). Although priming of OT-I T cells seemed to be slower than that of OT-II T cells after immunization with soluble OVA plus double-stranded RNA analog poly (I:C) adjuvant, the majority of both OT-I and OT-II T cells had up-regulated CD69 and CD25 by about 1 d postimmunization (Fig. S1 E and F). At this time point, OT-I T cells accumulated in the Xcr1-expressing DC-rich region whereas OT-II T cells were mostly localized in the Xcr1-expressing DC-sparse region (Fig. 1 D and F and Fig. S1D). These results indicate that the T-cell zone is compartmentalized into subregions for cognate interactions of CD8+ T cells with Xcr1-expressing DCs and for cognate interactions of CD4+ T cells with Xcr1− DCs. They also suggest that migration of naive CD8+ T cells and CD4+ T cells in the T-cell zone is biased to facilitate scanning for their cognate DCs.
Xcr1-Expressing DCs Are the Main Interaction Partners of Antigen-Specific CD8+ T Cells.
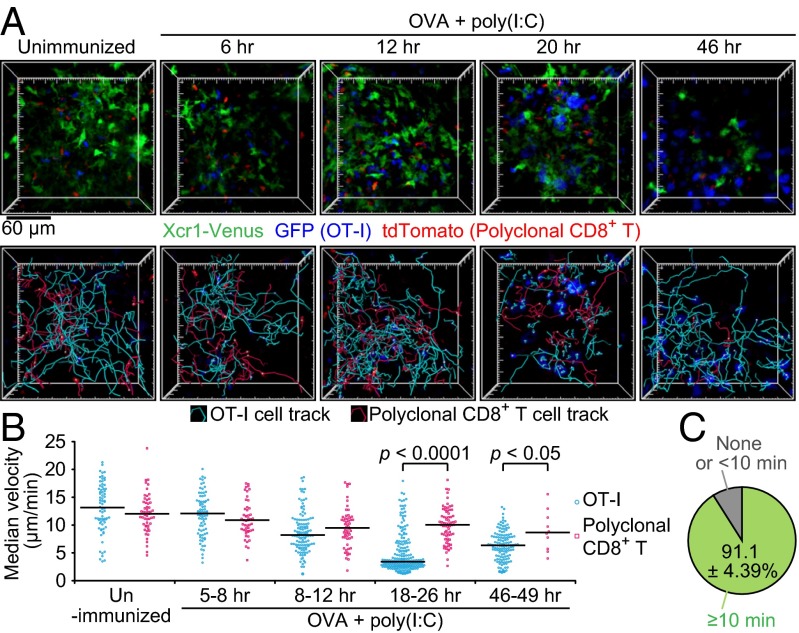
We analyzed the interaction dynamics between Xcr1-expressing DCs and antigen-specific CD8+ T cells with intravital two-photon excitation fluorescence microscopy of the SDLNs. Xcr1Venus/+ mice were cotransferred with GFP-expressing OT-I T cells and tdTomato-expressing polyclonal CD8+ T cells. One day later, the mice were s.c. immunized with soluble OVA plus poly(I:C). Further entry of lymphocytes into the SDLNs was blocked by i.v. injection of anti-CD62L antibody at 2 h after the immunization. OT-I T cells exhibited similar motility to polyclonal CD8+ T cells until 8 h postimmunization but started to decrease it by 12 h after immunization. By 18–26 h postimmunization, the majority of OT-I T cells became much more sessile, moving at a median velocity of ≤4 μm/min (Fig. 2 A and B and Movie S1), which suggests their sustained interactions with cognate antigen-presenting cells. Indeed, more than 90% of the sessile OT-I T cells were seen to form stable contacts with Xcr1-Venus+ DCs (Fig. 2C, Fig. S2A, and Movie S2). Interestingly, some Xcr1-Venus+ DCs seemed to be interacting with multiple OT-I T cells, whereas some of the other Xcr1-Venus+ DCs were not in stable contacts with OT-I T cells (Fig. 2A, Fig. S2A, and Movie S2). After 46 h of immunization, OT-I T cells swelled and regained their motility (Fig. 2 A and B and Movie S1). These results are largely consistent with the previous imaging reports about interactions between antigen-specific CD8+ T cells and peptide-pulsed DCs (3) and suggest that it takes 8–12 h for the emergence in the SDLNs of DCs that have cross-presented significant amounts of OVA.
Fig. 2.
Xcr1-expressing DCs are the main interaction partners of antigen-specific CD8+ T cells. Xcr1Venus/+ mice were cotransferred with 4 × 10⁶ GFP+ OT-I T cells and 1 × 10⁶ tdTomato+ polyclonal CD8+ T cells, s.c. immunized with soluble OVA plus poly(I:C), and subjected to intravital imaging of inguinal LNs. (A) The 3D-rendered fluorescence images, OT-I T-cell tracks, and polyclonal CD8+ T-cell tracks at the indicated time postimmunization. Imaging duration, 30 min; image depth, 75 μm (Movie S1). (B) Median velocity of OT-I T cells and polyclonal CD8+ T cells. Each symbol represents one cell. Bars indicate median values in each group. Data are pooled from at least two imaging sessions in different LNs. (C) Percentage of OT-I T cells stably interacting with Xcr1-expressing DCs in low-motility OT-I T cells (Fig. S2A and Movie S2). Values represent mean ± SEM (n = 3; 46, 18, and 69 low-motility OT-I T cells scored in each experiment).
Fig. S2.
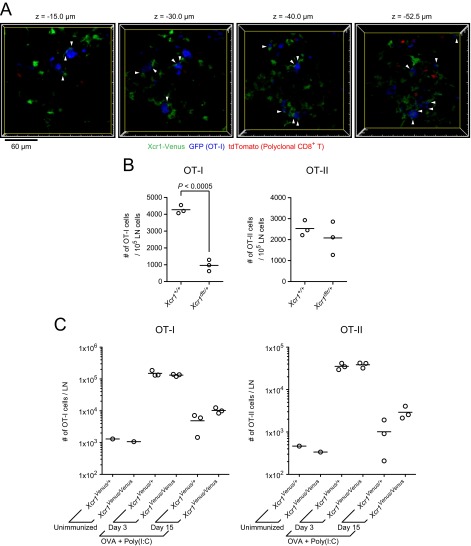
Stable interactions of Xcr1-expressing DCs with antigen-specific CD8+ T cells, assessment of the cellular roles for Xcr1-expressing DCs, and assessment of the molecular roles for XCR1 in the CD8+ T-cell response. (A) Single x–y plane fluorescence images of the LN at 20 h postimmunization in Fig. 2A. The arrowheads highlight the stable cell–cell contacts lasting more than 10 min between low-motility OT-I T cells (median velocity ≤4 μm) and Xcr1-expressing DCs (Movie S2). (B) Numbers of transferred OT-I T cells and OT-II T cells in the draining LNs of Xcr1+/+ mice and Xcr1DTRVenus/+ mice. The mice were treated with DT three times, i.e., 1 d before, 1 d after, and 3 d after s.c. immunization with soluble OVA plus poly(I:C). LN cells were analyzed by flow cytometry at 4 d postimmunization. Each symbol represents one mouse. Shown is a representation of similar results from two independent experiments. (C) Totals of 5 × 10⁵ OT-I T cells and 5 × 10⁵ OT-II T cells were cotransferred into Xcr1Venus/+ and Xcr1Venus/Venus mice on day −1. On day 0, the mice were s.c. immunized with 200 µg of OVA plus 20 µg of poly(I:C), and on day 3 and day 15, the draining LNs were analyzed by flow cytometry (unimmunized LNs were analyzed on day 3). Each symbol represents one mouse.
To confirm that the interaction with Xcr1-expressing DCs is important for antigen-specific CD8+ T-cell activation, we used Xcr1DTRVenus/+ mice to deplete Xcr1-expressing DCs (16) and evaluated its impact on the proliferation of antigen-specific CD8+ T cells upon immunization. Both Xcr1+/+ mice and Xcr1DTRVenus/+ mice were cotransferred with OT-I T cells and OT-II T cells and treated with diphtheria toxin (DT) on day −1. The mice were s.c. immunized with soluble OVA plus poly(I:C) on day 0, additionally treated with DT on day 1 and day 3, and killed for flow cytometric analysis of the SDLNs on day 4. This resulted in 86 ± 2.2% (n = 3) depletion of cross-presenting DCs (total number of LN-resident DCs and migratory DCs) in the SDLNs of Xcr1DTRVenus/+ mice. The number of OT-I T cells but not that of OT-II T cells was much reduced in the LNs of Xcr1DTRVenus/+ mice compared with Xcr1+/+ mice (Fig. S2B). These results indicate that Xcr1-expressing DCs are the primary interaction partners of antigen-specific CD8+ T cells in the SDLNs upon soluble antigen immunization.
Next we tested the function of XCR1 expressed by DCs in CD8+ T-cell responses. We transferred OT-I T cells to Xcr1Venus/+ mice and Xcr1Venus/Venus mice. On day 3 and day 15 after immunization with soluble OVA plus poly(I:C), we found no significant reduction in the OT-I T-cell number in draining LNs from Xcr1Venus/Venus mice compared with Xcr1Venus/+ mice (Fig. S2C). The deficiency of XCL1, a ligand for XCR1, in CD8+ T cells was reported to impair sustainment of antigen-engaged CD8+ T cells by 12 d after immunization (15). The reason for the seemingly contradictory results to those of the previous report is uncertain at this point, but it might be because of the different adjuvant types used for immunization or because of the potential existence of other unknown receptors for XCL1.
Photoconversion-Based Fluorescent Labeling of Xcr1-Expressing Resident CD8αhi DCs and Migratory Xcr1-Expressing CD103hi DCs in the SDLNs.
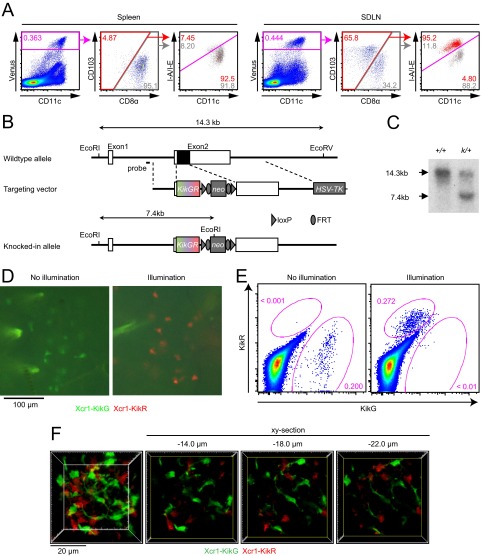
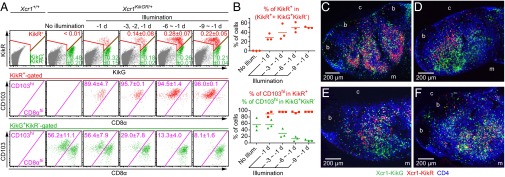
As shown previously (16), Xcr1-expressing DCs in the SDLNs consist of two populations: resident CD8αhi (MHC-IIint) DCs and migratory CD103hi (MHC-IIhi) DCs, the latter of which are absent in the spleen (Fig. S3A). To distinguish these two populations in imaging analyses, we generated the Xcr1KikGR/+ mouse strain, in which the Xcr1 coding region was replaced by a gene-encoding photoconvertible fluorescent protein, Kikume Green-Red (KikGR) (Fig. S3 B and C) (22). To photoconvert the KikGR protein expressed in the migratory Xcr1-expressing DCs in the dermis, the skin of the abdomen, lower back, hip, and thigh of Xcr1KikGR/+ mice was exposed to violet-blue light. Before skin illumination, Xcr1-expressing DCs in the skin and SDLNs were all green fluorescent (KikG+KikR−) (Fig. 3A and Fig. S3 D and E). Immediately after illumination, CD103hi DCs in the light-exposed skin became red fluorescent (KikR+) (Fig. S3 D and E). By 1 d after skin illumination, KikR+ cells became detectable in the SDLNs. As anticipated, most, if not all, of the KikR+ cells in the SDLNs were migratory CD103hi DCs (Fig. 3 A and B). Meanwhile the KikG+KikR− cells are a mixed population of migratory CD103hi DCs, which had reached the SDLNs before the skin illumination, and LN-resident CD8αhi DCs (Fig. 3 A and B). Repeated daily 3-min illumination on the skin resulted in a gradual replacement of the KikG+KikR−-labeled, migratory CD103hi DC pool in the SDLNs with the KikR+ cells. The LN-resident CD8αhi DCs (green fluorescent; KikG+KikR−) remained unchanged (Fig. 3 A and B). After 6 d of daily skin illumination, a near complete demarcation of migratory CD103hi DCs and LN-resident CD8αhi DCs by red fluorescence and green fluorescence, respectively, was achieved in the SDLNs (Fig. 3 A and B). Thus, it is suggested that a turnover of skin-derived CD103hi DCs in the SDLNs takes at least 6 d (half-life, about 3 d).
Fig. S3.
Xcr1-expressing DC subsets in the SDLN, generation of the Xcr1KikGR mouse strain, and photoconversion of Xcr1-expressing DCs in the skin. (A) Flow cytometry of the Xcr1Venus/+ mouse spleen and SDLN. (B) Schematic representation of the mouse Xcr1 wild-type allele, the targeting vector, and the KikGR knocked-in allele. Solid and open boxes denote coding and noncoding regions of Xcr1, respectively. neo, neomycin resistance gene; HSV-TK, herpes simplex virus thymidine kinase gene. (C) Southern blot analysis of Xcr1 wild-type (+/+) and Xcr1KikGR/+ (k/+) mice. Genomic DNAs were digested with EcoRI and EcoRV, electrophoresed, and hybridized with a radiolabeled probe indicated in B. Southern blot gave a 14.3-kbp and a 7.4-kbp band for the wild-type and KikGR knocked-in alleles, respectively. (D) Fluorescence images of the Xcr1KikGR/+ mouse skin with and without violet-blue light illumination. (E) Flow cytometry of cells isolated from the dermis of an Xcr1KikGR/+ mouse illuminated with violet-blue light. (F) Two-photon imaging of the intact inguinal LN of an Xcr1KikGR/+ mouse illuminated with violet-blue light as in Fig. 3D. A 3D-rendered image (F, Far Left; image depth, 50 μm) and single x–y plane fluorescence images at the indicated z distance from the top x–y plane of the 3D image volume are shown (Movie S3).
Fig. 3.
Photoconversion-based fluorescent labeling of Xcr1-expressing CD103hi migratory DCs and Xcr1-expressing CD8αhi resident DCs in the SDLNs. (A) Flow cytometry of inguinal LN cells from Xcr1KikGR/+ mice illuminated with violet-blue light at the indicated time points. Values represent mean ± SEM (n = 3). (B) Percentage of the indicated cell populations. Each symbol represents one mouse. (C–F) Confocal images of halves of inguinal LN sagittal slices from Xcr1KikGR/+ mice illuminated with violet-blue light once a day for 9 d (C), 1 d before analysis (D), 2 d before analysis (E), and 3 d before analysis (F). Shown is an x–y plane approximately 20 μm deep from the vibratome slice surface. “b,” “c,” and “m” indicate B-cell follicle, cortical side, and medullary side, respectively.
We conducted histological analysis of KikR+ DCs and KikG+KikR− DCs in the SDLNs. Because of the technical reasons described in SI Materials and Methods, we prepared vibratome slices of unfixed LNs instead of cryosections of fixed LNs. After 9 d of daily illumination, when the photoconversion-based color separation of migratory DCs and LN-resident DCs in the SDLNs had been already achieved (Fig. 3 A and B), the migratory DCs and LN-resident DCs were both found in the deep T-cell zone. LN-resident DCs, but not migratory DCs, were distributed also in other parts of the LNs, including the region close to the LN capsule (Fig. 3C). Two-photon microscopy analysis of intact LNs showed that migratory DCs and LN-resident DCs together form the meshwork, through which naive T cells migrate (Fig. S3F and Movies S3 and S4).
We tracked the dynamics of Xcr1-expressing CD103hi DCs after their arrival in the SDLNs. One day after skin illumination, KikR+ DCs were found in the cortical half of the Xcr1-expressing DC-rich area in the T-cell zone (Fig. 3D). Two days after illumination, KikR+ DCs infiltrated more extensively in the Xcr1-expressing DC-rich area, and 3 d after illumination, some of them reached the most medullary side of the T-cell zone (Fig. 3 E and F). These results indicate that after leaving the skin, migratory DCs infiltrate into the deep T-cell zone of the SDLNs in 3 d.
Antigen-Specific CD8+ T Cells Preferentially Interact with Migratory CD103hi DCs That Have Newly Arrived in the SDLNs.
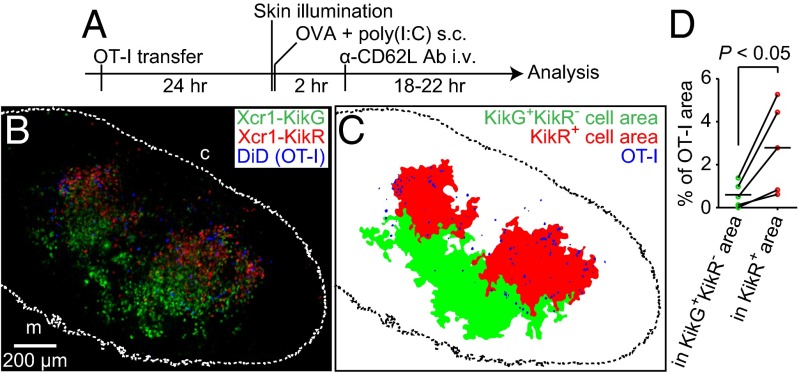
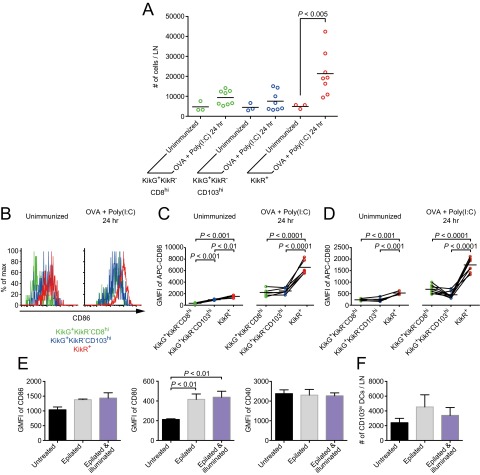
We sought to determine which Xcr1-expresssing DC subset is most efficiently engaged in interactions with antigen-specific CD8+ T cells after immunization. The migratory DCs in the SDLNs can be further subdivided into subpopulations: the migratory DCs newly arriving in the LNs after the immunization and the migratory DCs that have already reached the LNs before immunization. To visualize the distributions of antigen-specific CD8+ T cells and the migratory DC subpopulation newly arriving in the SDLNs upon immunization, Xcr1KikGR/+ mice were transferred with DiD-labeled OT-I T cells. The mice were subsequently illuminated with violet-blue light to photoconvert the migratory DCs in the skin and were immunized s.c. with soluble OVA plus poly(I:C). After 2 h, the mice were i.v. injected with anti-CD62L antibody (Fig. 4A). About 1 d after the skin illumination and immunization, KikR+ DCs were again found in the cortical half of the Xcr1-expressing DC-rich area. Interestingly, the majority of OT-I T cells were colocalized with the KikR+ DCs (Fig. 4 B–D). Flow cytometric analysis has shown that poly(I:C) injection at the time of skin illumination significantly increased the number of KikR+ DCs arriving in the SDLN in 1 d; whereas the number of migratory DCs that had reached the SDLNs before the skin illumination (KikG+KikR− CD103hi DCs) or that of the LN-resident DCs (KikG+KikR− CD8αhi DCs) was not significantly changed by poly(I:C) injection (Fig. S4A).
Fig. 4.
Antigen-specific CD8+ T cells colocalize with Xcr1+ migratory DCs that have arrived in the SDLN after immunization. (A) Experimental design. (B) A fluorescence image of a half of an inguinal LN sagittal slice from an Xcr1KikGR/+ mouse treated as described in A. A maximal projection image of six confocal sections (35-μm depth) is shown. The dotted line demarcates the LN boundary. “c” and “m” indicate cortical side and medullary side, respectively (C) Demarcation of the KikG+KikR− area, the KikR+ area, and the OT-I T-cell–occupied area in the image shown in B. See SI Materials and Methods for the demarcation method. (D) Area occupancy by OT-I T cells in the KikG+KikR− area and in the KikR+ area calculated from the data in C and four other datasets.
Fig. S4.
Activation of Xcr1+ migratory DCs upon immunization and assessment of illumination-induced effects on migratory DC properties. (A) Enumeration of the indicated cell populations in the inguinal LNs of Xcr1KikGR/+ mice. (B–D) Flow cytometric analysis of CD86 (B and C) and CD80 (D) expression on the indicated cell populations in the inguinal LNs of Xcr1KikGR/+ mice. (E and F) Xcr1KikGR/+ mice were epilated with depilatory cream, and on the following day the mice were illuminated with violet-blue light (SI Materials and Methods). After 24 h the inguinal LNs were analyzed by flow cytometry. Geometric mean of fluorescence intensity (GMFI) of the indicated DC activation markers (E) and the cell numbers (F) of Xcr1+CD103hi DCs are shown. Data represent mean ± SEM (n = 3).
To gain molecular insights into the T-cell–DC interactions, we analyzed the surface expression of costimulatory molecules in each DC subset. Without Poly(I:C) injection, expression of the costimulatory molecules CD86 and CD80 was only slightly higher on the migratory DCs newly arriving in the SDLNs (KikR+ DCs) than on the migratory DCs that have reached the nodes before immunization (KikG+KikR− CD103hi DCs) and LN-resident DCs (KikG+KikR− CD8αhi DCs) (Fig. S4 B–D), which suggests that illumination-induced activation of the migratory DCs in the skin was minimal, if any. The slight activation of CD103hi DCs seemed to be caused by the hair removal procedure using depilatory cream rather than by light illumination (Fig. S4 E and F). One day after Poly(I:C) injection, CD86 and CD80 were up-regulated in all of the three DC subsets, and the up-regulation was most prominent in the migratory DCs newly arriving in the SDLNs (KikR+ DCs) (Fig. S4 B–D).
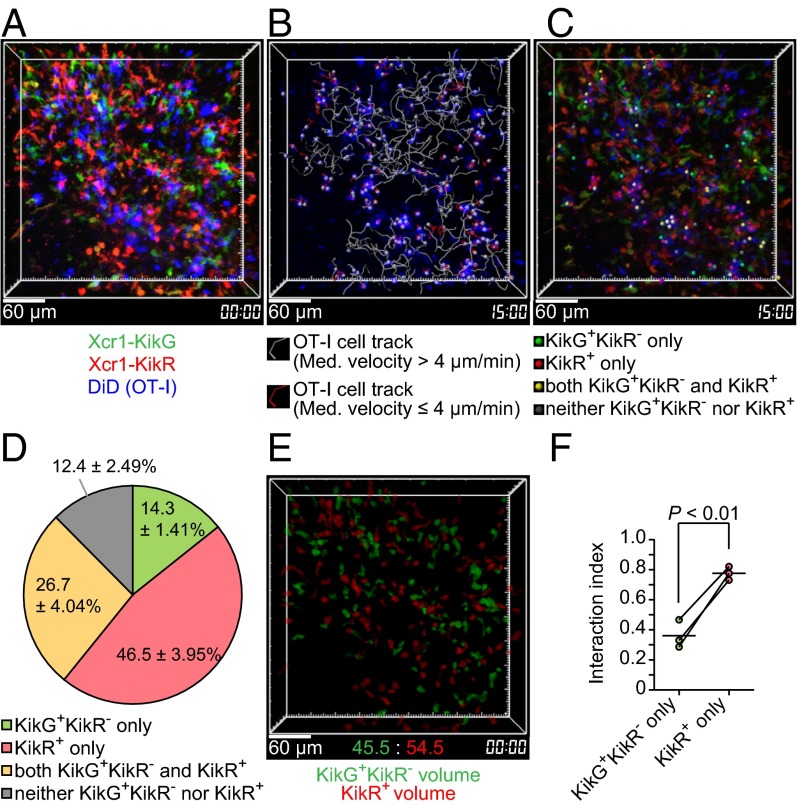
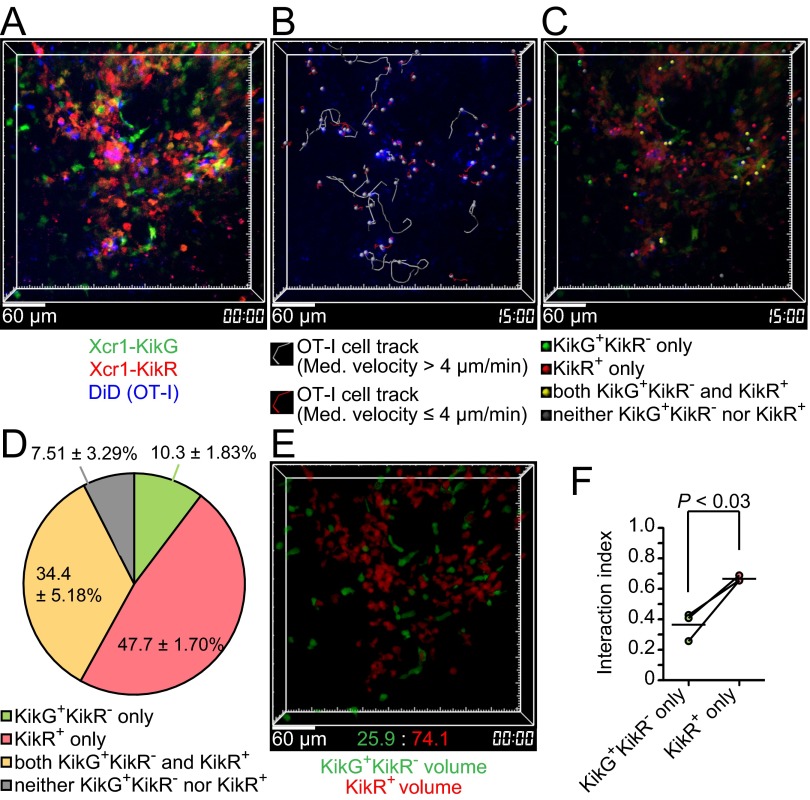
For the direct assessments of stable interactions, we performed intravital imaging of the KikR+ DC-infiltrated region, using the protocol shown in Fig. 4A. Among OT-I T cells that had slowed down their migration (median speed less than 4 μm/min, Fig. 2B), we found OT-I T cells interacting with (i) KikG+KikR− DCs but not with KikR+ DCs, (ii) KikR+ DCs but not with KikG+KikR− DCs, and (iii) both KikG+KikR− DCs and KikR+ DCs. The number of those in contact with (ii) KikR+ DCs but not with KikG+KikR− DCs for more than 10 min was significantly (P < 0.002) more than the number of those in contact with (i) KikG+KikR− DCs but not with KikR+ DCs (Fig. 5 A–D and Movies S5 and S6). Because there seemed to be more KikR+ DCs than KikG+KikR− DCs in the imaging volumes, we normalized the results in Fig. 5D by the volumes occupied by KikR+ DCs or KikG+KikR− DCs (Fig. 5E and SI Materials and Methods). The resultant “interaction indexes” suggested that individual KikR+ DCs are more capable of stably interacting with OT-I T cells than individual KikG+KikR− DCs (Fig. 5F). A similar trend was observed when we performed imaging analysis using the 9-d illumination protocol to compare KikR+ entire migratory DCs and KikG+KikR− resident DCs (Fig. S5). Taken together, these results suggest that migratory DCs arriving in the SDLN after s.c. immunization with soluble antigen plus double-stranded RNA analog are most efficiently engaged in stable interactions with antigen-specific CD8+ T cells.
Fig. 5.
Antigen-specific CD8+ T cells preferentially interact with Xcr1+ migratory DCs that arrived in the SDLN after immunization. (A) An intravital two-photon image of an inguinal LN of an Xcr1KikGR/+ mouse treated as in Fig. 4A, except that 8 × 10⁶ OT-I T cells were transferred. A 3D-rendered fluorescence image is shown. Image depth: 100 μm (Movie S5). (B) OT-I T-cell tracks. Imaging duration: 30 min. (C) The interaction partners of low-motility OT-I T cells (median velocity ≤4 μm). The colored dots were placed on low-motility OT-I T cells interacting with the indicated cells (Movie S6). (D) Percentage of the interaction partners of low-motility OT-I T cells. Data represent mean ± SEM (n = 3, 43, 113, and 121 stable interactions lasting more than 10 min in each experiment). (E) Reconstructed KikG+KikR− cell volumes and KikR+ cell volumes. (F) Interaction index (SI Materials and Methods). Each pair of red and green symbols represents one mouse.
Fig. S5.
Cell–cell interaction analysis of antigen-specific CD8+ T cells with Xcr1+ migratory DCs using the 9-d illumination protocol. (A) An intravital two-photon image of an inguinal LN of an Xcr1KikGR/+ mouse treated as described in Fig. 4A, except that the mouse was illuminated with violet-blue light once a day for 8 d before the immunization and transferred with 7 × 10⁶ OT-I T cells. A 3D-rendered fluorescence image is shown. Image depth: 100 μm. (B) OT-I T-cell tracks. Imaging duration: 30 min. (C) The interaction partners of low-motility OT-I T cells (median velocity ≤4 μm). The colored dots were placed on low-motility OT-I T cells interacting with the indicated cells. (D) Percentage of the interaction partners of low-motility OT-I T cells. Data represent mean ± SEM (n = 3, 60, 57, and 57 stable interactions lasting more than 10 min in each experiment). (E) Reconstructed KikG+KikR− cell volumes and KikR+ cell volumes. (F) Interaction index (SI Materials and Methods). Each pair of red and green symbols represents one lymph node.
Discussion
It is often argued that the immune system is organized to optimize the cell–antigen and cell–cell interactions underlying immune function. Indeed, the distinct properties and roles of DC subsets in T-cell activation and regulation may explain the physiological significance of the differential localization of DC subsets in the spleen and SDLNs (12, 23). Our studies on the DC localization in Xcr1 reporter mice confirm the localization patterns suggested by computational processing of multicolor histological images: LN-resident CD8αhi DCs and migratory CD103hi DCs are enriched in the deep part of the T-cell zone in the SDLNs; CD11b+ DCs are enriched near the lymphatic sinuses and conduits (12, 19). Our results suggest that this DC regionalization creates segregated locations for activation of antigen-specific CD4+ T cells and CD8+ T cells. Given recent findings (19), this may suggest that it is advantageous for CD11b+ DCs to sample antigens from the LN sinuses and conduits for rapid CD4+ T-cell activation; in contrast, antigen delivery for CD8+ T-cell activation may be more dependent on migratory DCs that capture antigen in the skin and migrate to the T-cell zone of the SDLNs. This notion is consistent with our data showing that OT-II T-cell activation was somewhat faster than OT-I T-cell activation. Our results also suggest that migration of naive CD8+ T cells and CD4+ T cells in the T-cell zone is biased to facilitate scanning for their cognate DCs. This notion is also supported by the previous observation that naive CD4+ T cells spend less time scanning the T-cell zone than naive CD8+ T cells after their LN entry through HEVs near the conduits and before their exit from the sinuses (24).
During the revision of this paper, the spatiotemporal characterization of antigen-specific CD4+ T cells and CD8+ T cells in the SDLNs was reported in HSV-1 or vaccinia virus infection (25, 26). Although the location and/or timing of initial activation of CD4+ T cells and CD8+ T cells and the roles of XCR1+ DCs vary, depending on the types of vaccines and microbes, these studies, together with ours, clearly indicate spatially or temporally segregated interactions of DC subsets with antigen-specific CD4+ T cells and CD8+ T cells.
Our data show that after immunization with soluble antigen and double-stranded RNA, Xcr1-expressing migratory DCs that have newly arrived in the SDLN interacted with antigen-specific CD8+ T cells more prominently than other Xcr1-expressing DCs, i.e., LN-resident DCs and the migratory DCs that had arrived in the LNs before immunization. Future studies need to test whether the superior interaction ability is dependent on the prominent up-regulation of CD86 and CD80 by the newly arriving migratory DCs, because the costimulatory molecules can strengthen antigen-dependent interactions between T cells and DCs (27). It is also likely, but not certain, that the newly arriving migratory DCs present the highest amounts of peptides after they have encountered antigen plus double-stranded RNA in the skin. Nonetheless, we observed that a nonnegligible number of LN-resident DCs were stably interacting with antigen-specific CD8+ T cells. LN-resident DCs can present antigen that has been transported either through lymphatic sinuses and conduits or through antigen transfer from the newly arriving migratory DCs (19, 28). In this sense, it is of note that a small fraction of Xcr1-expressing DCs near the LN capsule are predominantly LN-resident DCs. It will be needed to investigate whether Xcr1-expressing LN-resident DCs sample antigen from the subcapsular sinus and migrate to the T-cell zone for interacting with CD8+ T cells. More importantly, future studies should perform similar imaging analyses with the Xcr1KikGR/+ mouse strain during different types of immune responses, because capabilities of the migratory and resident DC subsets to interact with CD8+ T cells are likely to be affected by the types of vaccines and microbes (17, 25, 26, 28).
In this study we have directly shown the immigration kinetics of Xcr1-expressing migratory DCs from the skin to the SDLNs. The turnover rate of these migratory DCs in the SDLNs from our photoconversion experiments is similar to the one reported previously: 9 d for the BrdU-labeled CD8+DEC-205+ DCs in the SDLNs, which were presumably a mixture of LN-resident CD8αhi DCs and migratory CD103hi DCs (29). A recent study used transgenic mice expressing KikGR ubiquitously to infer a shorter lifetime of MHC-IIhiCD103+ DCs (4–5 d), likely to be the same population as migratory CD103hi DCs in this study (30). The reason for this faster turnover is unclear, but it may reflect their more invasive method to surgically expose the SDLNs (30).
Turnover dynamics of LN-resident DCs could not be assessed in this study. However, a previous work reported that transferred DC precursors, which could give rise to LN-resident DCs including CD8αhi DCs, primarily entered the SDLNs through HEVs in the medullary side and then appeared near the LN sinus in 6 d (31). This may suggest that LN-resident DCs in the deepest region of the T-cell zone are newly formed from DC precursors. Because we have observed that the migratory DCs eventually reach the same region, it would be interesting to test in future studies whether antigen transfer occurs from the migratory DCs to the newly differentiated LN-resident DCs in this region (32).
Our previous work analyzing Xcr1-expressing DCs in various tissues using Xcr1Venus/+ mice has shown that CD103hi DCs in the gut lamina propria and mesenteric LNs are expressing a similar level of Venus to that in CD103hi DCs in the SDLNs (16). The CD103+ DCs in the lamina propria are thought to induce differentiation of naive CD4+ T cells into regulatory T cells in the mesenteric LNs to establish immune tolerance in the gut (33, 34). However, much remains to be learned about migration dynamics of the CD103hi DCs from the lamina propria to the mesenteric LNs. The Xcr1KikGR/+ mouse strain developed here will enable future studies to track the mucosal CD103hi DCs, providing insights into the mechanisms underlying T-cell regulation as well as T-cell activation.
Materials and Methods
Mice.
All animal experiments were approved by the Animal Research Committees of RIKEN Yokohama Research Institute and Osaka University. Generation of the Xcr1KikGR mouse strain and information about the other mice are in SI Materials and Methods.
Photoconversion.
Illumination of the mouse skin was performed as described in ref. 35 with some modifications. The details are described in SI Materials and Methods.
Intravital Two-Photon Microscopy.
The inguinal LN of an anesthetized mouse was imaged by the TCS SP5 inverted microscope (Leica Microsystems) equipped with a Chameleon Ultra II Ti:Sapphire laser (Coherent). The details are described in SI Materials and Methods.
Image Analysis of Two-Photon Microscopy.
Cell-tracking and cell–cell interaction analyses were performed using Imaris software (Bitplane) as described previously (36). The cell volume was obtained by using the “Cells” function of Imaris. The details are described in SI Materials and Methods.
Preparation of Vibratome Slices.
Inguinal LNs embedded in an agarose gel were sagittally sliced by a VT1200 S vibrating blade microtome (Leica Microsystems). The slices were stained with antibodies and imaged by an SP5 II confocal microscope (Leica Microsystems). The details are described in SI Materials and Methods.
The other methods used in this study including flow cytometry, cell preparation, immunization, cryosection staining, and statistical analysis are described in detail in SI Materials and Methods.
SI Materials and Methods
Mice.
Xcr1Venus and Xcr1DTRVenus mice have been previously described as XCR1-venus and XCR1-DTRvenus mice, respectively (16). The Xcr1KikGR mouse strain was generated by the same strategy as for the Xcr1Venus mice, except that KikGR cDNA from a plasmid, phKikGR1-S1 (MBL), was used instead of Venus cDNA (Fig. S3A). C57BL/6J mice were purchased from CLEA Japan. B6-CD45.1 (Jax 002014), UBC-GFP (Jax 004353), tdTomato (see below), OT-I (Jax 003831), and OT-II (Jax 004194) mice were bred and maintained in the specific pathogen-free conditions. The tdTomato mice were generated by crossing Ai14 mice (Jax 007908) and CAG-Cre mice (37).
Flow Cytometry.
For cell staining, anti-CD4 (clone RM4-5, PerCP/Cy5.5; BioLegend), anti-CD8α (clone 53–6.7, APC/Cy7; BioLegend), anti-CD11c (clone N418, Pacific Blue; BioLegend), anti-CD45.1 (A20, Pacific Blue, APC/Cy7; BioLegend), anti-CD45.2 (clone 104, PE; BioLegend), anti-CD103 (clone 2E7, biotin, PerCP/Cy5.5; BioLegend), and anti-I-A/I-E (clone M5/114.15.2, APC; BioLegend) antibodies and streptavidin (PE/Cy7; BioLegend) were used. SDLNs and spleens were minced and incubated in DMEM supplemented with 1 mg/mL Collagenase Type 4 (Worthington Biochemical Corporation) and 100 μg/mL DNase I (Sigma-Aldrich) for 30 min at 37 °C. Then the cell suspension was added with EDTA, mushed through 70-μm filters, and resuspended in PBS containing 2% (vol/vol) FBS, 2 mM EDTA, and 0.05% NaN3. All flow cytometry data were collected on FACSCanto II (BD Biosciences). The lasers, dichroic mirrors, and filters used were as described previously (38).
Cell Isolation, Labeling, Adoptive Transfer, and Immunization.
Spleen and peripheral and mesenteric LN cells were harvested by mashing through 70-μm nylon cell strainers (BD Biosciences) in DMEM containing 1% FBS. Non-CD8+ T cells were labeled with biotinylated anti-B220 (RA3-6B2; BioLegend), anti-CD4 (RM4-5; BioLegend), anti-CD11b (M1/70.15; BD Biosciences), anti-CD11c (HL3; BD Biosciences), and anti-Gr-1 (RB6-8C5; BioLegend) antibodies, followed by Streptavidin MicroBeads (Miltenyi Biotec). Unlabeled CD8+ T cells were purified with AutoMACS or AutoMACS Pro cell separator (Miltenyi Biotec) and the purity of CD8+ T cells was typically >85%. In some experiments, purified CD8+ T cells were labeled with 5 μM Vybrant DiD (Life Technologies) in DMEM containing 1% FBS for 30 min at 37 °C. In most experiments 5 × 10⁵–5 × 10⁶ antigen-specific T cells were transferred intravenously. The mice were then immunized s.c. in the base of the tail and the flank with 10 μg of OVA (Sigma-Aldrich) plus 2 μg of poly(I:C) in PBS per site unless otherwise indicated. For imaging experiments mice were treated i.v. with 100 μg of anti-CD62L antibody (clone MEL-14; BioLegend) at 2 h postimmunization. In some experiments, DT (Sigma-Aldrich) was injected i.p. at a dose of 16 ng/g body weight.
Photoconversion.
The lower body of Xcr1KikGR/+ mice was shaved, and remaining hair was removed with depilatory cream 1 d before the illumination. Violet-blue light was supplied from an irradiance unit SP500 (USHIO) equipped with a 500-W mercury lamp through a 436/26-nm band-pass filter. Round skin spots ∼2 cm in diameter covering the abdomen, lower back, hip, and thigh of anesthetized mice were exposed for 3 min per each spot, while small skin areas right above inguinal LNs were shielded with aluminum foil (0.5 cm × 0.5 cm) to avoid photoconversion in the LNs.
Immunofluorescence Microscopy of Cryosections.
Cryosections of LNs were made as previously described (39) and were stained with anti-GFP (MBL) followed by Alexa Flour 488-conjugated anti-rabbit IgG (Invitrogen), PE-conjugated anti-CD11b (M1/70.15; BD Biosciences), anti-PNAd (MECA79; BD Biosciences) followed by PE-conjugated anti-mouse IgM (SouthernBiotech), and APC-conjugated anti-CD11c (HL3; BD Biosciences). DiD-labeled cells and tdTomato+ cells were detected by their fluorescence without staining. Images were acquired on a BZ-9000 (Keyence) and processed with Photoshop (CS6; Adobe). To demarcate the Xcr1-Venus+ cell area in LN sections, Venus fluorescence images were median filtered (size: 3 × 3) by MetaMorph Offline 7.7.0.0, and the area, covering filtered signals and containing more than 1,000 pixels, was obtained as Xcr1-Venus+ cell area. The area centroids were calculated using the Integrated Morphometry Analysis module of MetaMorph.
Intravital Two-Photon Microscopy.
Mice were anesthetized with isoflurane in a stream of oxygen. Hair above an inguinal LN was removed with depilatory cream, the mouse was placed on a heated stage set at 37 °C, and the cortical side of the inguinal LN was exposed through a small skin incision by microsurgery. The LN was imaged by a TCS SP5 inverted microscope (Leica Microsystems) equipped with a Leica 25×/0.95 NA water immersion objective and resonant scanning mirrors. Multiphoton excitation was provided by a Chameleon Ultra II Ti:Sapphire laser (Coherent). For image acquisition, 200–360 μm × 200–360 μm x–y planes were scanned at a resolution of 0.4–0.8 μm per pixel and images of 41–51 x–y planes with 2.0- to 2.5-μm z spacing were formed after averaging eight video frames for each x–y plane. For detecting GFP, Venus, and tdTomato, the laser was tuned to 980 nm. Emission signals were separated by a dichroic mirror at 520 nm and then further separated by a dichroic mirror at 560 nm. A 510/20-nm emission filter was used for GFP, a 535/30-nm emission filter for Venus, and a 585/40-nm emission filter for tdTomato. For detecting KikG, KikR, and DiD, the laser was tuned to 1,014 nm. Emission signals were separated by a dichroic mirror at 560 nm and then further separated by a dichroic mirror at 620 nm. A 525/50-nm emission filter was used for KikG, a 585/40-nm emission filter for KikR, and a 650/50-nm emission filter for DiD.
Image Analysis of Two-Photon Microscopy.
Before data analysis, fluorescence bleed-through between the detection channels (GFP signals into the Venus channel, GFP signals into the tdTomato channel, Venus signals into the tdTomato channel, KikG signals into the KikR channel, and KikR signals into the DiD channel) was subtracted on MetaMorph Offline 7.7.0.0 (Molecular Devices) based on the measurement of single-color samples. Sequences of image stacks were transformed into volume-rendered time-lapse movies, using Imaris 5.7.2 or Imaris 7.5.2 (Bitplane). Cell-tracking and cell–cell interaction analyses were performed as described previously (36). All of the OT-I T cells and polyclonal CD8+ T cells visible at the midpoint of the imaging duration were selected for cell tracking, and cell tracks that lasted longer than 5 min were used for analyses of motility and interactions with DCs. The “Cells” function of Imaris 7.5.2 was used for 3D reconstruction of the KikG+KikR− cell volumes and KikR+ cell volumes. The KikG+ cell volumes and KikR+ cell volumes were generated using the default settings in Cells. Then, to generate the KikG+KikR− cell volumes, the permissible limit for KikR signal intensity in the KikG+ cell volumes was lowered until parts overlapping with the KikR+ cell volumes were eliminated. The volume occupancy of KikG+KikR− cells or KikR+ cells was calculated as the percentage of the volume of each cell population in the summed volume of both cell populations. The interaction indexes in Fig. 5F and Fig. S5F were determined by dividing the percentage of OT-I T cells interacting only with KikG+KikR− cells or only with KikR+ cells by the corresponding volume occupancy of either KikG+KikR− cells or KikR+ cells. After Effects CS4 (Adobe) was used for video annotation and compilation.
Preparation of Vibratome Slices and Image Analysis.
For histological analysis of KikG+KikR− cells and KikR+ cells, it was necessary to detect their own fluorescence because there were no anti-KikGR antibodies available to distinguish between the two populations. Because KikGR fluorescence became hardly detectable in cryosections of fixed or unfixed LNs, vibratome slices of unfixed LNs were generated. Inguinal LNs embedded in a 1.6% (wt/vol) agarose gel were sagittally sliced at 300 μm thickness by a VT1200 S vibrating blade microtome (Leica Microsystems). LN slices were stained with Cy5-conjugated anti-mouse CD4, clone GK1.5 (eBioscience), placed in PBS on 24-mm × 60-mm cover glasses (Matsunami Glass), and imaged by an SP5 II confocal microscope (Leica Microsystems). To demarcate the KikG+KikR− cell area and the KikR+ cell area in LN slices, green or red fluorescence images were median filtered (size: 3 × 3) by MetaMorph Offline 7.7.0.0, and the area, covering filtered signals and containing more than 1,000 pixels, was obtained as the KikG+ cell area or the KikR+ cell area. The KikG+KikR− cell area was obtained by subtracting overlapping area between the KikR+ area and the KikG+ area from the KikG+ area.
Statistical Analysis.
A Student’s t test (two-tailed) and a Mann–Whitney test were used for the statistical analysis of differences between two groups with normal or nonnormal distribution, respectively. Means between three related groups in Fig. S4 C–F were compared with repeated (Fig. S4 C and D) and nonrepeated (Fig. S4 E and F) measures ANOVA with Tukey’s multiple-comparison test.
Supplementary Material
Acknowledgments
We thank I. Ogahara, Y. Fukuda, S. Moriyama, C. Tran, S. Takahashi, S. Fujii, and C. Allen for technical assistance and advice; J. Miyazaki for CAG-Cre mice; and T. Yano and M. Sugiyama for discussion and maintaining the mutant mice. This work was supported by a RIKEN Special Postdoctoral Researcher Program (M.K.); a Japan Society for The Promotion of Science Postdoctoral Fellowship for Research Abroad (to M.K.); a Human Frontier Science Program Long-Term Fellowship (to M.K.); the Translational Imaging Center, University of Southern California (M.K. and S.E.F.); and the Ministry of Education, Culture, Sports, Science, and Technology of Japan (M.K., T.K., and T.O.).
Footnotes
The authors declare no conflict of interest.
This article is a PNAS Direct Submission.
This article contains supporting information online at www.pnas.org/lookup/suppl/doi:10.1073/pnas.1513607113/-/DCSupplemental.
References
- 1.Mellman I, Steinman RM. Dendritic cells: Specialized and regulated antigen processing machines. Cell. 2001;106(3):255–258. doi: 10.1016/s0092-8674(01)00449-4. [DOI] [PubMed] [Google Scholar]
- 2.Germain RN, Robey EA, Cahalan MD. A decade of imaging cellular motility and interaction dynamics in the immune system. Science. 2012;336(6089):1676–1681. doi: 10.1126/science.1221063. [DOI] [PMC free article] [PubMed] [Google Scholar]
- 3.Henrickson SE, et al. In vivo imaging of T cell priming. Sci Signal. 2008;1(12):pt2. doi: 10.1126/stke.112pt2. [DOI] [PubMed] [Google Scholar]
- 4.Moreau HD, Bousso P. Visualizing how T cells collect activation signals in vivo. Curr Opin Immunol. 2014;26:56–62. doi: 10.1016/j.coi.2013.10.013. [DOI] [PubMed] [Google Scholar]
- 5.Joffre OP, Segura E, Savina A, Amigorena S. Cross-presentation by dendritic cells. Nat Rev Immunol. 2012;12(8):557–569. doi: 10.1038/nri3254. [DOI] [PubMed] [Google Scholar]
- 6.Lindquist RL, et al. Visualizing dendritic cell networks in vivo. Nat Immunol. 2004;5(12):1243–1250. doi: 10.1038/ni1139. [DOI] [PubMed] [Google Scholar]
- 7.Liu K, Nussenzweig MC. Origin and development of dendritic cells. Immunol Rev. 2010;234(1):45–54. doi: 10.1111/j.0105-2896.2009.00879.x. [DOI] [PubMed] [Google Scholar]
- 8.Bar-On L, Jung S. Defining dendritic cells by conditional and constitutive cell ablation. Immunol Rev. 2010;234(1):76–89. doi: 10.1111/j.0105-2896.2009.00875.x. [DOI] [PubMed] [Google Scholar]
- 9.Heath WR, Carbone FR. Dendritic cell subsets in primary and secondary T cell responses at body surfaces. Nat Immunol. 2009;10(12):1237–1244. doi: 10.1038/ni.1822. [DOI] [PubMed] [Google Scholar]
- 10.del Rio ML, Bernhardt G, Rodriguez-Barbosa JI, Förster R. Development and functional specialization of CD103+ dendritic cells. Immunol Rev. 2010;234(1):268–281. doi: 10.1111/j.0105-2896.2009.00874.x. [DOI] [PubMed] [Google Scholar]
- 11.Kissenpfennig A, et al. Dynamics and function of Langerhans cells in vivo: Dermal dendritic cells colonize lymph node areas distinct from slower migrating Langerhans cells. Immunity. 2005;22(5):643–654. doi: 10.1016/j.immuni.2005.04.004. [DOI] [PubMed] [Google Scholar]
- 12.Gerner MY, Kastenmuller W, Ifrim I, Kabat J, Germain RN. Histo-cytometry: A method for highly multiplex quantitative tissue imaging analysis applied to dendritic cell subset microanatomy in lymph nodes. Immunity. 2012;37(2):364–376. doi: 10.1016/j.immuni.2012.07.011. [DOI] [PMC free article] [PubMed] [Google Scholar]
- 13.Bachem A, et al. Expression of XCR1 characterizes the Batf3-dependent lineage of dendritic cells capable of antigen cross-presentation. Front Immunol. 2012;3:214. doi: 10.3389/fimmu.2012.00214. [DOI] [PMC free article] [PubMed] [Google Scholar]
- 14.Yamazaki C, et al. Conservation of a chemokine system, XCR1 and its ligand, XCL1, between human and mice. Biochem Biophys Res Commun. 2010;397(4):756–761. doi: 10.1016/j.bbrc.2010.06.029. [DOI] [PubMed] [Google Scholar]
- 15.Dorner BG, et al. Selective expression of the chemokine receptor XCR1 on cross-presenting dendritic cells determines cooperation with CD8+ T cells. Immunity. 2009;31(5):823–833. doi: 10.1016/j.immuni.2009.08.027. [DOI] [PubMed] [Google Scholar]
- 16.Yamazaki C, et al. Critical roles of a dendritic cell subset expressing a chemokine receptor, XCR1. J Immunol. 2013;190(12):6071–6082. doi: 10.4049/jimmunol.1202798. [DOI] [PubMed] [Google Scholar]
- 17.Bedoui S, et al. Cross-presentation of viral and self antigens by skin-derived CD103+ dendritic cells. Nat Immunol. 2009;10(5):488–495. doi: 10.1038/ni.1724. [DOI] [PubMed] [Google Scholar]
- 18.Sixt M, et al. The conduit system transports soluble antigens from the afferent lymph to resident dendritic cells in the T cell area of the lymph node. Immunity. 2005;22(1):19–29. doi: 10.1016/j.immuni.2004.11.013. [DOI] [PubMed] [Google Scholar]
- 19.Gerner MY, Torabi-Parizi P, Germain RN. Strategically localized dendritic cells promote rapid T cell responses to lymph-borne particulate antigens. Immunity. 2015;42(1):172–185. doi: 10.1016/j.immuni.2014.12.024. [DOI] [PubMed] [Google Scholar]
- 20.Hogquist KA, et al. T cell receptor antagonist peptides induce positive selection. Cell. 1994;76(1):17–27. doi: 10.1016/0092-8674(94)90169-4. [DOI] [PubMed] [Google Scholar]
- 21.Barnden MJ, Allison J, Heath WR, Carbone FR. Defective TCR expression in transgenic mice constructed using cDNA-based alpha- and beta-chain genes under the control of heterologous regulatory elements. Immunol Cell Biol. 1998;76(1):34–40. doi: 10.1046/j.1440-1711.1998.00709.x. [DOI] [PubMed] [Google Scholar]
- 22.Tsutsui H, Karasawa S, Shimizu H, Nukina N, Miyawaki A. Semi-rational engineering of a coral fluorescent protein into an efficient highlighter. EMBO Rep. 2005;6(3):233–238. doi: 10.1038/sj.embor.7400361. [DOI] [PMC free article] [PubMed] [Google Scholar]
- 23.Dudziak D, et al. Differential antigen processing by dendritic cell subsets in vivo. Science. 2007;315(5808):107–111. doi: 10.1126/science.1136080. [DOI] [PubMed] [Google Scholar]
- 24.Mandl JN, et al. Quantification of lymph node transit times reveals differences in antigen surveillance strategies of naive CD4+ and CD8+ T cells. Proc Natl Acad Sci USA. 2012;109(44):18036–18041. doi: 10.1073/pnas.1211717109. [DOI] [PMC free article] [PubMed] [Google Scholar]
- 25.Eickhoff S, et al. Robust anti-viral immunity requires multiple distinct T cell-dendritic cell interactions. Cell. 2015;162(6):1322–1337. doi: 10.1016/j.cell.2015.08.004. [DOI] [PMC free article] [PubMed] [Google Scholar]
- 26.Hor JL, et al. Spatiotemporally distinct interactions with dendritic cell subsets facilitates CD4+ and CD8+ T cell activation to localized viral infection. Immunity. 2015;43(3):554–565. doi: 10.1016/j.immuni.2015.07.020. [DOI] [PubMed] [Google Scholar]
- 27.Lim TS, et al. CD80 and CD86 differentially regulate mechanical interactions of T-cells with antigen-presenting dendritic cells and B-cells. PLoS One. 2012;7(9):e45185. doi: 10.1371/journal.pone.0045185. [DOI] [PMC free article] [PubMed] [Google Scholar]
- 28.Allan RS, et al. Migratory dendritic cells transfer antigen to a lymph node-resident dendritic cell population for efficient CTL priming. Immunity. 2006;25(1):153–162. doi: 10.1016/j.immuni.2006.04.017. [DOI] [PubMed] [Google Scholar]
- 29.Kamath AT, Henri S, Battye F, Tough DF, Shortman K. Developmental kinetics and lifespan of dendritic cells in mouse lymphoid organs. Blood. 2002;100(5):1734–1741. [PubMed] [Google Scholar]
- 30.Tomura M, et al. Tracking and quantification of dendritic cell migration and antigen trafficking between the skin and lymph nodes. Sci Rep. 2014;4:6030. doi: 10.1038/srep06030. [DOI] [PMC free article] [PubMed] [Google Scholar]
- 31.Liu K, et al. In vivo analysis of dendritic cell development and homeostasis. Science. 2009;324(5925):392–397. doi: 10.1126/science.1170540. [DOI] [PMC free article] [PubMed] [Google Scholar]
- 32.Inaba K, et al. Efficient presentation of phagocytosed cellular fragments on the major histocompatibility complex class II products of dendritic cells. J Exp Med. 1998;188(11):2163–2173. doi: 10.1084/jem.188.11.2163. [DOI] [PMC free article] [PubMed] [Google Scholar]
- 33.Sun CM, et al. Small intestine lamina propria dendritic cells promote de novo generation of Foxp3 T reg cells via retinoic acid. J Exp Med. 2007;204(8):1775–1785. doi: 10.1084/jem.20070602. [DOI] [PMC free article] [PubMed] [Google Scholar]
- 34.Coombes JL, et al. A functionally specialized population of mucosal CD103+ DCs induces Foxp3+ regulatory T cells via a TGF-beta and retinoic acid-dependent mechanism. J Exp Med. 2007;204(8):1757–1764. doi: 10.1084/jem.20070590. [DOI] [PMC free article] [PubMed] [Google Scholar]
- 35.Tomura M, et al. Activated regulatory T cells are the major T cell type emigrating from the skin during a cutaneous immune response in mice. J Clin Invest. 2010;120(3):883–893. doi: 10.1172/JCI40926. [DOI] [PMC free article] [PubMed] [Google Scholar]
- 36.Kitano M, Okada T. Four-dimensional tracking of lymphocyte migration and interactions in lymph nodes by two-photon microscopy. Methods Enzymol. 2012;506:437–454. doi: 10.1016/B978-0-12-391856-7.00047-0. [DOI] [PubMed] [Google Scholar]
- 37.Sakai K, Miyazaki Ji. A transgenic mouse line that retains Cre recombinase activity in mature oocytes irrespective of the cre transgene transmission. Biochem Biophys Res Commun. 1997;237(2):318–324. doi: 10.1006/bbrc.1997.7111. [DOI] [PubMed] [Google Scholar]
- 38.Kitano M, et al. Bcl6 protein expression shapes pre-germinal center B cell dynamics and follicular helper T cell heterogeneity. Immunity. 2011;34(6):961–972. doi: 10.1016/j.immuni.2011.03.025. [DOI] [PubMed] [Google Scholar]
- 39.Moriyama S, et al. Sphingosine-1-phosphate receptor 2 is critical for follicular helper T cell retention in germinal centers. J Exp Med. 2014;211(7):1297–1305. doi: 10.1084/jem.20131666. [DOI] [PMC free article] [PubMed] [Google Scholar]
Associated Data
This section collects any data citations, data availability statements, or supplementary materials included in this article.


