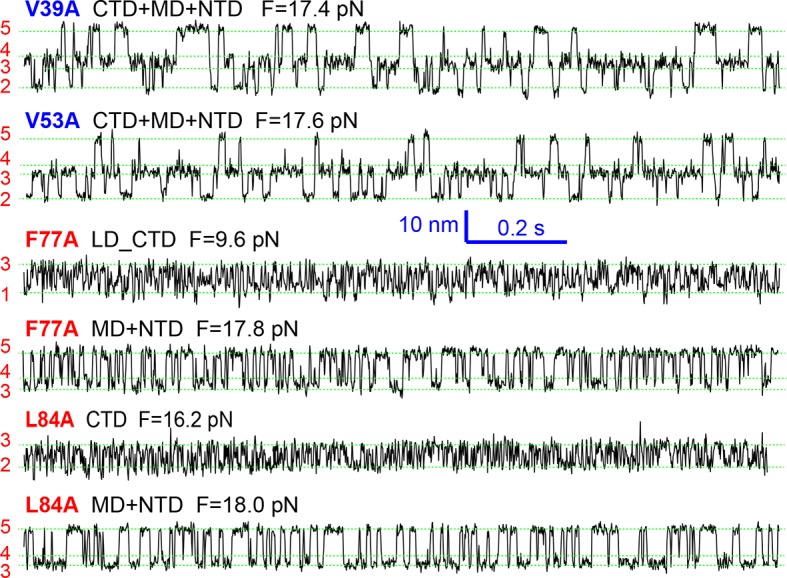
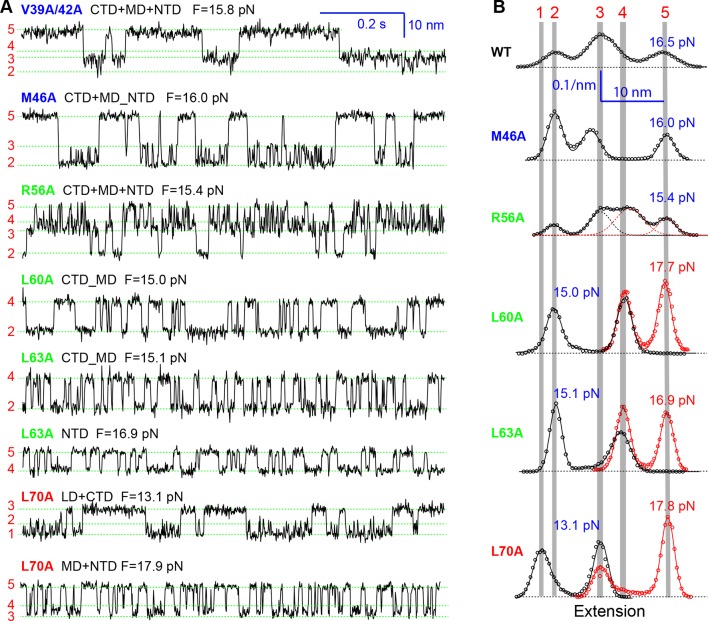
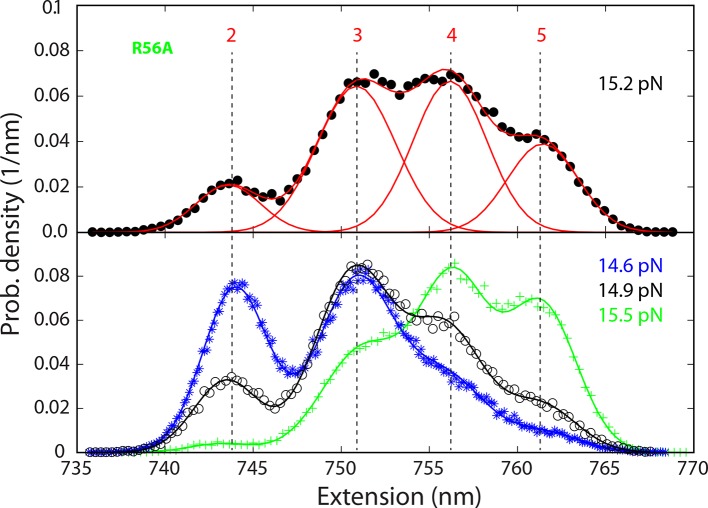
Figure 5. Extension-time trajectories of the mutant SNARE complexes under constant forces showing effects of mutations on the transition kinetics of different SNARE domains.
(A) Extension-time trajectories. The domains involved in the observed transitions and the mean forces (F) are indicated following the colored mutation names in bold (Figure 4—figure supplement 1). Positions of different states are marked by green dashed lines. (B) Probability density distributions of the extensions under the indicated constant forces (symbols) revealing structural changes in the intermediates of SNARE assembly. The distributions could be fitted by 2-4 Gaussian functions (solid lines), and were horizontally shifted to align the peaks corresponding to different states (indicated by the vertical shaded bars).
Figure 5—figure supplement 1. Extension-time trajectories of mutant SNARE complexes showing indicated domain transitions under constant mean forces.


