

Abstract
Mutations in the catalytic subunit of phosphoinositide 3-kinase (PIK3CA) and other PI3K-AKT pathway components have been associated with cancer and a wide spectrum of brain and body overgrowth. In the brain, the phenotypic spectrum of PIK3CA-related segmental overgrowth includes bilateral dysplastic megalencephaly, hemimegalencephaly and focal cortical dysplasia, the most common cause of intractable pediatric epilepsy. We generated mouse models expressing the most common activating Pik3ca mutations (H1047R and E545K) in developing neural progenitors. These accurately recapitulate all the key human pathological features including brain enlargement, cortical malformation, hydrocephalus and epilepsy, with phenotypic severity dependent on the mutant allele and its time of activation. Underlying mechanisms include increased proliferation, cell size and altered white matter. Notably, we demonstrate that acute 1 hr-suppression of PI3K signaling despite the ongoing presence of dysplasia has dramatic anti-epileptic benefit. Thus PI3K inhibitors offer a promising new avenue for effective anti-epileptic therapy for intractable pediatric epilepsy patients.
DOI: http://dx.doi.org/10.7554/eLife.12703.001
Research Organism: Mouse
eLife digest
An enzyme called PI3K is involved in a major signaling pathway that controls cell growth. Mutations in this pathway have devastating consequences. When such mutations happen in adults, they can lead to cancer. Mutations that occur in embryos can cause major developmental birth defects, including abnormally large brains. After birth, these developmental problems can cause intellectual disabilities, autism and epilepsy. Children with this kind of epilepsy often do not respond to currently available seizure medications.
There are several outstanding questions that if answered could help efforts to develop treatments for children with brain growth disorders. Firstly, how do the developmental abnormalities happen? Do the abnormalities themselves cause epilepsy? And can drugs that target this pathway, and are already in clinical trials for cancer, control seizures?
Now, Roy et al. have made mouse models of these human developmental brain disorders and used them to answer these questions. The mice were genetically engineered to have various mutations in the gene that encodes the catalytic subunit of the PI3K enzyme. The mutations were the same as those found in people with brain overgrowth disorders, and were activated only in the developing brain of the mice. These mutations caused enlarged brain size, fluid accumulation in the brain, brain malformations and epilepsy in developing mice – thus mimicking the human birth defects. The severity of these symptoms depended on the specific mutation and when the mutant genes were turned on during development.
Next, Roy et al. studied these mice to see if the seizures could be treated using a drug, that has already been developed for brain cancer. This drug specifically targets and reduces the activity of PI3K. Adult mutant mice with brain malformations were treated for just one hour; this dramatically reduced their seizures. These experiments prove that seizures associated with this kind of brain overgrowth disorder are driven by ongoing abnormal PI3K activity and can be treated even when underlying brain abnormalities persist. Roy et al. suggest that drugs targeting PI3K might help treat seizures in children with these brain overgrowth disorders.
Introduction
The phosphoinositide-3 kinase (PI3K)-AKT pathway is a central player of intracellular signaling, conserved from yeast to mammals. Activating mutations in genes of PI3K-AKT signaling pathway, especially PIK3CA, encoding the catalytic p110α isoform of the PI3K complex, have long been linked to cancer (Cheung and Testa, 2013; Engelman, 2009; Hennessy et al., 2005; Iwabuchi et al., 1995; Samuels and Waldman, 2011; Gymnopoulos et al., 2007). Germline and mosaic mutations of PIK3CA and other pathway genes also cause a wide range of brain and body overgrowth disorders; all anomalies caused by somatic PIK3CA mutations are now collectively termed PIK3CA-Related Overgrowth Spectrum (PROS) (Keppler-Noreuil et al., 2014). The broad spectrum of brain overgrowth disorders caused by PIK3CA activating mutations is impressive. Three strongly activating PIK3CA mutations found most commonly in cancer (hotspot mutations) result in severe segmental cortical dysplasia (SEGCD), which includes bilateral dysplastic megalencephaly (MEG), hemimegalencephaly (HMEG) and focal cortical dysplasia (FCD) types 2a/2b (Lee et al., 2012; D'Gama et al., 2015; Conway et al., 2007; Jansen et al., 2015). Other mutations, resulting in intermediate or weak PIK3CA activation, cause MEG or MEG with polymicrogyria (MEG-PMG) as part of the MEG-capillary malformation syndrome (MCAP) (Conway et al., 2007; Mirzaa et al., 2012; Rivière et al., 2012). Developmental features of these brain disorders include cortical malformations, hydrocephalus, Chiari malformation, intellectual disability, autism and epilepsy (Keppler-Noreuil et al., 2014; Mirzaa et al., 2012). FCD represents one of the most common causes of intractable epilepsy (Bast et al., 2006; Fauser et al., 2015; Fauser, 2006).
Conditional mouse alleles for the H1047R and E545K Pik3ca hotspot mutations have been generated to study tumor formation and assess anti-cancer activities of pathway inhibitors (Kinross et al., 2012; Liu et al., 2011; Meyer et al., 2011; Robinson et al., 2012; Yuan et al., 2013). To understand the cellular mechanisms behind PIK3CA-related brain overgrowth disorders, we used a series of cre-drivers to activate expression of H1047R and E545K alleles in subsets of neural progenitors. Dramatic phenotypes resulted, faithfully modeling the entire spectrum of PIK3CA-associated human brain disorders including enlarged brain size, hydrocephalus, cortical dysplasia and epilepsy. The severity of these brain phenotypes critically depended on the Pik3ca allele and its time of activation. Notably, Pik3ca-associated epilepsy in mice was independent of brain overgrowth and cortical dysplasia. Further the seizures of adult megalencephalic mice were suppressed by acute 1 hr-administration of pan-PI3K inhibitor BKM120 (Maira et al., 2012). We conclude that epilepsy in these models represents an active Pik3ca-driven process that can be restricted by dynamic modulation of PI3K pathway activity in dysmorphic brains. These results raise the exciting prospect of new molecular based epilepsy therapies in patients whose seizures have been intractable to current anti-seizure therapies.
Results
Megalencephaly caused by Pik3ca overactivation is dependent on both the nature of the mutant allele and its time of overactivation
Two conditional Pik3ca activating alleles (H1047R and E545K) were crossed with cre-drivers to overactivate p110α in progressively restricted sets of neural progenitors and their progeny. The broadest distribution was achieved with Nestin-cre, being expressed in nearly all neural progenitors from early embryonic stages. A subset of late embryonic progenitors was targeted by hGFAP-cre; while tamoxifen-inducible Nestin-creER line drove cre-expression in a small subset of neural progenitors around birth. Expression of H1047R was dependent upon a tri-allelic system with tet-inducible mutant human cDNA activated by cre-dependent expression of the tet-activator protein (Liu et al., 2011) (Figure 1—figure supplement 1). The E545K mutation was knocked into the endogenous Pik3ca locus and a lox-stop-lox cassette introduced upstream of the initiation-coding exon, rendering the mutant allele cre-dependent (Robinson et al., 2012). The activity of all cre drivers was confirmed using reporter lines (Figure 1—figure supplement 2).
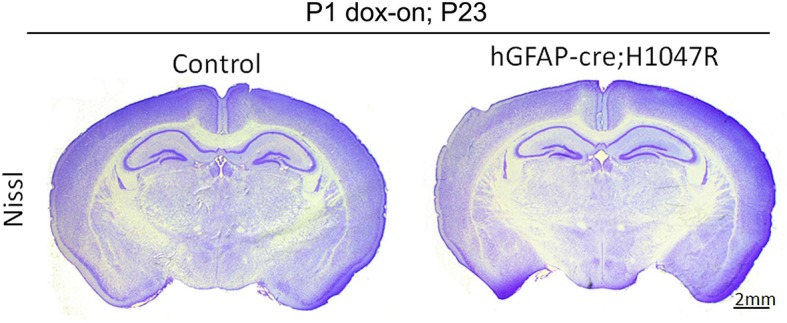
The most severe phenotype was achieved in hGFAP-cre;H1047R mutants, when doxycycline was administered from embryonic day (E)0.5. All mutants exhibited progressive hydrocephalus and died prior to weaning. Hydrocephalus was evident as a domed forehead at postnatal day (P)21 (Figure 1b). Hematoxylin-eosin stained P3 sections showed ventriculomegaly in the megalencephalic H1047R mutant brains. Strikingly the hippocampus was not evident in these mutants. Instead, the medial tissue was highly dysplastic with multiple infoldings along its entire length (Figure 1c,d). In contrast, when pups were treated with doxycycline from P1, no morphological differences were observed between the control and the hGFAP-cre;H1047R mutant (Figure 1—figure supplement 3). Thus the effect of H1047R mutation on brain size was dependent on time of activation.
Figure 1. Embryonic Pik3ca overactivation in mice causes MEG.
(a,b) Compared to control, P21 hGFAP-cre;H1047R mutants had domed foreheads. (c,d) Coronal section of H&E-stained P3 H1047R mutant showed bigger brain and enlarged lateral ventricles compared to control. Mutant neocortex (nctx) was dysplastic and medial tissue highly infolded (arrowhead; d). (e–g) P35 hGFAP-cre;E545K and Nestin-cre;E545K brains were noticeably larger than controls, while Nestin-creER;E545K mutants had normal-sized brains compared to controls. Red color of Nestin-creER;E545K brain is due to presence of a lox-stop-lox-Tomato reporter allele, and shows successful induction of cre activity. Controls for e,f and g are of genotypes Pik3ca E545K, hGFAP-cre, Nestin-cre and Nestin-creER. (h) MRI volumetric analyses of mutant and corresponding control brains. *p<0.0001; ns, not significant. Each data point in the graph represents 1 mouse. (i–l) Nissl-stained coronal sections of representative control and mutant brains. Scale bars: 1 mm (c,d); 2 mm (i-l). See also Figure 1—figure supplements 1–3.

Figure 1—figure supplement 1. Genetic strategy for Pik3ca mouse models.

Figure 1—figure supplement 2. Expression of cre lines.

Figure 1—figure supplement 3. Neonatal activation of H1047R mutation show no effect on brain morphology.
E545K mice with the same cre-driver (hGFAP-cre;E545K) had a milder phenotype, surviving as adults without hydrocephalus, though their brain size was significantly larger compared to control littermates (Figure 1e,h,j). This provides evidence that with identical time of activation by the same cre driver, the brain phenotypes are dependent on specific Pik3ca allele. Earlier activation of E545K mutation with Nestin-cre led to an even more striking 54.4% volumetric increase, with mild ventriculomegaly and no hydrocephalus (Figure 1f,h,k). Interestingly, neonatal activation of E545K using Nestin-creER had no apparent impact on brain size (Figure 1g,h,l). Enlarged head size in both Nestin-cre;E545K and hGFAP-cre;E545K mutants was evident at birth and brain size of all the three adult E545K mutants was relatively stable (data not shown). Unlike H1047R mutants, gross morphology was normal for all E545K mutants. We conclude that brain phenotypes caused by Pik3ca-overactivation are both allele and time dependent. Further, we conclude that to cause brain overgrowth, overactivation of Pik3ca function is required during embryogenesis.
Multiple allele-dependent embryonic mechanisms drive Pik3ca-MEG
To assess the mechanisms causing Pik3ca-dependent embryonic brain enlargement, we focused our analysis on hGFAP-cre;H1047R (doxycycline from E0.5) and Nestin-cre;E545K mutants, since these allelic combinations had the most extreme megalencephalic phenotypes.
The inner cortical length of hGFAP-cre;H1047R mutants was longer than controls at both E14.5 (p<0.01) and E16.5 (p<0.001; Figure 2b–g). This was accompanied by enlarged nuclear and cell size at both ages and decreased cell density at E16.5, but not increased proliferation or cell cycle exit (Figure 3c–l). Total cell number per cortical column length was not significantly different between control and H1047R mutant both at E14.5 and E16.5. Also, TUNEL+ cell number was significantly lower in E16.5 mutant cortex than in control (p<0.01), indicating reduced apoptosis (Figure 3—figure supplement 1a,c); however the overall TUNEL+ cell numbers for both control and mutant were small. Together these results indicate that cortical expansion in hGFAP-cre;H1047R mutant was not primarily driven by increased proliferation or reduced apoptosis; rather reduced cell density and increased cell size during embryogenesis were major contributing factors.
Figure 2. Pik3ca activating mutations lead to increased embryonic cortical length.

(a) Schematic shows how cortical length and thickness were measured. F, fimbria/cortical hem. Nissl-stained coronal sections of control (b,e,h,k) and mutant (c,f,I,l) brains. (b–g) Cortical length of hGFAP-cre;H1047R mutant at E14.5 and E16.5 was longer than control; cortical thickness was not different. (h–m) Cortical length of Nestin-cre;E545K mutant was longer than control at E16.5 but not at E14.5; thickness was not different at E14.5 but was smaller than control at E16.5. Data are represented as mean ± SEM. *p<0.05; **p<0.01; ***p<0.001. Scale bars: 300 μm (b,c,e,f,h,i,k,l).
Figure 3. H1047R and E545K mutations differentially affect proliferation, cell density and size in neocortex.
(a) Schematic shows area of interest (red box) in E16.5 mouse coronal section, as depicted in c,d,k,m,n,u. (b) Experimental outline of the proliferation and cell cycle exit assays. For labeling index, E14.5 and E16.5 control and mutant brains, harvested after a 1hr BrdU pulse, were processed for BrdU and DAPI staining (c,m). For quit fraction analysis, E16.5 control and mutant brains, pulsed with BrdU at E15.5, were processed for BrdU and Ki67 (k,u). Magnified view of DAPI-stained cortical nuclei shows differences in size and density between controls and mutants (d,n). (e-j,l) E14.5 and E16.5 H1047R mutants had similar labeling indices (BrdU+ cells/total DAPI+ cells); E16.5 H1047R mutant neocortex displayed reduced cell density (x105 DAPI+ cells/mm3 volume), larger nuclear and cell size (μm2) and similar quit fraction (BrdU+Ki67- cells/total BrdU+ cells). (o-q) E14.5 E545K mutant neocortex was similar to control in labeling index, cell density and nuclear size. (r-t,v) E16.5 E545K mutant showed significantly higher labeling index and quit fraction, reduced cell density, and enlarged cell and nuclear size, compared to controls. Data are represented as mean ± SEM (e,f,h,i,I,o,p,r,s,v) or as median-centered box-and-whisker plots (g,j,q,t); *p<0.05; **p<0.001; ***p<0.0001. Scale bars: 50 μm (c,d,m,n); 100 μm (k,u). See also Figure 3—figure supplements 1–2.

Figure 3—figure supplement 1. Effect of PIK3CA mutations on total cell numbers and apoptosis.

Figure 3—figure supplement 2. E545K mutation affects cell size when activated embryonically but not postnatally.

By contrast, in Nestin-cre;E545K mutants, the inner cortical length was comparable to controls at E14.5 but elongated at E16.5 (p<0.01); cortical thickness was slightly reduced in E16.5 (p<0.05) as compared to controls (Figure 2h–m). The labeling index was similar to the control at E14.5 but increased in E16.5 mutants (p<0.05), indicating more proliferation (Figure 3m,o,r). Cell density in E545K mutant neocortex was similar to the control at E14.5 but was reduced at E16.5 (p<0.05). Total cells per cortical column length did not change in the E545K mutant; but the TUNEL+ cell number was lower in E16.5 mutant cortex than in control (p<0.001). Intriguingly, the nuclear size of these mutant cells was similar to controls at both E14.5 and E16.5 but cell somas were significantly larger (p<0.05) at E16.5 (Figure 3n,p,q,s,t). The quit fraction indicative of rate of cells exiting cell cycle was significantly higher (p<0.05) in the E545K mutant between E15.5 and E16.5 (Figure 3u,v). At P35, the neocortical cells of Nestin-cre;E545K mutant were still larger (p<0.05) compared to controls (Figure 3—figure supplement 2a,b). Notably, in the adult P35 Nestin-creER;E545K mutant mice, where activation was initiated in neonates, and brain size was not different from controls, E545K-activated (YFP+) cells have the same size as controls (Figure 3—figure supplement 2c,d). We conclude that increased cell size due to E545K overactivation also has a critical embryonic period. Further, changes in multiple developmental parameters including proliferation, cell cycle exit, cell size and density contribute to MEG of Nestin-cre;E545K Pik3ca embryonic overactivation.
Embryonic Pik3ca activation results in cortical dysplasia
Since disordered lamination is a key feature of human SEGCD (Arai et al., 2012; Rossini et al., 2014), we assessed neocortical organization and development in both hGFAP-cre;H1047R and Nestin-cre;E545K mutants. First, we studied the effect of Pik3ca overactivation on the Nestin-positive radial glial fibers, the scaffold for glial-guided neuronal migration, at multiple developmental stages. In H1047R mutants, the radial glial scaffold was slightly fasciculated and irregular at E14.5 and E16.5. Irregularities were very prominent at P0 when a disrupted pial surface was associated with irregular clusters of enlarged radial glial end-feet (Figure 4—figure supplement 1). The radial glial phenotype was much more subtle in the E545K mutant at E14.5 and E16.5; however at P0, we observed thinning of radial glial fibers and irregular clusters of end-feet at the intact pial surface (Figure 5—figure supplement 1).
Cajal-Retzius cells expressing Reelin, a major regulator of radial migration, were normally present in an ordered array in the marginal zone (layer I) of controls and Nestin-cre;E545K mice (Figure 4b; Figure 5b,c). However, these cells were dysplastic in hGFAP-cre;H1047R mice at E16.5 (Figure 4c,c’). We did not observe ectopic Reelin-positive cells within the cortical column in either mutant. As expected, within the developing wildtype neocortex, Ctip2 and Tbr1 were expressed predominantly in the early-born, deep layers (layers V-VI), while Cux1 was expressed in late-born upper layers (layers II-IV). hGFAP-cre;H1047R mutants displayed a marked disorganization of all layers. Ctip2/Tbr1-positive as well as Cux1-positive cells in the E16.5 H1047R mutant were dispersed throughout the cortical plate, with both early- and late-born neurons severely mislocalized (Figure 4d–g). Laminar disorganization was less severe in E16.5 Nestin-cre;E545K brains, but deep Ctip2/Tbr1-positive neurons and upper Cux1-positive neurons were dispersed throughout the cortical plate (Figure 5f,g).
Figure 4. H1047R mutant mice display abnormal neocortical layering.
(a) Schematics of mouse brain and section; section corresponds to the marked coronal plane; red box in the section marks the area of neocortex (nctx) depicted in the images below. (b–g) and (h–m) correspond to ages E16.5 and P3 respectively. In control cortex, Reelin is in layer I (b), Ctip2 and Tbr1 in deep layers VI and V (d,j), Cux1 in upper layers II-IV (f,l) and NeuN in all matured neurons (h). H1047R mutants displayed abnormal distribution of cells for all neocortical layers, observed at E16.5 and P3 (c,e,g,i,k,m). (b’,c’) Magnified view of Reelin-positive cells in control and H1047R mutant. P3 H1047R mutant showed enlarged area between ventricular zone (vz) and cortical plate and absence of clear subplate (sp) boundary (h-k). A, anterior; P, posterior; yellow dashed lines, lateral ventricular lining; white dotted lines, pial surface; I-VI, neocortical layers; arrowheads, mispositioned mutant cells. Scale bars: 25 μm (b’,c’), 50 μm (b-i), 150 μm (j-o). See also Figure 4—figure supplements 1–2.

Figure 4—figure supplement 1. Nestin expression in hGFAP-cre; H1047R mutant.
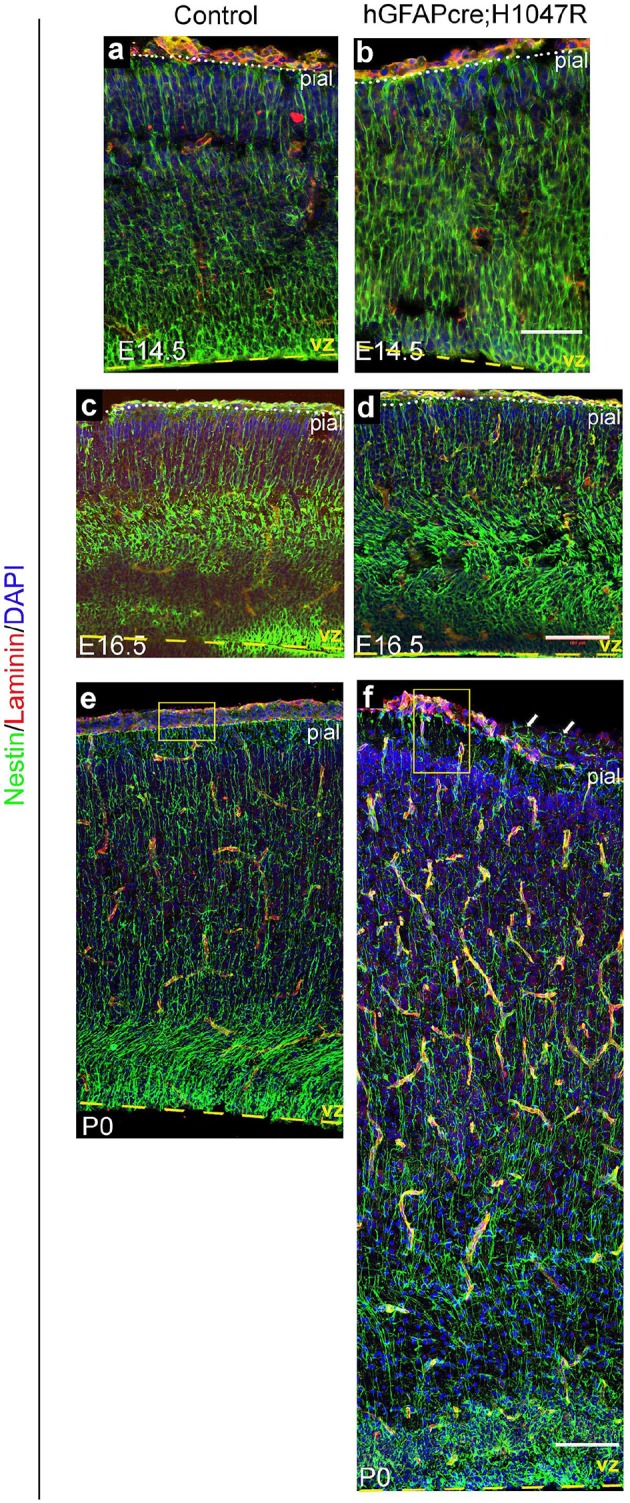
Figure 4—figure supplement 2. hGFAP-cre;H1047R mutant displays distinct white matter dysplasia.

Figure 5. E545K mutant mice display abnormal neocortical upper layers.
(a) Schematics of mouse brain and section; section corresponds to the marked coronal plane; red box marks the area of neocortex (nctx) depicted in the images below. (b-g) and (h-m) correspond to ages E16.5 and P35 respectively. (b-g) Compared to control, in E16.5 E545K mutant, layer I appeared normal; deep layers lacked normal arrangement while Cux1-positive cells were dispersed throughout the cortical plate. Extent of dispersion was reduced postnatally (h-m). vz, ventricular zone; yellow dashed lines, lateral ventricular lining; white dotted lines, pial surface; I-VI, neocortical layers; arrowheads, mispositioned mutant cells. Scale bars: 50 μm (b-g), 150 μm (h-m). See also Figure 5—figure supplements 1–3.

Figure 5—figure supplement 1. : Nestin expression in Nestin-cre;E545K mutant.

Figure 5—figure supplement 2. Nestin-cre;E545K mutant displays distinct white matter dysplasia.

Figure 5—figure supplement 3. Astrocytes show no gross dysmorphology in adult Nestin-cre;E545K and Nestin-creER;E545K mutants.

Laminar patterns in postnatal animals remained disrupted in both mutants, with hGFAP-cre;H1047R cortex more affected Nestin-cre;E545K mutant cortex (Figure 5h–m). Thus a simple developmental delay was not the cause of dysplasia (Figure 4h–m; Figure 5h–m). In P3 hGFAP-cre;H1047R mutants, NeuN-positive mature cortical neurons were found within the normally cell-sparse marginal zone as well as in the cortical white matter and residual ventricular zone, a feature reported in SEGCD patients (Arai et al., 2012). Further, the cortical subplate was not readily discernible in these mutants (Figure 4h–k; Figure 4—figure supplement 2e,f), blurring the boundary between grey and white matter – a feature often observed in SEGCD patients (Rossini et al., 2014).
To determine whether the mislocalization of neocortical cells was due to defects in cell fate specification and/or migration, we labeled cells at either E12.5 or at E16.5 with pulse of BrdU and assessed cortical neuronal location and fate (layer V; Ctip2+ and layers II/III; Cux1+) (Figure 6a). The total numbers of BrdU+ P0 cells, born at E12.5 and E16.5, were not significantly different between controls and either hGFAP-cre;H1047R or Nestin-cre;E545K mutants (Figure 6b,j). The distribution of BrdU+ cells showed significant differences between controls and H1047R mutants labelled during both early and late embryonic stages. At P0, more BrdU+ cells were localized in the lower cortical plate (CP) and white matter (Figure 6c). For E545K mutants the BrdU+ cell numbers were not different at either age. The distribution was subtly, yet significantly different only for the early born neurons (Figure 6k). For both the H1047R and E545K Pik3ca activating alleles, total layer V (Ctip2+) cell numbers at P0 were not significantly different between controls and mutants (Figure 6d,l). Also, the numbers of Ctip2/BrdU double-labeled cells were the same in controls and mutants, indicating that cell fate specification for these deep layer neurons was unaffected by either the H1047R or E545K Pik3ca allele (Figure 6e,m). However, similar to the overall BrdU+ cell distribution, the specific distribution of layer V neurons was abnormal in H1047R mutants, with ectopic Ctip2/BrdU double-labeled cells in the upper and lower CP and white matter, instead of mid CP (Figure 6f). In E545K mutants, fewer Ctip2+ cells were positioned in the mid CP (Figure 6n), although the phenotype was much less severe.
Figure 6. Birthdating assays demonstrate defects in laminar distribution.

(a) Experimental outline of birthdating assays: BrdU was injected at E12.5 and E16.5 and analyzed at P0 (B12.5;P0 and B16.5;P0). Total number of BrdU+ cells at P0 generated at E12.5 and E16.5 (b,j), and total number of Ctip2+ cells (layer V neurons; d,l) were not significantly different between respective controls and mutants, for both H1047R and E545K lines. (c) Distribution of BrdU+ cells in the neocortex was significantly different between control and hGFAP-cre;H1047R mutant for both early and late assays, with more cells residing in the lower cortical plate and white matter instead of mid and upper zones of the cortical plate. (e,m) Total number of layer V neurons in both H1047R and E545K mutants, born at E12.5 and at E16.5, did not significantly differ from the respective controls; but showed significant difference in their zonal distribution with Ctip2+BrdU+ cells predominating the lower cortical plate in both the mutants (f,n). Total number of Cux1+ neurons (layers II/III neurons; g,o) was significantly higher in both the mutants compared with the respective controls. The colocalization of Cux1 and BrdU was not significantly different in the H1047R mutant and control for both ages (h); but number of Cux1+ cells born at E16.5 was significantly higher in E545K mutant than in the control (p). (i,q) Zonal distribution of Cux1+ cells was significantly different between controls and mutants, with more Cux1+ cells residing at the lower portion of the P0 cortical plate. The H1047R mutant phenotype is more extreme than the E545K mutant. Data are represented as mean ± SEM. *p<0.05; **p<0.001; ***p<0.0001.
Upper layer (Cux1+) neuronal numbers and distributions were significantly different in both H1047R and E545K mutants, compared to their respective controls (Figure 6g,o). In E545K mutants, the increase in total Cux1+ cell numbers in the E545K mutant corresponded to increased Cux1/BrdU double-labeled cells, born at E16.5 (Figure 6p). However, no such correlation was observed in E12.5 or E16.5-born Cux1+ cells in the H1047R mutant (Figure 6h). These extra cells were therefore likely born between E16.5 and P0. The distribution of Cux1+ cells was disrupted in both mutants, with the H1047R mutant displaying the more severe phenotype (Figure 6i,q). Together, these data indicate that cell fates are largely correctly specified in both Pik3ca mutants and that cortical dysplasia is more likely caused by aberrant neuronal migration.
Pik3ca mutations cause white matter dysplasia
In P3 hGFAP-cre;H1047R mutants, although the cortical plate itself was not dramatically thicker than controls, the underlying cortical white matter was much thicker (Figure 4j,k; Figure 4—figure suplement 2e,f). This was less pronounced but readily discernible in P3 Nestin-cre;E545K mutants (Figure 5—figure supplement 2c,d). In P3 H1047R mutants, there was complete absence of corpus callosum, although hippocampal and anterior commissures were present (Figure 4—figure supplement 1a-d). In contrast, all major tracts were present in P3 E545K mutants (Figure 5—figure supplement 2). These data are consistent with the wide spectrum of white matter dysplasia reported in MEG and SEGCD patients (Conway et al., 2007; Adamsbaum et al., 1998; De Rosa et al., 1992; Jansen et al., 2015). Moreover, increased number of Olig2-positive cells was observed in the white matter area of both H1047R and E545K mutants (Figure 4—figure supplement 2, Figure 5—figure supplement 2). Although astrocytosis is observed when mTOR signaling is activated by TSC mutations in humans and mice (Sosunov et al., 2008; Zeng et al., 2008), it is not a feature of PIK3CA-pathology in our mouse models (Figure 5—figure supplement 3a-d).
Both megalecephalic and normocephalic E545K mutant mice are epileptic
Epilepsy is one of the most important clinical features of SEGCD (Bast et al., 2006; Fauser et al., 2015; Fauser, 2006; Arai et al., 2012). Since most of the H1047R mutants were not viable post-weaning, we assessed Nestin-cre;E545K (megalencephalic) and Nestin-creER;E545K (normocephalic) adults for epilepsy phenotypes. Baseline sleep EEG recordings in both animal models revealed epileptiform activity including sets of spikes/polyspikes, and regional and generalized spike and wave discharges during non-rapid eye movement (NREM) sleep (Figure 7b,c). We also conducted additional 2 hr of continuous EEG recording immediately after 5 hr of total sleep deprivation of the Nestin-creER;E545K mice. Sleep deprivation is commonly implemented during epilepsy diagnostic studies in mice and humans and increases the sensitivity and specificity of EEG diagnosis for epilepsy (De Rosa et al., 1992; Giorgi et al., 2013; Binnie and Prior, 1994; Kalume et al., 2015). The frequency of epileptiform interictal activity was increased in post sleep deprivation EEG recordings, and clinically relevant spontaneous seizures including myoclonic (MC) seizures, frequent isolated spikes, and train of spikes, were observed in the Nestin-creER;E545K mice (Figure 7d,e).
Figure 7. PI3K activity acutely modulates epileptic seizures.
(a) Schematic shows electrode placement for EEG recordings. LF=Left Frontal, LP= Left Posterior, RF=Right Frontal, RP= Right Posterior. Only 2 electrodes were placed in P35 Nestin-cre;E545K. (b) EEG-EMG tracings of Nestin-cre;E545K mutant showed bilateral spikes/polyspikes, myoclonic (MC) seizures, fast and slow wave discharges, not associated with movement on video or EMG activity. (c) Generalized (G) and regional (R) spike and wave discharges were observed in Nestin-creER;E545K mice. Scale: 1s,1mV. (d,e) Sleep deprivation (SD) enhances epileptiform EEG activity in Nestin-creER;E545K mutant. EEG tracings of a Nestin-creER;E545K mutant mouse after 5 hr of normal sleep (Pre SD) and after 5 hr of total sleep deprivation (Post SD) in the same mouse (d), the mutant showing myoclonic (MC) seizures and isolated regional spikes (R). Power spectrum analysis, representing the frequency distribution for EEG activity over time, also displayed increased activity of the mutant post SD (e). (f) Bar chart showing average number of seizures (SZ) in PTZ-induced P35 Nestin-cre;E545K and control over time. (g) Experimental outline for BKM120-PTZ test. (h) Total number of seizures was significantly higher in P35 mutants than controls. Acute administration of BKM120 reduced number of seizures in mutants. (i) Duration of sustained generalized tonic-clonic seizure state (Racine 5), normalized to the total time of test, was significantly longer in P35 Nestin-cre;E545K mutants than controls. BKM120 significantly reduced the duration. Data are represented as mean ± SEM. *p<0.05; **p<0.0001. See also Figure 7—figure supplement 1.

Figure 7—figure supplement 1. Seizure activity of E545K mutants at old age.

When challenged with the chemoconvulsant pentylenetetrazol (PTZ), a GABA-A receptor antagonist (Macdonald and Barker, 1978), both the megalencephalic and normocephalic E545K mouse models exhibited lower seizure thresholds compared to controls at both P35 and P180 (Figure 7f–i; Figure 7—figure supplement 1d). In the 30 min post PTZ injection, both models showed shorter latencies to first generalized tonic clonic (GTC) seizures, more myoclonic seizures, and a prolonged seizure load.
We conclude that Pik3ca overactivation is sufficient to cause epilepsy. Further our data indicate that Pik3ca-related epilepsy is dissociable from brain overgrowth and cortical dysplasia.
Acute inhibition of Pik3ca activity suppresses epilepsy, rapidly altering cell signaling
BKM120, a 2,6-dimorpholino pyrimidine derivative, is an orally available pan-Class I PI3K inhibitor currently in clinical trials for solid tumors (Maira et al., 2012; Bendell et al., 2012; Brachmann et al., 2012) and may represent a novel therapeutic agent for PIK3CA-related epilepsy. Preclinical studies show that BKM120 maximally inhibits downstream phosphorylation of Akt, 1hr post-administration (Maira et al., 2012). To test its anti-seizure effects in our adult Pik3caE545K gain-of-function megalencephalic and normocephalic models, we administered 50 mg/kg BKM120 (Maira et al., 2012) by oral gavage 1hr prior to PTZ-challenge at ~P35. BKM120 increased the seizure threshold of control animals. More importantly, despite the presence of megalencephaly and considerable cortical dysplasia in P35 Nestin-cre;E545K megencephalic animals, BKM120 dramatically decreased the seizure number and duration to untreated control levels and marginally increased seizure latency in the mutant mice (Figure 7h,i; Figure 7—figure supplement 1d). These data powerfully demonstrate that dynamic Pik3ca-dependent processes, independent of cortical and cellular dysplasia, cause Pik3ca-related epilepsy and they are highly amenable to therapeutic intervention.
To begin to dissect the cell signaling mechanisms underlying Pik3ca-driven epilepsy, we conducted reverse phase protein array (RPPA) analysis to measure protein levels of a comprehensive panel of cell signaling molecules (Tibes et al., 2006). We assessed subdissected cortical and hippocampal tissue from untreated (-) and PTZ, BKM120 and BKM120 PTZ treated adult control and Nestin-cre;E545K mutants (Figure 8, Figure 8—figure supplement 1). As expected, untreated Nestin-cre;E545K mutants exhibited significant elevations of phospho (p)S473-Akt and pT346-NDRG1, consistent with PI3K pathway activation. Notably, baseline pS473-Akt levels in the Nestin-cre;E545K hippocampus were prominently higher than the cortical levels. In both E545K mutant and control brain tissues, PTZ treatment alone increased the levels of pAkt, especially pS473-Akt, of pS6 (pS235/S236, pS240/244), pT346-NDRG1 and pS2448-mTOR. As expected, acute BKM120 treatment alone reduced phosphorylation of multiple PI3K pathway members, including AKT, S6, NDRG1, GSK3 and 4EBP1. Most remarkably, BKM120 also inhibited the increased phosphorylation levels induced by PTZ, notably returning mutant hippocampal pS473-AKT levels to baseline untreated control levels.
Figure 8. BKM120 acutely alter PI3K pathway protein profile.
(a–g) Graphs show differential protein levels in P35 Nestin-cre;E545K mutant and control brains due to different treatments: untreated (-); BKM120; PTZ; BKM120+PTZ. Data are represented as mean ± SEM. *p<0.05. Inset shows simplified PI3K pathway; BKM120 significantly regulated the highlighted molecules. See also Figure 8—figure supplement 1.

Figure 8—figure supplement 1. RPPA analysis graphs.

Discussion
PIK3CA-related disorders (PROS) in humans
Activating PIK3CA mutations have been associated with many human overgrowth disorders categorized based on severity and distribution of the mutation. Involvement of multiple tissues results in CLOVES or Klippel-Trenaunay syndrome with highly mosaic mutation levels (0.8–32%) in affected tissues (Luks et al., 2015; Kurek et al., 2012). Involvement of single tissue or body segment results in epidermal nevi, lymphatic malformations or other localized phenotypes with usually no mutations detected in unaffected tissues (Keppler-Noreuil et al., 2014; Luks et al., 2015; Kurek et al., 2012; Osborn et al., 2015; Groesser et al., 2012; Lindhurst et al., 2012; Hafner et al., 2007; Rios et al., 2013; Cohen et al., 2014). Too few patients and insufficient quantitative data have been reported to observe allele-specific differences.
In the brain, mosaic hotspot mutations result in SEGCD, classified as dysplastic MEG, HMEG or FCD2a based on extent of lesion (Jansen et al., 2015). PIK3CA mutations were detected in 9/73 patients with HMEG and 1/33 with FCD2 (Lee et al., 2012; D'Gama et al., 2015; Jansen et al., 2015). These overlapping SEGCD are associated with severe and usually intractable epilepsy (Bast et al., 2006; Fauser et al., 2015; Fauser, 2006; Pasquier et al., 2002; Russo et al., 2003; Tassi, 2002; Devlin, 2003; Blümcke et al., 2011). ~20 other PIK3CA mutant alleles have been seen in MCAP, characterized by MEG or MEG-PMG, hydrocephalus and less severe epilepsy (Gymnopoulos et al., 2007; Mirzaa et al., 2012; Rivière et al., 2012; Tatton-Brown and Weksberg, 2013).
We activated the two most common hotspot mutations, E545K and H1047R, in mouse brain at different developmental timepoints to generate the first models of human PIK3CA-related SEGCD. Our mouse models faithfully recapitulated the most important PIK3CA-related phenotypes of MEG, hydrocephalus, cortical and white matter dysplasia, and epilepsy (Table 1).
Table 1.
Table displays comparison of the key features across different Pik3ca genetic models used in this study.
|
Mutant allele |
H1047R |
E545K |
|||
|
Cre driver |
hGFAP-cre(dox from E0.5) |
hGFAP-cre(dox from P1) |
Nestin-cre |
hGFAP-cre |
Nestin-creERT2(tamoxifen @P0/P1) |
|
GoF expression onset |
Late embryonic |
Neonatal |
Early embryonic |
Late embryonic |
Neonatal |
|
Viability |
Lethal by weaning age |
Viable |
Viable |
Viable |
Viable |
|
Megalencephaly |
✓ |
X |
✓ |
✓ (intermediate) |
X |
|
Hydrocephalus |
✓ | X |
X |
X |
X |
|
Increased cell size |
✓ |
Not tested |
✓ | X |
X |
|
Cortical dysplasia |
✓ |
X |
✓ | X |
X |
|
White matter dysplasia |
✓ |
X |
✓ | ✓ (data not shown) |
X |
|
Epilepsy |
Not tested |
Not tested |
✓ | Not tested |
✓ |
Differential activating mechanisms underlie Pik3ca allele-specific brain phenotypes
Data from cancer biology suggests that H1047R mutation is more severe than E545K mutation. For example, E545K mutation accounts for 1932/7548 (26%) and H1047R for 2898/7548 (38%) of PIK3CA-coding mutations detected in the COSMIC database of cancer mutations (http://cancer.sanger.ac.uk/cancergenome/projects/cosmic).
We found that H1047R and E545K mutations caused distinct phenotypes in mice, H1047R being more severe than E545K. hGFAP-cre;H1047R mutants had severe hydrocephalus and died pre-weaning. In contrast all mice with the E545K allele survived through adulthood without hydrocephalus. Developmental analyses of hGFAP-cre;H1047R and Nestin-cre;E545K embryos revealed common mechanisms, such as larger neurons and lower cell densities, contributing to enlarged brain size, with differences more significant in H1047R mutants. E545K mutation also elevated cortical proliferation and cell cycle exit during late neurogenesis. We do not believe that overexpression of the transgenic H1047R allele versus the knock-in design of the E545K allele underlies the phenotypic differences. The PI3K enzyme is made of p110 (encoded by Pik3ca) and p85 subunits. p110 stability is entirely dependent on levels of p85 (Geering et al., 2007; Fruman et al., 2000; Yu et al., 1998) and we have not altered p85. Rather, the phenotypic differences more likely reflect distinct allele-specific overactivation of PI3K signaling. The H1047R mutation increases the level and duration of response to extracellular ligand, while E545K alters the helical domain resulting in constitutive low level signaling with a blunted response to extracellular ligands (Miled et al., 2007; Zhao and Vogt, 2008).
These differences likely reflect distinct mechanisms differentially altering PI3K signaling. Whereas H1047R mutation increases the level and duration of response to extracellular ligand, E545K alters the helical domain resulting in constitutive low level signaling with a blunted response to extracellular ligands (Miled et al., 2007; Zhao and Vogt, 2008).
Effect of Pik3ca overactivation on brain and cell size is temporally regulated
By activating the E545K mutation in progressively limited progenitor pools, we decreased the size of brain and cells in a graduated fashion. Postnatal E545K activation had no impact on cell/brain size. We conclude that the PIK3CA-related brain overgrowth must arise from mosaic mutations in embryonic neural progenitors.
Although neuronal size was enlarged in both hGFAP-cre;H1047R and Nestin-cre;E545K mutants, it was less than that observed in Pten null mice or in cultured hippocampal neurons constitutively overexpressing Akt (Kumar, 2005; Kwon et al., 2001). Multiple models of Pten deletion cause progressive increases in postnatal neuronal size and increased brain size without continued proliferation (Kwon et al., 2001; Fraser, 2004; Fraser et al., 2008; Backman et al., 2001). Our Nestin-cre;E545K mutants had enlarged brain size evident at birth, without progressive increases in postnatal cell size. This is congruent with the analysis of resected human brain tissue from SEGCD patients. Mild cellular enlargement was observed with PIK3CA mutations in contrast to marked enlargement with PTEN or AKT3 mutations (Jansen et al., 2015).
Aberrant neuronal migration is a major contributor to Pik3ca-related cortical dysplasia
Brains of SEGCD patients show mild to moderate migration defects in early-born cortical neurons and more severe defects in late-born neurons (Arai et al., 2012; Rossini et al., 2014). Similarly, embryonic activation of H1047R and E545K in mice caused abnormal neocortical lamination, with late-migrating Cux1-positive neurons severely affected in both the mutants. Birthdating studies support the conclusion that Pik3ca activation does not alter cell fate and that cortical dysplasia is predominantly a result of aberrant migration. The severity of dyslamination in H1047R mutants likely reflects the dysplastic Reelin-positive Cajal-Retzius cells. However the Reelin-positive layer remained well defined in both mutants. This is in contrast to the ectopic Reelin expression in neurons expressing high levels of overactive pAKT introduced by electroporation into embryonic mouse cortex (Baek et al., 2015). In human SEGCD, late migrating neurons often fail to migrate to the upper layers (Arai et al., 2012), a phenotype more severe than seen in any of our mouse models. However, NeuN immunohistochemistry in H1047R mutants confirmed the presence of ectopic neurons in the subcortical white matter, as seen in human SEGCD brain (Arai et al., 2012; Salamon, 2006). Human MEG is associated with a wide range of white matter dysplasia ranging from agenesis of corpus callosum to thickening of subcortical axon bundles (Conway et al., 2007; Adamsbaum et al., 1998; De Rosa et al., 1992; Jansen et al., 2015; Salamon, 2006). These features were also faithfully recapitulated in our mouse models.
Pik3ca-related epilepsy is an active Pik3ca-dependent process dissociable from dysmorphology
Both adult megalencephaic Nestin-cre;E545K and normocephalic Nestin-creER;E545K mice exhibited spontaneous seizures as well as lowered seizure thresholds upon PTZ-seizure induction. Although cortical dysplasia resulted from embryonic activation of Pik3ca in Nestin-cre;E545K mice, postnatal activation of Nestin-creER;E545K did not cause increased cell size or megalencephaly or altered cortical lamination. Thus Pik3ca-dependent epilepsy is independent of dysmorphology. Further, inhibitory interneurons were not grossly perturbed in Nestin-creER;E545K mice (data not shown). This is congruent with the fact that these interneurons are born at embryonic stages and their migration is almost complete before birth (Batista‐Brito and Fishell, 2009). Therefore altered interneuron development in Nestin-cre;E545K may contribute to epilepsy, aberrant interneuron development cannot represent a common mechanism for epilepsy in both models. The observation that acute BKM120 treatment is sufficient to inhibit PTZ-induced seizures even in adult megalencephalic mice supports the argument that the epileptic seizures are independent of dysplasia since the latter is not reversed over the short course of treatment. This is an important finding since a large portion of FCD patients who do not show detectable dysplasia suffer from intractable epilepsy (Bernasconi et al., 2011).
Proteomic analyses of cell signaling networks in megalencephalic cortical and hippocampal tissue at baseline and treated with PTZ and/or BKM120 provide insight into the mechanism of Pik3ca-dependent epilepsy. Nestin-cre;E545K mutants had elevated PI3K signaling with a more robust upregulation of mTOR-dependent pS473-Akt than the direct PDK1-dependent pT308-Akt, similar to the recent findings in human brain samples with PIK3CA mutations (Jansen et al., 2015). The modest changes in signaling compared to controls is congruent with previous studies which demonstrated only modest changes in the steady-state levels of PI3K signaling in breast cancer cells with PIK3CA mutations (Stemke-Hale et al., 2008). Higher signaling levels in hippocampus versus cortex suggest a more prominent role of hippocampus in the seizure phenotype. PTZ administration alone in both controls and megalencephalic Nestin-cre;E545K mutants caused upregulation of many core components of PI3K-AKT pathway, including pAkt, pS6 and pNDRG1. This is congruent with a report showing PTZ-induced seizures in rats upregulated PI3K-AKT-mTOR pathway (Zhang and Wong, 2012) and suggests that elevated baseline PI3K signaling levels are epileptogenic.
Indeed, there is extensive human and mouse evidence that elevated mTOR signaling is epileptogenic although the mechanisms for the epilepsy are incompletely understood. A number of mechanisms including altered development, cell size, growth, proliferation and circuitry have been reported (Wong and Crino, 2012). Most remarkably however, our acute BKM120 administration data clearly demonstrates that histopathological mechanisms are not the primary epilepsy drivers. Acute 1 hr of BKM120 administration was sufficient to completely inhibit the increased phosphorylation levels induced by PTZ, notably returning mutant hippocampal mTOR-dependent pS473-AKT levels to baseline untreated control levels. This was sufficient to normalize the PTZ-seizure induction threshold, despite continued dysplasia in Nestin-cre;E545K mutants. We conclude that elevated PI3K signaling is itself actively epileptogenic, independent of underlying developmental pathology.
Changing the face of intractable pediatric epilepsy
The discovery that Pik3ca-related epilepsy is independent of dysplasia and susceptible to acute modulation is a major and paradigm shifting finding. Since PIK3CA resides at the top of the PI3K-AKT pathway, our mouse models represent surrogates for the entire group of patients with segmental brain overgrowth, including patients with somatic mosaic mTOR and AKT3 mutations (Keppler-Noreuil et al., 2014; Lee et al., 2012; D'Gama et al., 2015; Conway et al., 2007; Jansen et al., 2015; Mirzaa et al., 2012). SEGCD is associated with early onset, severe and frequently intractable epilepsy that responds poorly to standard seizure medications (Bast et al., 2006; Fauser et al., 2015; Fauser, 2006; Pasquier et al., 2002; Russo et al., 2003; Tassi, 2002). Epilepsy surgery has been comparatively more successful (73%) in combating seizures in the same children (Fauser et al., 2015). A drug-based therapy however, would clearly be preferable. mTOR inhibition with rapamycin has shown therapeutic promise in FCD patients and animals models (Baek et al., 2015; Curatolo and Moavero, 2013; Lim et al., 2015; Moon et al., 2015); however, rapamycin treatments are not acute. Our data demonstrates that acute small molecule-based modulation of PI3K signaling, despite the presence of dysplasia, has dramatic therapeutic benefit. This suggests that PI3K inhibitors offer a promising new avenue for effective antiepileptic therapy for large cohorts intractable pediatric epilepsy patients.
Materials and methods
Mice
The following mouse lines were used: Nestin-cre (Jackson Labs, Bar Harbor, Maine, USA; Stock #003771), Nestin-creERT2 lines (Jackson Laboratory, Bar Harbor, Maine, USA, MGI:3641212 and line generated in SJB’s lab, Zhu et al., 2012), human glial fibrillary acidic protein (hGFAP)-cre (Jackson Labs, Stock #004600), Pik3caH1047R transgenic (human H1047R transgene expression is under the control of a tetracycline-inducible promoter (TetO)) (Liu et al., 2011), Rosa26-rtTA line (Jackson Labs, Stock #005670), Pik3caE545K knock-in (Robinson et al., 2012), Ai-9 (Jackson Labs, Stock #007905), Ai-14 (Jackson Labs, Stock #007914), R26-LSL-EYFP (Jackson Labs, Stock #006148), Rosa26-LacZ (Jackson Labs, Stock #003474). We have designated the Pik3caH1047R and Pik3caE545K conditional mutant mice as H1047R and E545K mutants/lines throughout the manuscript.
All lines were maintained on a mixed genetic background, comprising of FVB, C57Bl6, 129 and CD1 strains. Noon of the day of vaginal plug was designated as embryonic day 0.5 (E0.5). The day of birth was designated as postnatal day 0 (P0). The H1047R and Rosa26-rtTA lines were intercrossed and female mice positive for both these alleles were crossed with hGFAP-cre;RosartTA;Pik3caH1047R males. To ensure that cre and Pik3caH1047R mutant transgene expression was correlated plugged females were treated with doxycycline (Sigma; 2 mg/ml) from E0.5 available ad libitum in drinking water. For the neonatal induction experiment, the pups were treated with doxycycline from P1. The E545K line was crossed to reporter lines to obtain E545K floxed allele and the reporter in the same mouse line. Tamoxifen (Sigma T5648) was dissolved at 37°C in corn oil (Sigma) at 5 mg/ml and was administered intraperitoneally to pups of the cross Nestin-creER X Pik3caE545K mice at a dose of 75 μg/g body weight, once a day at P0 and P1, to activate the E545K mutation postnatally. hGFAP–cre, Nestin–cre and Nestin–creERT2 mice were genotyped by PCR using primers for the cre coding region, as previously described (Chizhikov, 2006). Genotyping of other alleles were done according to the following references: H1047R and Rosa+/- (Liu et al., 2011), E545Kfloxed/+ (Robinson et al., 2012), EYFP/+ and Ai9/+ (Zhu et al., 2012). All mouse procedures were approved by the Institutional Animal Care and Use Committees.
Sample preparation and histochemical procedures
Embryos and postnatal pups were harvested in phosphate buffer saline (PBS); brains fixed in 4% paraformaldehyde (PFA) for 4 hr, equilibrated in 30% (wt/vol) sucrose made in PBS, and sectioned at 25 μm on a freezing microtome. Adult mice were perfused with 4% PFA, brains collected and fixed in 4% PFA overnight, sunk in 30% sucrose in PBS, embedded in optimum cutting temperature (OCT) compound and sectioned at 12 μm on a cryostat. Sections were then processed for Nissl, hematoxylin and eosin (H&E) or immunohistochemical staining.
Immunohistochemistry: Sections were washed thrice in PBS, boiled in 10 mM Sodium citrate solution for antigen retrieval, blocked in 5% serum in PBS with 0.1%Triton X-100 and then incubated overnight at 4°C with primary antibodies. The next day, sections were washed thrice in PBS, incubated with appropriate species-specific secondary antibodies conjugated with Alexa 488, 568, 594 or 647 fluorophores (Invitrogen) for 2 h at room temperature and then counterstained with DAPI to visualize nuclei. Sections were coverslipped using Fluorogel (EMS #17985) mounting medium. Immunostained sections were imaged in Zeiss LSM 710 Imager Z2 laser scanning confocal microscope using Zen 2009 software and later processed in ImageJ software (NIH, Bethesda, Maryland, USA). Primary antibodies used are: rat anti-BrdU (Abcam), mouse anti-BrdU (Roche), rabbit anti-Tbr1(EMD Millipore), mouse anti-Tbr2 (EMD Millipore), rat anti-Ctip2 (Abcam), rabbit anti-Cux1/CDP (Santa Cruz Biotechnology), rabbit anti-pS6 (Cell Signaling), mouse anti-NeuN (EMD Millipore), mouse anti-Reelin (EMD Millipore), rabbit anti-Laminin (Sigma), rabbit anti-Olig2 (EMD Millipore), mouse anti-Nestin (EMD Millipore), chicken anti-YFP (Abcam), rabbit anti-Ki67 (Vector Lab), mouse anti-S100 (Abcam).
Nissl and H&E staining: Sections were stained in 0.1% cresyl violet solution for 10 min, rinsed quickly in distilled water, dehydrated in 95% ethanol, and left in xylene before being coverslipped with Permount (Fischer Scientific). H&E staining was performed by passing the sections through Harris modified Hematoxylin solution (Fisher Scientific) and EosinY (Sigma) and then dehydrating them in increasing grades of ethanol before dipping in xylene and coverslipping. Brightfield images were taken in Leica MZFLIII microscope using Leica DFC425 camera and LAS V3.8 software.
BrdU incorporation experiments
Bromodeoxyuridine (BrdU; Life Technologies) was administered intraperitoneally (100 μg/g of body weight) to pregnant mice at E14.5/16.5 for 1 hr, at E15.5 for 1 day and at E12.5/E16.5 for proliferation assays, cell cycle exit and birthdating experiments respectively. S-phase labeling index (LI) was calculated by dividing total BrdU+ cells by total number of DAPI+ cells. Quit fraction was calculated by dividing BrdU+Ki67− cells by total number of BrdU+ cells.
β-Gal staining protocol
Brain sections were briefly fixed, washed in wash buffer at room temperature and then stained overnight at 37°C in the staining solution comprising of the X-gal substrate. The sections were then washed in wash buffer at room temperature and stored at 4°C.
TUNEL staining
TUNEL staining was processed on E16.5 control and mutant sections using Roche In situ Cell Death Detection Kit, Fluorescein.
Magnetic resonance imaging (MRI) for volumetric analysis
At least 5 mice of each genotype (age P40–60) were used for volumetric analyses. MRI study was performed using a 7 T Bruker ClinScan system (Bruker BioSpin MRI GmbH, Germany) equipped with 12S gradient coil. A 2-channel surface coil was used for MR imaging. Animals were anesthetized and maintained with 1.5% isoflurane during MRI sessions. Transverse T2-weighted turbo spin echo images were acquired for volume measurements (TR/TE = 3660/50 ms, FOV = 25 × 25 mm, matrix = 320 × 320, NEX = 1, thickness = 0.4 mm, scan time = 6.5 min). Total brain volumes were obtained by manually segmenting brain regions from olfactory bulbs to cerebellum, and computing volumes using OsiriX (Pixmeo, Switzerland). Each data point in the graph represents 1 mouse.
Seizure experiments
Mice obtained from the following crosses were used for experiments at ~P35 (young age) and ~P180 (old age): Nestin-cre/+ X Pik3caE545Kfloxed/+ and Nestin-creER/+ X Pik3caE545Kfloxed/+. At least 5 animals of each genotype were used per treatment experiment.
Pentylenetetrazole (PTZ) seizure test. Mice were subcutaneously injected with PTZ (Sigma), a GABA (A) receptor-antagonist, at 40 mg/kg body weight and digital videos of the mice were recorded for 30 min post-PTZ injection. Principal behavior in each 10 second-bin of the recorded video was scored as 4 or 5 using the Racine scale of seizure severity (4, rearing with forelimb clonus; and 5, rearing and falling with forelimb clonus) (Kalume, 2013; Racine, 1972). Treatment trials. Pan-PI3K inhibitor BKM-120 (Novartis; 50 mg/kg body weight, dissolved in 0.5% Tween-80, 0.5% methylcellulose) or saline was administered by oral gavage to the mice 1hr before PTZ seizure test.
Sleep deprivation (SD). To permit control of circadian variations of sleep in these experiments, baseline (control) sleep data (Pre SD) were recorded from mice one day before they were submitted to total sleep deprivation. Mice were allowed to sleep normally for 5 continuous hours beginning at 8:00 AM, and then baseline sleep video-EEG recordings were obtained continuously in the 1 subsequent hour. On the following day, beginning at 8:00 AM, the same mice were kept awake for 5 consecutive hours by random gentle touches with a rotating light curtain attached to a motor mounted on the lid of the sleep deprivation chamber. The motor was in turn, connected to a computer via Power Lab (ADInstruments, Colorado Spring, CO). The random direction and speed of the motor rotation were custom-programmed in the stimulator panel dialog box of LabChart 8 Software (ADInstruments, Colorado Spring, CO). The specific parameters used are tabulated as Supplementary file 1. Post sleep deprivation, mice were not disturbed and post SD recordings were obtained for 2hr.
Video-electroencephalagraphy-electromyography (Video-EEG-EMG) recording. These experiments were performed as previously described (Kalume, 2013). Briefly, mice underwent survival surgery to implant fine (diameter: 130 µm bare; 180 µm coated) silver wire EEG and EMG electrodes under isoflurane anesthesia. Four EEG electrodes were placed bilaterally through the small cranial burr holes over the posterior and frontal cortices and were fixed in place with cyanoacrylate glue and dental cement (Lang Dental Manufacturing Co., Inc., Wheeling, IL). Similarly, one reference electrode was placed above the cerebellum. A ground electrode was inserted subcutaneously over the back. EMG electrodes were placed in back muscles. Only 2 electrodes were implanted in the young Nestin-cre;E545K mutant and control mice. Mice were allowed to recover from surgery for 2-3 days. Simultaneous video-EEG-EMG recordings were collected from conscious mice on a PowerLab 8/35 data acquisition unit using LabChart 7.3.3 software (AD Instruments, Colorado Spring, Co). All bioelectrical signals were acquired at 1KHz sampling rate. The EEG signals were processed off-line with a 1-70 Hz bandpass filter and the ECG signals with a 3-Hz highpass filter. Interictal spikes were identified as transient, clearly distinguished from background activity, with pointed peak and short duration. Myoclonic seizures were identified as shock-like jerks of the muscles on video associated with a spike or polyspike-wave complex on EEG.
Reverse phase protein array (RPPA) analysis
Cortex and hippocampus were dissected out of P35 control and E545K mutant mice, following different treatments (vehicle only (-), +BKM120, +PTZ, BKM120+PTZ), and flash-frozen in liquid nitrogen then sent to the RPPA Core Facility at MD Anderson Cancer Center, University of Texas. Three independent biological replicates per sample were analyzed. Analysis was performed as previously described (Tibes et al., 2006). The mouse brain tissue samples were lysed and underwent protein extraction. Cellular protein was denatured by SDS sample buffer and serial dilution was made for each sample. Cell lysates were then probed with different validated antibodies. Signals were detected by DAB colorimetric reaction and intensity was quantified using ArrayPro software. Protein concentration was determined by super curve fitting. All the data points were normalized for protein loading and transformed to linear value. These linear values were used to make bar graphs for comparative analysis. See http://www.mdanderson.org/education-and-research/resources-for-professionals/scientific-resources/core-facilities-and-services/functional-proteomics-rppa-core/index.html) for a detailed antibody list and protocols.
Quantitative analysis
For quantitative analysis of embryos, data was collected from comparable sections of a minimum of 3 embryos of each genotype (from 2 or more independent litters) at each developmental stage. Cortical length was measured in the lateral ventricular lining from the tip of the fimbria/cortical hem to the pallial-subpallial boundary. Cortical length and thickness were measured using ImageJ software (NIH, Bethesda, Maryland, USA); the data was normalized to the control value. Cell counts from E14.5 and E16.5 brains were obtained from 25% of the neocortex. Area of interest was derived by dividing the whole length of neocortex into quarters and then taking images of the total area, from pia to ventricle, in the third quartile from dorsal midline. Confocal stacks of immunostained sections of each developmental stage were generated by scanning at intervals of 0.99 μm using filters of appropriate wavelengths at 20X and 40X magnifications. Confocal images of DAPI-stained brain sections and NeuN/pS6-immunostained sections were used to measure nuclear and cell size respectively. Measurements for labeling index, quit fraction, birthdating studies, cell density and size were calculated using ImageJ. For zonal quantification of cells, the cortical column was divided into 5 different parts – the ventricular-subventricular zone (vz/svz), white matter, and 3 equally divided zones of the neocortical plate (lower, mid, upper).
Statistical significance was assessed using 2-tailed unpaired t-tests (for cortical length and thickness, cell density, nuclear size, TUNEL assay, labeling index, quit fraction, total cell counts and seizure data) and ANOVA followed by Bonferroni (for cell size, BKM treatment data, birthdating experiments) and Tukey (for RPPA graphs) post-tests. These analyses were performed in GraphPad Prism v5.01 (GraphPad Software Inc., San Diego, USA) or in Igor Pro v6.3.6.4, Igor Pro Software, Lake Oswego, USA. Differences were considered significant at P< 0.05.
Acknowledgements
We thank Leon Murphy (Novartis) for BKM120, Taylor Faubion for technical support, Joseph Gleeson for sharing unpublished data and Ghayda Mirzaa and Laura Jansen for discussions.
Funding Statement
The funders had no role in study design, data collection and interpretation, or the decision to submit the work for publication.
Funding Information
This paper was supported by the following grants:
Seattle Children's Hydrocephalus Research Guild Seattle Children's Hydrocephalus Guild Seed Funds to Kathleen J Millen.
National Institutes of Health R01:NS072441 to Kathleen J Millen.
National Cancer Institute CCSG:CA16672 to Gordon B Mills.
Citizens United for Research in Epilepsy SUDEP grant 2014, Christopher Donalty and Kyle Coggins Award to Franck Kalume.
National Institutes of Health R01:NS058721 to William B Dobyns.
National Institutes of Health R01:CA188516 to Suzanne J Baker.
National Institutes of Health P50:CA015962-02 to Jean J Zhao.
National Institutes of Health P01:CA142536 to Jean J Zhao.
Additional information
Competing interests
The authors declare that no competing interests exist.
Author contributions
AR, Conception and design, Acquisition of data, Analysis and interpretation of data, Drafting or revising the article.
JS, Conception and design, Acquisition of data, Analysis and interpretation of data, Drafting or revising the article.
FK, Conception and design, Acquisition of data, Analysis and interpretation of data, Drafting or revising the article.
JN, Conception and design, Acquisition of data, Analysis and interpretation of data, Contributed unpublished essential data or reagents.
SR, Conception and design, Acquisition of data, Analysis and interpretation of data.
YL, Acquisition of data, Analysis and interpretation of data.
WBD, Conception and design, Analysis and interpretation of data, Drafting or revising the article.
GBM, Conception and design, Analysis and interpretation of data, Drafting or revising the article.
JJZ, Conception and design, Analysis and interpretation of data, Contributed unpublished essential data or reagents.
SJB, Conception and design, Analysis and interpretation of data, Contributed unpublished essential data or reagents.
KJM, Conception and design, Acquisition of data, Analysis and interpretation of data, Drafting or revising the article.
Ethics
Animal experimentation: All animal experimentation done in this study was done in accordance with the guidelines laid down by the Institutional Animal Care and Use Committees (IACUC) of Seattle Children's Research Institute, Seattle, WA (protocols 14208 and 14395), St. Jude Children's Research Hospital, Memphis, TN (protocol 278), and Dana Farber Cancer Institute, Boston, MA (protocol 06-034).
Additional files
Table shows the list of parameters customized in the stimulator panel dialog box of LabChart 8 Software, in order to randomize the speed and direction of rotation of the motor used for the sleep deprivation study. The stimulation program cycle, comprising segments 1–12, was repeated through the entire duration of the sleep deprivation experiment (i.e. for 5 hr).
References
- Adamsbaum C, Robain O, Cohen PA, Delalande O, Fohlen M, Kalifa G. Focal cortical dysplasia and hemimegalencephaly: histological and neuroimaging correlations. Pediatric Radiology. 1998;28:583–590. doi: 10.1007/s002470050421. [DOI] [PubMed] [Google Scholar]
- Arai A, Saito T, Hanai S, Sukigara S, Nabatame S, Otsuki T, Nakagawa E, Takahashi A, Kaneko Y, Kaido T, Saito Y, Sugai K, Sasaki M, Goto Y, Itoh M. Abnormal maturation and differentiation of neocortical neurons in epileptogenic cortical malformation: unique distribution of layer-specific marker cells of focal cortical dysplasia and hemimegalencephaly. Brain Research. 2012;1470:89–97. doi: 10.1016/j.brainres.2012.06.009. [DOI] [PubMed] [Google Scholar]
- Backman SA, Stambolic V, Suzuki A, Haight J, Elia A, Pretorius J, Tsao MS, Shannon P, Bolon B, Ivy GO, Mak TW. Deletion of pten in mouse brain causes seizures, ataxia and defects in soma size resembling lhermitte-duclos disease. Nature Genetics. 2001;29:396–403. doi: 10.1038/ng782. [DOI] [PubMed] [Google Scholar]
- Baek ST, Copeland B, Yun EJ, Kwon SK, Guemez-Gamboa A, Schaffer AE, Kim S, Kang HC, Song S, Mathern GW, Gleeson JG. An AKT3-FOXG1-reelin network underlies defective migration in human focal malformations of cortical development. Nature Medicine. 2015;21:1445–1454. doi: 10.1038/nm.3982. [DOI] [PMC free article] [PubMed] [Google Scholar]
- Bast T, Ramantani G, Seitz A, Rating D. Focal cortical dysplasia: prevalence, clinical presentation and epilepsy in children and adults. Acta Neurologica Scandinavica. 2006;113:72–81. doi: 10.1111/j.1600-0404.2005.00555.x. [DOI] [PubMed] [Google Scholar]
- Batista-Brito R, Fishell G. The developmental integration of cortical interneurons into a functional network. Current Topics in Developmental Biology. 2009;87:81–118. doi: 10.1016/S0070-2153(09)01203-4. [DOI] [PMC free article] [PubMed] [Google Scholar]
- Bendell JC, Rodon J, Burris HA, de Jonge M, Verweij J, Birle D, Demanse D, De Buck SS, Ru QC, Peters M, Goldbrunner M, Baselga J. Phase i, dose-escalation study of BKM120, an oral pan-class i PI3K inhibitor, in patients with advanced solid tumors. Journal of Clinical Oncology. 2012;30:282–290. doi: 10.1200/JCO.2011.36.1360. [DOI] [PubMed] [Google Scholar]
- Bernasconi A, Bernasconi N, Bernhardt BC, Schrader D. Advances in MRI for 'cryptogenic' epilepsies. Nature Reviews. Neurology. 2011;7:99–108. doi: 10.1038/nrneurol.2010.199. [DOI] [PubMed] [Google Scholar]
- Binnie CD, Prior PF. Electroencephalography. Journal of Neurology, Neurosurgery & Psychiatry. 1994;57:1308–1319. doi: 10.1136/jnnp.57.11.1308. [DOI] [PMC free article] [PubMed] [Google Scholar]
- Blümcke I, Thom M, Aronica E, Armstrong DD, Vinters HV, Palmini A, Jacques TS, Avanzini G, Barkovich AJ, Battaglia G, Becker A, Cepeda C, Cendes F, Colombo N, Crino P, Cross JH, Delalande O, Dubeau F, Duncan J, Guerrini R, Kahane P, Mathern G, Najm I, Ozkara C, Raybaud C, Represa A, Roper SN, Salamon N, Schulze-Bonhage A, Tassi L, Vezzani A, Spreafico R. The clinicopathologic spectrum of focal cortical dysplasias: a consensus classification proposed by an ad hoc task force of the ILAE diagnostic methods commission. Epilepsia. 2011;52:158–174. doi: 10.1111/j.1528-1167.2010.02777.x. [DOI] [PMC free article] [PubMed] [Google Scholar]
- Brachmann SM, Kleylein-Sohn J, Gaulis S, Kauffmann A, Blommers MJ, Kazic-Legueux M, Laborde L, Hattenberger M, Stauffer F, Vaxelaire J, Romanet V, Henry C, Murakami M, Guthy DA, Sterker D, Bergling S, Wilson C, Brümmendorf T, Fritsch C, Garcia-Echeverria C, Sellers WR, Hofmann F, Maira SM. Characterization of the mechanism of action of the pan class i PI3K inhibitor NVP-BKM120 across a broad range of concentrations. Molecular Cancer Therapeutics. 2012;11:1747–1757. doi: 10.1158/1535-7163.MCT-11-1021. [DOI] [PubMed] [Google Scholar]
- Cheung M, R. Testa J. Diverse mechanisms of AKT pathway activation in human malignancy. Curr Cancer Drug Targets. 2013;13:234–244. doi: 10.2174/1568009611313030002. [DOI] [PMC free article] [PubMed] [Google Scholar]
- Chizhikov VV, Lindgren AG, Currle DS, Rose MF, Monuki ES, Millen KJ. The roof plate regulates cerebellar cell-type specification and proliferation. Development. 2006;133:2793–2804. doi: 10.1242/dev.02441. [DOI] [PubMed] [Google Scholar]
- Cohen AS, Townsend KN, Xiang QS, Attariwala R, Borchers C, Senger C, Picker W, Levi J, Yewchuk L, Tan J, Eydoux P, Lum A, Yong SL, McKinnon ML, Lear SA, Everett R, Jones SJ, Yip S, Gibson WT. Somatic mosaicism for the p.His1047Arg mutation in PIK3CA in a girl with mesenteric lipomatosis. American Journal of Medical Genetics. Part A. 2014;164A:2360–2364. doi: 10.1002/ajmg.a.36622. [DOI] [PubMed] [Google Scholar]
- Conway RL, Pressman BD, Dobyns WB, Danielpour M, Lee J, Sanchez-Lara PA, Butler MG, Zackai E, Campbell L, Saitta SC, Clericuzio CL, Milunsky JM, Hoyme HE, Shieh J, Moeschler JB, Crandall B, Lauzon JL, Viskochil DH, Harding B, Graham JM. Neuroimaging findings in macrocephaly-capillary malformation: a longitudinal study of 17 patients. American Journal of Medical Genetics. Part A. 2007;143A:2981–3008. doi: 10.1002/ajmg.a.32040. [DOI] [PMC free article] [PubMed] [Google Scholar]
- Curatolo P, Moavero R. MTOR inhibitors as a new therapeutic option for epilepsy. Expert Review of Neurotherapeutics. 2013;13:627–638. doi: 10.1586/ern.13.49. [DOI] [PubMed] [Google Scholar]
- D'Gama AM, Geng Y, Couto JA, Martin B, Boyle EA, LaCoursiere CM, Hossain A, Hatem NE, Barry BJ, Kwiatkowski DJ, Vinters HV, Barkovich AJ, Shendure J, Mathern GW, Walsh CA, Poduri A. Mammalian target of rapamycin pathway mutations cause hemimegalencephaly and focal cortical dysplasia. Annals of Neurology. 2015;77:720–725. doi: 10.1002/ana.24357. [DOI] [PMC free article] [PubMed] [Google Scholar]
- De Rosa MJ, Secor DL, Barsom M, Fisher RS, Vinters HV. Neuropathologic findings in surgically treated hemimegalencephaly: immunohistochemical, morphometric, and ultrastructural study. Acta Neuropathologica. 1992;84:250–260. doi: 10.1007/BF00227817. [DOI] [PubMed] [Google Scholar]
- Devlin AM, Cross JH, Harkness W, Chong WK, Harding B, Vargha-Khadem F, Neville BG. Clinical outcomes of hemispherectomy for epilepsy in childhood and adolescence. Brain. 2003;126:556–566. doi: 10.1093/brain/awg052. [DOI] [PubMed] [Google Scholar]
- Engelman JA. Targeting PI3K signalling in cancer: opportunities, challenges and limitations. Nature Reviews. Cancer. 2009;9:550–562. doi: 10.1038/nrc2664. [DOI] [PubMed] [Google Scholar]
- Fauser S, Essang C, Altenmüller DM, Staack AM, Steinhoff BJ, Strobl K, Bast T, Schubert-Bast S, Stephani U, Wiegand G, Prinz M, Brandt A, Zentner J, Schulze-Bonhage A. Long-term seizure outcome in 211 patients with focal cortical dysplasia. Epilepsia. 2015;56:66–76. doi: 10.1111/epi.12876. [DOI] [PubMed] [Google Scholar]
- Fauser S, Huppertz HJ, Bast T, Strobl K, Pantazis G, Altenmueller DM, Feil B, Rona S, Kurth C, Rating D, Korinthenberg R, Steinhoff BJ, Volk B, Schulze-Bonhage A. Clinical characteristics in focal cortical dysplasia: a retrospective evaluation in a series of 120 patients. Brain. 2006;129:1907–1916. doi: 10.1093/brain/awl133. [DOI] [PubMed] [Google Scholar]
- Fraser MM, Bayazitov IT, Zakharenko SS, Baker SJ. Phosphatase and tensin homolog, deleted on chromosome 10 deficiency in brain causes defects in synaptic structure, transmission and plasticity, and myelination abnormalities. Neuroscience. 2008;151:476–488. doi: 10.1016/j.neuroscience.2007.10.048. [DOI] [PMC free article] [PubMed] [Google Scholar]
- Fraser MM, Zhu X, Kwon CH, Uhlmann EJ, Gutmann DH, Baker SJ. Pten loss causes hypertrophy and increased proliferation of astrocytes in vivo. Cancer Research. 2004;64:7773–7779. doi: 10.1158/0008-5472.CAN-04-2487. [DOI] [PubMed] [Google Scholar]
- Fruman DA, Mauvais-Jarvis F, Pollard DA, Yballe CM, Brazil D, Bronson RT, Kahn CR, Cantley LC. Hypoglycaemia, liver necrosis and perinatal death in mice lacking all isoforms of phosphoinositide 3-kinase p85 alpha. Nature Genetics. 2000;26:379–382. doi: 10.1038/81715. [DOI] [PubMed] [Google Scholar]
- Geering B, Cutillas PR, Nock G, Gharbi SI, Vanhaesebroeck B. Class IA phosphoinositide 3-kinases are obligate p85-p110 heterodimers. Proceedings of the National Academy of Sciences of the United States of America. 2007;104:7809–7814. doi: 10.1073/pnas.0700373104. [DOI] [PMC free article] [PubMed] [Google Scholar]
- Giorgi FS, Maestri M, Guida M, Di Coscio E, Carnicelli L, Perini D, Pizzanelli C, Iudice A, Bonanni E. Controversial issues on EEG after sleep deprivation for the diagnosis of epilepsy. Epilepsy Research and Treatment. 20132013;2013:1–5. doi: 10.1155/2013/614685. doi: 10.1155/2013/614685. [DOI] [PMC free article] [PubMed] [Google Scholar]
- Groesser L, Herschberger E, Landthaler M, Hafner C. FGFR3, PIK3CA and RAS mutations in benign lichenoid keratosis. The British Journal of Dermatology. 2012;166:784–788. doi: 10.1111/j.1365-2133.2011.10788.x. [DOI] [PubMed] [Google Scholar]
- Gymnopoulos M, Elsliger M-A, Vogt PK. Rare cancer-specific mutations in PIK3CA show gain of function. Proceedings of the National Academy of Sciences of the United States of America. 2007;104:5569–5574. doi: 10.1073/pnas.0701005104. [DOI] [PMC free article] [PubMed] [Google Scholar]
- Hafner C, Lopez-Knowles E, Luis NM, Toll A, Baselga E, Fernandez-Casado A, Hernandez S, Ribe A, Mentzel T, Stoehr R, Hofstaedter F, Landthaler M, Vogt T, Pujol RM, Hartmann A, Real FX. Oncogenic PIK3CA mutations occur in epidermal nevi and seborrheic keratoses with a characteristic mutation pattern. Proceedings of the National Academy of Sciences of the United States of America. 2007;104:13450–13454. doi: 10.1073/pnas.0705218104. [DOI] [PMC free article] [PubMed] [Google Scholar]
- Hennessy BT, Smith DL, Ram PT, Lu Y, Mills GB. Exploiting the PI3K/AKT pathway for cancer drug discovery. Nature Reviews. Drug Discovery. 2005;4:988–1004. doi: 10.1038/nrd1902. [DOI] [PubMed] [Google Scholar]
- Iwabuchi H, Sakamoto M, Sakunaga H, Ma YY, Carcangiu ML, Pinkel D, Yang-Feng TL, Gray JW. Genetic analysis of benign, low-grade, and high-grade ovarian tumors. Cancer Research. 1995;55:6172–6180. [PubMed] [Google Scholar]
- Jansen LA, Mirzaa GM, Ishak GE, O'Roak BJ, Hiatt JB, Roden WH, Gunter SA, Christian SL, Collins S, Adams C, Rivière J-B, St-Onge J, Ojemann JG, Shendure J, Hevner RF, Dobyns WB. PI3K/AKT pathway mutations cause a spectrum of brain malformations from megalencephaly to focal cortical dysplasia. Brain. 2015;138:1613–1628. doi: 10.1093/brain/awv045. [DOI] [PMC free article] [PubMed] [Google Scholar]
- Jansen LA, Mirzaa GM, Ishak GE, O'Roak BJ, Hiatt JB, Roden WH, Gunter SA, Christian SL, Collins S, Adams C, Rivière JB, St-Onge J, Ojemann JG, Shendure J, Hevner RF, Dobyns WB. PI3K/AKT pathway mutations cause a spectrum of brain malformations from megalencephaly to focal cortical dysplasia. Brain : A Journal of Neurology. 2015;138:1613–1628. doi: 10.1093/brain/awv045. [DOI] [PMC free article] [PubMed] [Google Scholar]
- Kalume F, Oakley JC, Westenbroek RE, Gile J, de la Iglesia HO, Scheuer T, Catterall WA. Sleep impairment and reduced interneuron excitability in a mouse model of dravet syndrome. Neurobiology of Disease. 2015;77:141–154. doi: 10.1016/j.nbd.2015.02.016. [DOI] [PMC free article] [PubMed] [Google Scholar]
- Kalume F. Sudden unexpected death in dravet syndrome: respiratory and other physiological dysfunctions. Respiratory Physiology & Neurobiology. 2013;189:324–328. doi: 10.1016/j.resp.2013.06.026. [DOI] [PMC free article] [PubMed] [Google Scholar]
- Keppler-Noreuil KM, Sapp JC, Lindhurst MJ, Parker VE, Blumhorst C, Darling T, Tosi LL, Huson SM, Whitehouse RW, Jakkula E, Grant I, Balasubramanian M, Chandler KE, Fraser JL, Gucev Z, Crow YJ, Brennan LM, Clark R, Sellars EA, Pena LD, Krishnamurty V, Shuen A, Braverman N, Cunningham ML, Sutton VR, Tasic V, Graham JM, Geer J, Henderson A, Semple RK, Biesecker LG. Clinical delineation and natural history of the PIK3CA-related overgrowth spectrum. American Journal of Medical Genetics. 2014;164A:1713–1733. doi: 10.1002/ajmg.a.36552. [DOI] [PMC free article] [PubMed] [Google Scholar]
- Kinross KM, Montgomery KG, Kleinschmidt M, Waring P, Ivetac I, Tikoo A, Saad M, Hare L, Roh V, Mantamadiotis T, Sheppard KE, Ryland GL, Campbell IG, Gorringe KL, Christensen JG, Cullinane C, Hicks RJ, Pearson RB, Johnstone RW, McArthur GA, Phillips WA. An activating Pik3ca mutation coupled with pten loss is sufficient to initiate ovarian tumorigenesis in mice. The Journal of Clinical Investigation. 2012;122:553–557. doi: 10.1172/JCI59309. [DOI] [PMC free article] [PubMed] [Google Scholar]
- Kumar V, Zhang MX, Swank MW, Kunz J, Wu GY. Regulation of dendritic morphogenesis by ras-PI3K-akt-mTOR and ras-MAPK signaling pathways. The Journal of Neuroscience. 2005;25:11288–11299. doi: 10.1523/JNEUROSCI.2284-05.2005. [DOI] [PMC free article] [PubMed] [Google Scholar]
- Kurek KC, Luks VL, Ayturk UM, Alomari AI, Fishman SJ, Spencer SA, Mulliken JB, Bowen ME, Yamamoto GL, Kozakewich HP, Warman ML. Somatic mosaic activating mutations in PIK3CA cause CLOVES syndrome. American Journal of Human Genetics. 2012;90:1108–1115. doi: 10.1016/j.ajhg.2012.05.006. [DOI] [PMC free article] [PubMed] [Google Scholar]
- Kwon CH, Zhu X, Zhang J, Knoop LL, Tharp R, Smeyne RJ, Eberhart CG, Burger PC, Baker SJ. Pten regulates neuronal soma size: a mouse model of lhermitte-duclos disease. Nature Genetics. 2001;29:404–411. doi: 10.1038/ng781. [DOI] [PubMed] [Google Scholar]
- Lee JH, Huynh M, Silhavy JL, Kim S, Dixon-Salazar T, Heiberg A, Scott E, Bafna V, Hill KJ, Collazo A, Funari V, Russ C, Gabriel SB, Mathern GW, Gleeson JG. De novo somatic mutations in components of the PI3K-AKT3-mTOR pathway cause hemimegalencephaly. Nature Genetics. 2012;44:941–945. doi: 10.1038/ng.2329. [DOI] [PMC free article] [PubMed] [Google Scholar]
- Lim JS, Kim WI, Kang HC, Kim SH, Park AH, Park EK, Cho YW, Kim S, Kim HM, Kim JA, Kim J, Rhee H, Kang SG, Kim HD, Kim D, Kim DS, Lee JH. Brain somatic mutations in MTOR cause focal cortical dysplasia type II leading to intractable epilepsy. Nature Medicine. 2015;21:395–400. doi: 10.1038/nm.3824. [DOI] [PubMed] [Google Scholar]
- Lindhurst MJ, Parker VE, Payne F, Sapp JC, Rudge S, Harris J, Witkowski AM, Zhang Q, Groeneveld MP, Scott CE, Daly A, Huson SM, Tosi LL, Cunningham ML, Darling TN, Geer J, Gucev Z, Sutton VR, Tziotzios C, Dixon AK, Helliwell T, O'Rahilly S, Savage DB, Wakelam MJ, Barroso I, Biesecker LG, Semple RK. Mosaic overgrowth with fibroadipose hyperplasia is caused by somatic activating mutations in PIK3CA. Nature Genetics. 2012;44:928–933. doi: 10.1038/ng.2332. [DOI] [PMC free article] [PubMed] [Google Scholar]
- Liu P, Cheng H, Santiago S, Raeder M, Zhang F, Isabella A, Yang J, Semaan DJ, Chen C, Fox EA, Gray NS, Monahan J, Schlegel R, Beroukhim R, Mills GB, Zhao JJ. Oncogenic PIK3CA-driven mammary tumors frequently recur via PI3K pathway-dependent and PI3K pathway-independent mechanisms. Nature Medicine. 2011;17:1116–1120. doi: 10.1038/nm.2402. [DOI] [PMC free article] [PubMed] [Google Scholar]
- Luks VL, Kamitaki N, Vivero MP, Uller W, Rab R, Bovée JV, Rialon KL, Guevara CJ, Alomari AI, Greene AK, Fishman SJ, Kozakewich HP, Maclellan RA, Mulliken JB, Rahbar R, Spencer SA, Trenor CC, Upton J, Zurakowski D, Perkins JA, Kirsh A, Bennett JT, Dobyns WB, Kurek KC, Warman ML, McCarroll SA, Murillo R. Lymphatic and other vascular malformative/overgrowth disorders are caused by somatic mutations in PIK3CA. The Journal of Pediatrics. 2015;166:1048–1054. doi: 10.1016/j.jpeds.2014.12.069. [DOI] [PMC free article] [PubMed] [Google Scholar]
- Macdonald RL, Barker JL. Specific antagonism of GABA-mediated postsynaptic inhibition in cultured mammalian spinal cord neurons: a common mode of convulsant action. Neurology. 1978;28:325–330. doi: 10.1212/WNL.28.4.325. [DOI] [PubMed] [Google Scholar]
- Maira SM, Pecchi S, Huang A, Burger M, Knapp M, Sterker D, Schnell C, Guthy D, Nagel T, Wiesmann M, Brachmann S, Fritsch C, Dorsch M, Chène P, Shoemaker K, De Pover A, Menezes D, Martiny-Baron G, Fabbro D, Wilson CJ, Schlegel R, Hofmann F, García-Echeverría C, Sellers WR, Voliva CF. Identification and characterization of NVP-BKM120, an orally available pan-class i PI3-kinase inhibitor. Molecular Cancer Therapeutics. 2012;11:317–328. doi: 10.1158/1535-7163.MCT-11-0474. [DOI] [PubMed] [Google Scholar]
- Meyer DS, Brinkhaus H, Müller U, Müller M, Cardiff RD, Bentires-Alj M. Luminal expression of PIK3CA mutant H1047R in the mammary gland induces heterogeneous tumors. Cancer Research. 2011;71:4344–4351. doi: 10.1158/0008-5472.CAN-10-3827. [DOI] [PubMed] [Google Scholar]
- Miled N, Yan Y, Hon WC, Perisic O, Zvelebil M, Inbar Y, Schneidman-Duhovny D, Wolfson HJ, Backer JM, Williams RL. Mechanism of two classes of cancer mutations in the phosphoinositide 3-kinase catalytic subunit. Science. 2007;317:239–242. doi: 10.1126/science.1135394. [DOI] [PubMed] [Google Scholar]
- Mirzaa GM, Conway RL, Gripp KW, Lerman-Sagie T, Siegel DH, deVries LS, Lev D, Kramer N, Hopkins E, Graham JM, Dobyns WB. Megalencephaly-capillary malformation (mCAP) and megalencephaly-polydactyly-polymicrogyria-hydrocephalus (mPPH) syndromes: two closely related disorders of brain overgrowth and abnormal brain and body morphogenesis. American Journal of Medical Genetics. Part A. 2012;158A:269–291. doi: 10.1002/ajmg.a.34402. [DOI] [PubMed] [Google Scholar]
- Moon UY, Park JY, Park R, Cho JY, Hughes LJ, McKenna J, Goetzl L, Cho SH, Crino PB, Gambello MJ, Kim S. Impaired reelin-Dab1 signaling contributes to neuronal migration deficits of tuberous sclerosis complex. Cell Reports. 2015;12:965–978. doi: 10.1016/j.celrep.2015.07.013. [DOI] [PMC free article] [PubMed] [Google Scholar]
- Osborn AJ, Dickie P, Neilson DE, Glaser K, Lynch KA, Gupta A, Dickie BH. Activating PIK3CA alleles and lymphangiogenic phenotype of lymphatic endothelial cells isolated from lymphatic malformations. Human Molecular Genetics. 2015;24:926–938. doi: 10.1093/hmg/ddu505. [DOI] [PubMed] [Google Scholar]
- Pasquier B, Péoc'H M, Fabre-Bocquentin B, Bensaadi L, Pasquier D, Hoffmann D, Kahane P, Tassi L, Le Bas JF, Benabid AL. Surgical pathology of drug-resistant partial epilepsy. a 10-year-experience with a series of 327 consecutive resections. Epileptic Disorders. 2002;4:99–119. [PubMed] [Google Scholar]
- Racine RJ. Modification of seizure activity by electrical stimulation. II. motor seizure. Electroencephalography and Clinical Neurophysiology. 1972;32:281–294. doi: 10.1016/0013-4694(72)90177-0. [DOI] [PubMed] [Google Scholar]
- Rios JJ, Paria N, Burns DK, Israel BA, Cornelia R, Wise CA, Ezaki M. Somatic gain-of-function mutations in PIK3CA in patients with macrodactyly. Human Molecular Genetics. 2013;22:444–451. doi: 10.1093/hmg/dds440. [DOI] [PMC free article] [PubMed] [Google Scholar]
- Rivière JB, Mirzaa GM, O'Roak BJ, Beddaoui M, Alcantara D, Conway RL, St-Onge J, Schwartzentruber JA, Gripp KW, Nikkel SM, Worthylake T, Sullivan CT, Ward TR, Butler HE, Kramer NA, Albrecht B, Armour CM, Armstrong L, Caluseriu O, Cytrynbaum C, Drolet BA, Innes AM, Lauzon JL, Lin AE, Mancini GM, Meschino WS, Reggin JD, Saggar AK, Lerman-Sagie T, Uyanik G, Weksberg R, Zirn B, Beaulieu CL, Majewski J, Bulman DE, O'Driscoll M, Shendure J, Graham JM, Boycott KM, Dobyns WB, Finding of Rare Disease Genes (FORGE) Canada Consortium De novo germline and postzygotic mutations in AKT3, PIK3R2 and PIK3CA cause a spectrum of related megalencephaly syndromes. Nature Genetics. 2012;44:934–940. doi: 10.1038/ng.2331. [DOI] [PMC free article] [PubMed] [Google Scholar]
- Robinson G, Parker M, Kranenburg TA, Lu C, Chen X, Ding L, Phoenix TN, Hedlund E, Wei L, Zhu X, Chalhoub N, Baker SJ, Huether R, Kriwacki R, Curley N, Thiruvenkatam R, Wang J, Wu G, Rusch M, Hong X, Becksfort J, Gupta P, Ma J, Easton J, Vadodaria B, Onar-Thomas A, Lin T, Li S, Pounds S, Paugh S, Zhao D, Kawauchi D, Roussel MF, Finkelstein D, Ellison DW, Lau CC, Bouffet E, Hassall T, Gururangan S, Cohn R, Fulton RS, Fulton LL, Dooling DJ, Ochoa K, Gajjar A, Mardis ER, Wilson RK, Downing JR, Zhang J, Gilbertson RJ. Novel mutations target distinct subgroups of medulloblastoma. Nature. 2012;488:43–48. doi: 10.1038/nature11213. [DOI] [PMC free article] [PubMed] [Google Scholar]
- Rossini L, Medici V, Tassi L, Cardinale F, Tringali G, Bramerio M, Villani F, Spreafico R, Garbelli R. Layer-specific gene expression in epileptogenic type II focal cortical dysplasia: normal-looking neurons reveal the presence of a hidden laminar organization. Acta Neuropathologica Communications. 2014;2:45. doi: 10.1186/2051-5960-2-45. [DOI] [PMC free article] [PubMed] [Google Scholar]
- Russo GL, Tassi L, Cossu M, Cardinale F, Mai R, Castana L, Colombo N, Bramerio M. Focal cortical resection in malformations of cortical development. Epileptic Disorders. 2003;5 Suppl 2:S115–123. [PubMed] [Google Scholar]
- Salamon N, Andres M, Chute DJ, Nguyen ST, Chang JW, Huynh MN, Chandra PS, Andre VM, Cepeda C, Levine MS, Leite JP, Neder L, Vinters HV, Mathern GW. Contralateral hemimicrencephaly and clinical-pathological correlations in children with hemimegalencephaly. Brain. 2006;129:352–365. doi: 10.1093/brain/awh681. [DOI] [PubMed] [Google Scholar]
- Samuels Y, Waldman T. Oncogenic mutations of PIK3CA in human cancers. Curr Top Microbiol Immunol. 2011;347:21–41. doi: 10.1007/82_2010_68. [DOI] [PMC free article] [PubMed] [Google Scholar]
- Sosunov AA, Wu X, Weiner HL, Mikell CB, Goodman RR, Crino PD, McKhann GM. Tuberous sclerosis: a primary pathology of astrocytes? Epilepsia. 2008;49 Suppl 2:53–62. doi: 10.1111/j.1528-1167.2008.01493.x. [DOI] [PubMed] [Google Scholar]
- Stemke-Hale K, Gonzalez-Angulo AM, Lluch A, Neve RM, Kuo WL, Davies M, Carey M, Hu Z, Guan Y, Sahin A, Symmans WF, Pusztai L, Nolden LK, Horlings H, Berns K, Hung MC, van de Vijver MJ, Valero V, Gray JW, Bernards R, Mills GB, Hennessy BT. An integrative genomic and proteomic analysis of PIK3CA, PTEN, and AKT mutations in breast cancer. Cancer Research. 2008;68:6084–6091. doi: 10.1158/0008-5472.CAN-07-6854. [DOI] [PMC free article] [PubMed] [Google Scholar]
- Tassi L, Colombo N, Garbelli R, Francione S, Lo Russo G, Mai R, Cardinale F, Cossu M, Ferrario A, Galli C, Bramerio M, Citterio A, Spreafico R. Focal cortical dysplasia: neuropathological subtypes, EEG, neuroimaging and surgical outcome. Brain. 2002;125:1719–1732. doi: 10.1093/brain/awf175. [DOI] [PubMed] [Google Scholar]
- Tatton-Brown K, Weksberg R. Megalencephaly syndromes and activating mutations in the PI3K-AKT pathway: MPPH and MCAP. American Journal of Medical Genetics Part C. 2013;163:122–130. doi: 10.1002/ajmg.c.31361. [DOI] [PubMed] [Google Scholar]
- Tibes R, Qiu Y, Lu Y, Hennessy B, Andreeff M, Mills GB, Kornblau SM. Reverse phase protein array: validation of a novel proteomic technology and utility for analysis of primary leukemia specimens and hematopoietic stem cells. Molecular Cancer Therapeutics. 2006;5:2512–2521. doi: 10.1158/1535-7163.MCT-06-0334. [DOI] [PubMed] [Google Scholar]
- Wong M, Crino PB. MTOR and epileptogenesis in developmental brain malformations. Epilepsia. 2012:835–844. doi: 10.1093/med/9780199746545.003.0065. [DOI] [PubMed] [Google Scholar]
- Yu J, Zhang Y, McIlroy J, Rordorf-Nikolic T, Orr GA, Backer JM. Regulation of the p85/p110 phosphatidylinositol 3'-kinase: stabilization and inhibition of the p110alpha catalytic subunit by the p85 regulatory subunit. Molecular and Cellular Biology. 1998;18:1379–1387. doi: 10.1128/MCB.18.3.1379. [DOI] [PMC free article] [PubMed] [Google Scholar]
- Yuan W, Stawiski E, Janakiraman V, Chan E, Durinck S, Edgar KA, Kljavin NM, Rivers CS, Gnad F, Roose-Girma M, Haverty PM, Fedorowicz G, Heldens S, Soriano RH, Zhang Z, Wallin JJ, Johnson L, Merchant M, Modrusan Z, Stern HM, Seshagiri S. Conditional activation of Pik3ca(H1047R) in a knock-in mouse model promotes mammary tumorigenesis and emergence of mutations. Oncogene. 2013;32:318–326. doi: 10.1038/onc.2012.53. [DOI] [PMC free article] [PubMed] [Google Scholar]
- Zeng LH, Xu L, Gutmann DH, Wong M. Rapamycin prevents epilepsy in a mouse model of tuberous sclerosis complex. Annals of Neurology. 2008;63:444–453. doi: 10.1002/ana.21331. [DOI] [PMC free article] [PubMed] [Google Scholar]
- Zhang B, Wong M. Pentylenetetrazole-induced seizures cause acute, but not chronic, mTOR pathway activation in rat. Epilepsia. 2012;53:506–511. doi: 10.1111/j.1528-1167.2011.03384.x. [DOI] [PMC free article] [PubMed] [Google Scholar]
- Zhao L, Vogt PK. Helical domain and kinase domain mutations in p110 of phosphatidylinositol 3-kinase induce gain of function by different mechanisms. Proceedings of the National Academy of Sciences of the United States of America. 2008;105:2652–2657. doi: 10.1073/pnas.0712169105. [DOI] [PMC free article] [PubMed] [Google Scholar]
- Zhu G, Chow LM, Bayazitov IT, Tong Y, Gilbertson RJ, Zakharenko SS, Solecki DJ, Baker SJ. Pten deletion causes mTorc1-dependent ectopic neuroblast differentiation without causing uniform migration defects. Development. 2012;139:3422–3431. doi: 10.1242/dev.083154. [DOI] [PMC free article] [PubMed] [Google Scholar]