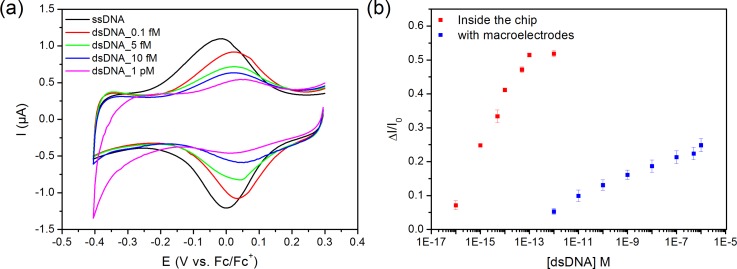
FIG. 4.
(a) Electrochemical response of the biosensor measured in free PBS solution of biosensors after the hybridization reaction (step 4 in Figure 1) with different solutions of complementary DNA with concentrations ranging from 0.1 fM to 1 pM. (b) Calibration curves of the relative changes of the current peak ΔI = (I0 − I) at a fixed potential versus concentration of complementary DNA, where I0 and I are, respectively, the peak current prior to DNA hybridization and after incubation of complementary DNA, which were measured either in microfluidic cell (red) or in conventional macro-cell (blue).

