Abstract
Purpose:
A method was developed utilizing Cherenkov imaging for rapid and thorough determination of the two gantry angles that produce the most uniform treatment plane during dual-field total skin electron beam therapy (TSET).
Methods:
Cherenkov imaging was implemented to gather 2D measurements of relative surface dose from 6 MeV electron beams on a white polyethylene sheet. An intensified charge-coupled device camera time-gated to the Linac was used for Cherenkov emission imaging at sixty-two different gantry angles (1° increments, from 239.5° to 300.5°). Following a modified Stanford TSET technique, which uses two fields per patient position for full body coverage, composite images were created as the sum of two beam images on the sheet; each angle pair was evaluated for minimum variation across the patient region of interest. Cherenkov versus dose correlation was verified with ionization chamber measurements. The process was repeated at source to surface distance (SSD) = 441, 370.5, and 300 cm to determine optimal angle spread for varying room geometries. In addition, three patients receiving TSET using a modified Stanford six-dual field technique with 6 MeV electron beams at SSD = 441 cm were imaged during treatment.
Results:
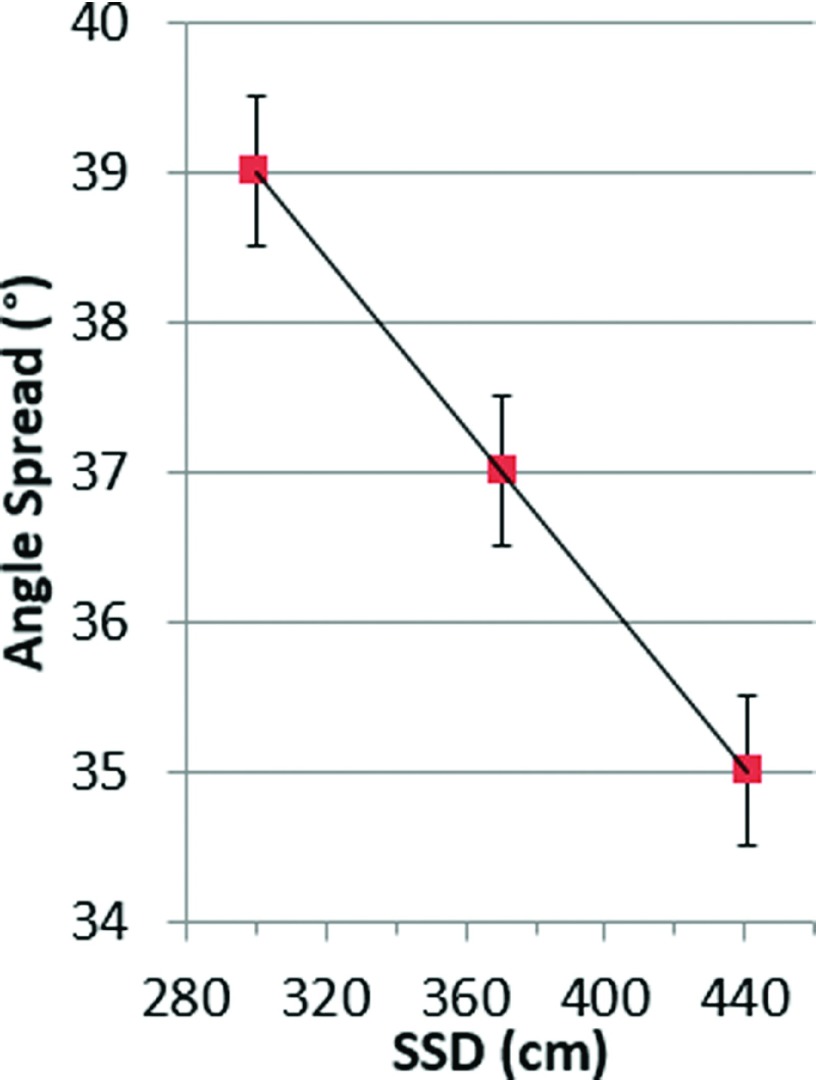
As in previous studies, Cherenkov intensity was shown to directly correlate with dose for homogenous flat phantoms (R2 = 0.93), making Cherenkov imaging an appropriate candidate to assess and optimize TSET setup geometry. This method provided dense 2D images allowing 1891 possible treatment geometries to be comprehensively analyzed from one data set of 62 single images. Gantry angles historically used for TSET at their institution were 255.5° and 284.5° at SSD = 441 cm; however, the angles optimized for maximum homogeneity were found to be 252.5° and 287.5° (+6° increase in angle spread). Ionization chamber measurements confirmed improvement in dose homogeneity across the treatment field from a range of 24.4% at the initial angles, to only 9.8% with the angles optimized. A linear relationship between angle spread and SSD was observed, ranging from 35° at 441 cm, to 39° at 300 cm, with no significant variation in percent-depth dose at midline (R2 = 0.998). For patient studies, factors influencing in vivo correlation between Cherenkov intensity and measured surface dose are still being investigated.
Conclusions:
Cherenkov intensity correlates to relative dose measured at depth of maximum dose in a uniform, flat phantom. Imaging of phantoms can thus be used to analyze and optimize TSET treatment geometry more extensively and rapidly than thermoluminescent dosimeters or ionization chambers. This work suggests that there could be an expanded role for Cherenkov imaging as a tool to efficiently improve treatment protocols and as a potential verification tool for routine monitoring of unique patient treatments.
Keywords: total skin, electron, Cherenkov, Cerenkov, radiotherapy
1. INTRODUCTION
Total skin electron beam therapy (TSET) is an effective treatment for cutaneous lymphomas.1–5 Of the many techniques to deliver TSET,6–10 the most common is the modified Stanford technique, which typically uses two electron beams angled approximately 20° above and below the horizontal plane, while the patient holds six different standing positions, at a source to surface distance (SSD) of at least 300 cm.7,11,12 Regardless of the specific technique selected for TSET, it is recommended that dose be verified with both phantom and in vivo dosimetry.11 Ionization chambers, diodes, thermoluminescent dosimeters (TLDs), and radiochromic films are common methods for measuring dose on phantoms or on patients,12–15 but these are limited to point or small region measurements. Given the complexity of the treatment area in TSET, these verification tools require a large number of measurements, and careful interpretation is critical. In this study, a very practical approach to optimization of the delivery gantry angles was examined with an imaging-based method of dose homogeneity mapping using Cherenkov light imaging.
The main treatment challenge of TSET is the need to deliver a homogenous dose over the entire irregular skin surface, while taking into account unique body shapes and tolerable positions of each individual patient. The European Organization for Research and Treatment of Cancer (EORTC) consensus report acknowledges that “the final position of the patient may be a compromise between patient comfort and some of the lesser dosimetry objectives. It is important that compromise be minimized to reduce the risk of relapse and limit the need for top-up treatments,”15 making the coverage more uncertain in each patient on a daily basis.
It is agreed that minimizing dose heterogeneity (±10%) in the patient standing plane is important for TSET. Therefore, an overall goal in this study was to measure this variation by standard techniques, as well as by a newer method utilizing Cherenkov imaging. The modified Stanford technique does not currently take into account the curvature of each individual patient. Measurements of dose in a single plane, before patient treatment, allow clinicians to treat TSET patients in a standardized method. Any variation in dose from patient-to-patient at specific anatomical areas can be adjusted by boosting any underdosed areas, such as under skin folds or the bottoms of the feet.
It is currently the physician’s responsibility to monitor radiation treatment response by qualitatively evaluating the condition of the disease on the skin, or by periodic TLD measurements during treatment. It is therefore desirable to have a quick and simple method to analyze patient treatment on a regular basis. Ideally, this would be in the form of an in vivo measurement of dose on the entire patient’s surface during treatment. We have begun to explore this possibility using Cherenkov imaging. However, because of the complexities of in vivo dose correlation briefly addressed later in this paper, the focus of this paper is a more immediately attainable goal: rapidly assess the x-y or coronal patient plane to attain maximum dose uniformity on a flat surface prior to patient treatment.
Cherenkov imaging is an emerging modality for visualizing a radiation beam directly on the surface of the patient, where the images are a surrogate for surface dose.16–18 Cherenkov emissions are low intensity light produced by interactions between high energy radiation and dielectric media such as human tissue, which can be captured using specialized cameras and methods;19 photon and electron energies common to modern medical linear accelerators will produce Cherenkov emission that can be detected in this manner.
Cherenkov imaging has already been applied to develop novel quality assurance protocols in water tanks, to visualize the deposited dose build up real-time inside a 3D volume.20,21 It has also been used clinically to image whole-breast radiotherapy, to assess beam tracking, breath motion, and explore in vivo surface dose correlation.16,18,22 In addition, recent studies have looked at using this Cherenkov emission as an excitation source for molecular imaging applications directly on the medical linear accelerator treatment bed.23–25 Applying Cherenkov imaging to unique treatments such as TSET could ensure more homogeneous dose delivery and provide a new method for TSET protocol commissioning.
According to AAPM Report 23, establishing a TSET technique requires measurements of “electron energy, fluence, depth dose, isodose, and x-ray contamination.”11 All of these, except the full 3D volume isodose curves, are generally measured using an ionization chamber or film at the prescription point once the task of selecting the two gantry angles providing the most uniform dose is completed. It is logical to begin by determining the two gantry angles, which provide the least amount of variation in the x-y isodose plane, and then, verifying that the rest of the parameters fall within tolerance at the prescription point.
Measurement of isodose in the x-y plane would generally require individual measurements at a large number of points (76 are shown in AAPM Report 23),11 with either diodes, TLDs, or ionization chambers. Because Cherenkov imaging provides a complete, real-time, 2D digital data set, it is possible to eliminate the redundancy of these measurements and achieve a full assessment with two individual beam images on a flat plane, instead of up to 152 point measurements, for each tested angle pair.
Given the rarity and variety of TSET delivery, it is desirable to optimize the technique in each department, and ideally to verify skin coverage for each daily treatment, in each individual patient given his/her distinctive anatomy and body habitus. With known variability in TLD placement and slight variations in body position, it is particularly challenging to be quantitative about the delivered dose in this treatment. Therefore, there is a need to verify TSET setup geometry for a given treatment room configuration, as well as visualize treatment delivery and skin coverage for individual patients, each day of treatment. In this paper, we have demonstrated the ability of Cherenkov imaging to fill this first role and are continuing research on dosimetrically valuable in vivo Cherenkov imaging of TSET patients.
2. METHODS
2.A. Linac and treatment setup
A Varian CD2100 medical linear accelerator commissioned for patient TSET treatment was used for the phantom studies and verification testing presented in this paper. The system is capable of operating for TSET at 6 MeV electrons only. Because of the energy limitation, patient treatment at our institution is always conducted without an external spoiler. The commissioned treatment follows a modified Stanford technique, whereby the patient is placed in six unique bodily configurations: anterior–posterior, posterior–anterior, right anterior obliques, left anterior obliques, right posterior obliques, and left posterior obliques.
The patient is irradiated with the prescribed dose using two treatment angles intended to provide uniform coverage in the treatment plane. At our institution, the original treatment angle pair was 284.5° and 255.5°, also written as ±14.5° above and below the horizontal, and equivalent to a 29° spread. For clarity, all three angle designations will be given in the paper in parentheses whenever a treatment configuration is mentioned, following the format (±14.5°, 29° spread, 255.5° and 284.5°).
2.B. Cherenkov imaging system
A PIMAX4 1024i (Princeton Instruments, Trenton, NJ, USA) intensified charge-coupled device (ICCD) camera with HRf intensifier was used to acquire all Cherenkov images in this study.19 The HRf intensifier component utilizes a photocathode to convert incoming light photons to electrons, which are multiplied using a microchannel plate, then converted once more into photons after striking a phosphor screen. The amplified light is fiber-coupled with the CCD chip, so that low light signals such as Cherenkov emission can be detected. With this particular device, image resolution was 1024 × 1024 pixels. A 24 mm F/1.8 lens (Sigma Corporation, Ronkonkoma, NY) was used to capture the entire height and width of the patient support structure at the given imaging distance. The camera was mounted on a tripod and placed near the gantry head of the linear accelerator (Varian 2100CD, Varian Medical Systems, Inc., Palo Alto, CA, USA), approximately 4 m from the patient support structure.
The camera was set to maximum intensifier gain, and 500 on-chip accumulations per frame, which produced a frame rate of 1.3 fps. Images were obtained using the software LightField (Princeton Instruments, Trenton, NJ, USA). Room lights were turned off in phantom studies, but left on at a modest level for patient safety and comfort in clinical applications.
Room lights are required to be on in the case of patient imaging so that the treating technicians can maintain a constant visual on the patient through the internal CCTV monitoring system to ensure that the patient remains standing in the correct positions. Since the safety concern is not present in the case of the phantom, room lights were turned completely off to reject the most background light possible. In all cases, the room alignment lasers are turned off during imaging to prevent saturation of the camera.
Imaging with room lights on is possible by microsecond-level time gating. Each image exposure is triggered off of a beam pulse from the linear accelerator and time-gated to the window from 3.0 to 8.0 μs after the trigger pulse. This allows for the synchronization of acquisition with source radiation pulse via signal from the Linac high voltage power supply, and subsequently the Cherenkov photon emission.26
2.C. Image processing
Postprocessing was carried out in matlab (The Mathworks, Inc., Natick, MA, USA). To eliminate noise from stray radiation, as well as any remaining background light, a sequence of image processing steps was followed, as outlined in previous publications.16,27 This processing incorporated background image subtraction, temporal median filtering over 40–50 frames, and spatial median filtering with an 11 × 11 kernel. In order to generate a single image representative of a dual-field treatment, composite Cherenkov images were produced by mathematically summing the noise-removed images of each single treatment beam at two tested gantry angles.
2.D. TSET optimization with Cherenkov imaging
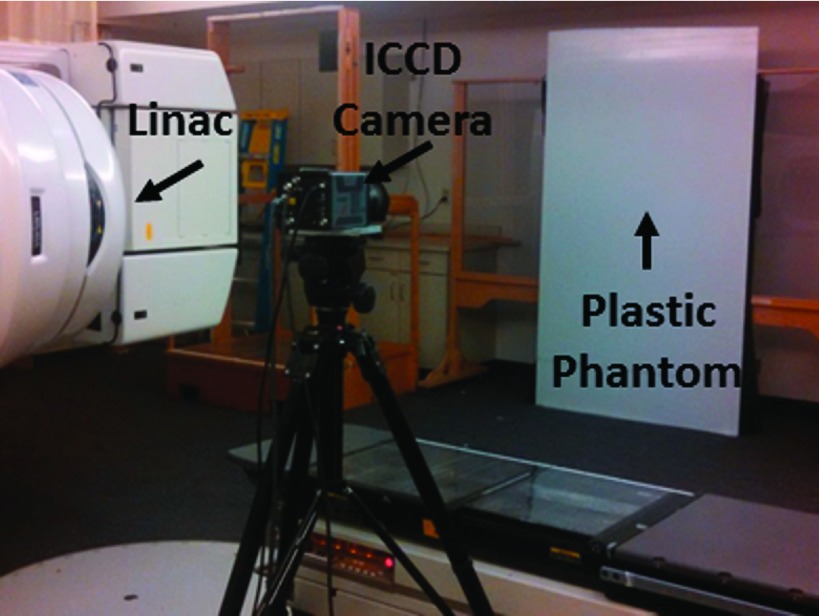
A 1.2 m × 2.2 m × 1 cm sheet of white polyethylene was placed in the x-y treatment plane at a SSD of 441 cm. This plane coincides with the coronal patient plane in the anterior–posterior treatment position, as established by the placement of the wooden patient support structure flush against the wall in the given room geometry. The ICCD was placed near the gantry head approximately 4 m from the phantom, as shown in Fig. 1. A blackout curtain was adhered to the distal side of the plastic sheet to eliminate variations in reflected light from the support structure. To determine the optimal treatment angles, the white polyethylene phantom was irradiated with the TSET beam at 62 gantry angles, from 239.5° to 300.5°, at 1° increments. Fifty frames were acquired at each gantry angle using the same camera settings and postprocessing as described above.
FIG. 1.
Experimental setup for rapid TSET optimization using Cherenkov imaging.
To simulate dual-field treatment, all unique pairs of the 62 images were summed into a composite Cherenkov image, and the resulting 1891 composite images were analyzed. A region of interest (ROI) for analysis was selected through a numerical process using the composite image of the currently prescribed angle pair (±14.5°, 29° spread, 255.5° and 284.5°) as the basis.
In this process, a line profile was extracted from the composite image directly at the center line (column number 512 out of 1024). The peak intensity of this line profile was designated the vertical midpoint, and the upper and lower bounds of the ROI were designated as 400 pixels above the peak and 400 pixels below the peak. These quantities ensured the ROI encompassed the 2 m height span of the patient support structure. The left and right boundaries of the ROI were determined by calculating the full-width half-maximum of the intensity profile formed by the row of pixel values perpendicular to and including the peak intensity determined from the vertical profile, making the entire ROI roughly 800 × 550 pixels, or approximately 2 × 1.4 m.
2.E. Ionization chamber verification
A 30 × 30 × 5 cm slab of standard Solid Water (CMNC Co., Nashville, TN, USA) was milled to fit an Exradin P11 Spokas Parallel Plate Ionization Chamber (Standard Imaging, Middleton, WI, USA). With the ionization chamber embedded in the Solid Water, a 30 × 30 × 1 cm slab of white-surface Plastic Water (CMNC Co., Nashville, TN, USA) was placed over it, to provide a flat, light-colored, and uniform imaging surface. The 1 cm thick Plastic Water also ensured that the ionization chamber measured the radiation beam at depth of maximum dose (1.1 cm, the last 1 mm accounted for by the thickness of the ionization chamber wall). The flat phantom containing the ionization chamber was physically translated across nine positions constituting a 3 × 3 matrix in the patient treatment plane to survey the entire height and width of the plane and irradiated in each position using the original treatment angle pair, as well as the optimized treatment angle pair.
The ionization chamber was also used to verify the percent depth-dose curve remained unchanged with the new treatment angles. With the gantry placed at 270°, the ionization chamber, mounted in the slab of Solid Water, was placed at a SSD of 441 cm. The field projection crosshairs of the gantry were used to ensure the ionization chamber was centered at midline.
The charge measurements were recorded after irradiating with 200 MUs of the prescribed treatment beam at the desired angle pairs (the original as well as the optimized). The ionization chamber was translated away from the source, and slabs of Solid Water were placed in front of the instrument to increase the depth of each exposure reading. The depth of solid water in front of the chamber was increased from 0 to 31 mm in this fashion, while the SSD remained constant, for all subsequent exposure measurements.
2.F. Initial patient imaging trials
Three patients were imaged TSET was delivered per standard institutional protocol using a modified Stanford technique, consisting of six patient positions treated with dual fields, a 6 MeV electron beam, without spoiler, open to maximum field size of 36 × 36 cm (at isocenter), and operating at a dose rate of 888 MU/min. The prescribed total dose was 1800–3600 cGy, delivered in 200 cGy/cycle, with a cycle delivered over two days. Cherenkov imaging of treatment was performed with local IRB approval and informed patient consent. Measurements of surface dose were carried out during TSET following standard procedures using TLD-100 rods (1 mm diameter, 6 mm length) secured to the patient’s skin.
3. RESULTS
3.A. Optimization of TSET
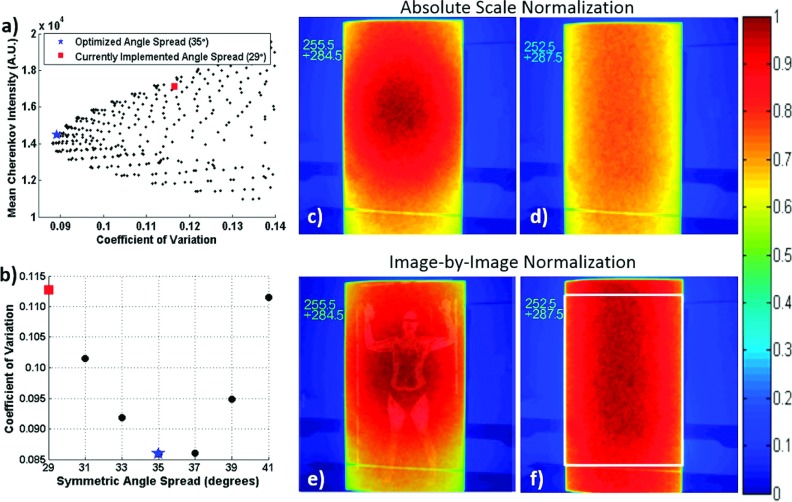
The coefficient of variation was calculated within the defined ROI of each of the 1891 unique composite images and plotted against mean Cherenkov intensity. The minimum coefficient of variation occurred at gantry angles 252.5° and 288.5°. However, a symmetric spread (±17.5°, 35° spread, 252.5° and 287.5°) was chosen as the optimal angle set for simplicity of delivery, because the coefficient of variation was raised by less than 1.2% between the spread exhibiting the true minimum and the symmetric angle minimum [Fig. 2(a)].
FIG. 2.
(a) Mean Cherenkov intensity (relative surface dose) vs coefficients of variation for a subset of angle pairs. The historical angle pair used at the institution (255.5° and 284.5°) is labeled by a red square, and the minimum coefficient of variation at a symmetrical angle pair occurred at 252.5° and 287.5°, denoted by the blue star. (b) Calculated coefficients of variation at symmetric angle spreads. The composite Cherenkov images for the original and optimal angles spreads are shown in (c) and (d), respectively, on the same normalization scale; the self-normalized Cherenkov images are shown in (e) and (f). The image in (e) is overlaid with an image of a TSET patient for size scale. The white box in (e) shows the analyzed ROI.
Figure 2 shows the composite Cherenkov images for treatment delivery on the flat tissue phantom using the original angle pair compared to the optimized angle pair. Increasing the angle spread resulted in more homogenous but decreased dose [Fig. 2(c) compared to Fig. 2(d)], and therefore, more monitor units need to be delivered from each beam of the optimized pair to result in the same prescribed dose. The horizontal line across the bottom of the polyethylene sheet is a piece of medical tape used to mark the height of the bottom platform of the patient support structure.
3.B. Verification of the optimized angles with ionization chamber measurements
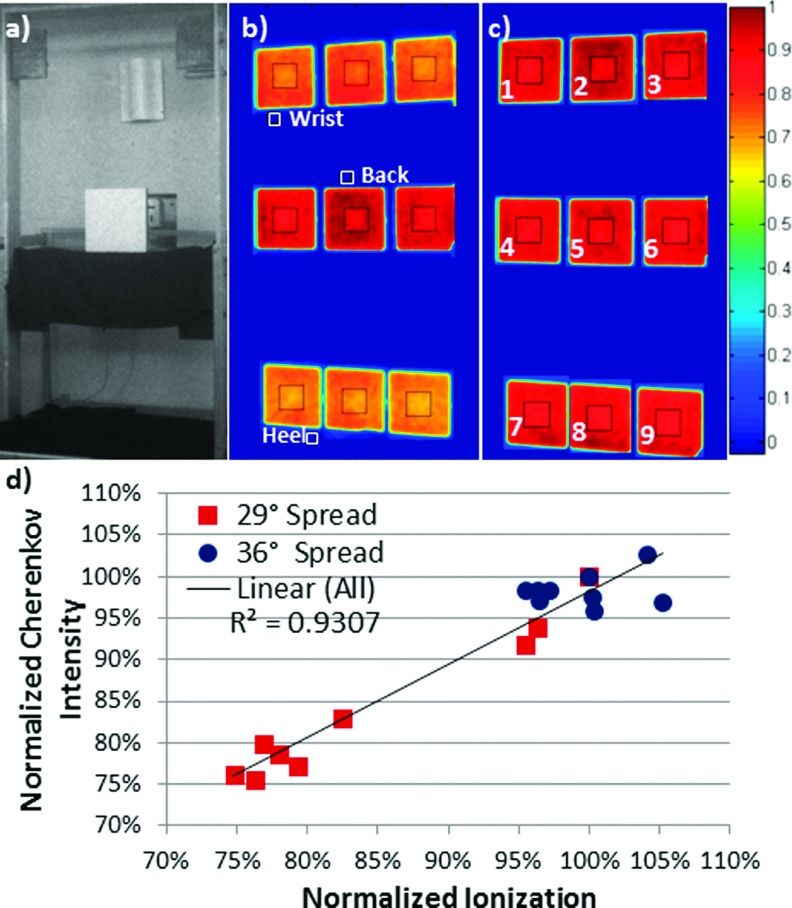
Cherenkov imaging on a flat tissue phantom was confirmed as an accurate surrogate for delivered dose by correlating Cherenkov intensity with dose measured using an ionization chamber at depth of maximum dose. This produced a coefficient of determination R2 = 0.93 [Fig. 3(d)]. Additionally, the heterogeneous dose observed through Cherenkov imaging of the flat phantom at the originally prescribed treatment angles [Figs. 2(c) and 2(e); red squares on Fig. 3(d)] was confirmed by ionization chamber measurements exhibiting variation from 75.6% to 100% of prescribed dose [Figs. 2(b) and 2(d); blue circles on Fig. 3(d)].
FIG. 3.
(a) White light image of the phantom with embedded ionization chamber placed at position 5. (b) Self-normalized, superimposed, composite Cherenkov image of the phantom irradiated with the two fields historically used for treating patients at our institution (255.5° and 284.5°); approximate locations of a patient’s wrist, back, and heel are shown for reference. (c) Cherenkov mage of the phantom irradiated with treatment angles producing minimum coefficient of variation (gantry at 252.5° and 288.5°). (d) Mean Cherenkov intensity calculated from the ROIs outlined in black shown in [(b), red squares] and [(c), blue circles] versus the ionization chamber measurements, at each of the nine positions shown, each normalized to the respective value at position 5 (prescription point). Black square outlines were superimposed on (b) and (c) to illustrate ROI size and placement.
The dose distribution of the optimized treatment geometry was measured using an ionization chamber concurrently with Cherenkov imaging at nine positions to confirm improved homogeneity [Figs. 3(c) and 3(d), blue circles]. Ionization chamber measurements of the optimized treatment angles demonstrated dose heterogeneity ranging from 95.4% to 105.2% of prescribed dose [Fig. 3(d), blue circles], confirming reduction from 24.4% with the original prescribed angles to 9.8% for the Cherenkov-selected optimum treatment angles.
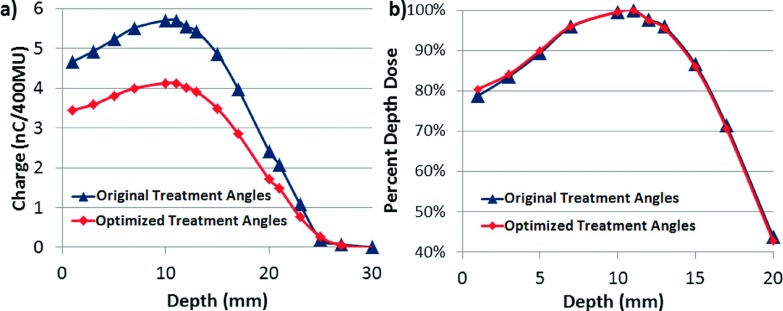
Ionization chamber measurements also confirmed the percent depth-dose curve remained unchanged with the new treatment angles. Figure 4 shows both the relative chamber measurements, as well as the calculated percent depth-dose curves, which provide information on how much dose is changing relatively, as well as about the contribution of x-ray contamination (tail of the curve). The calculations were performed following the stopping power values and equations specified in AAPM Report 32. Dose from the ionization chamber is given by
The percent depth-dose curve was then generated by normalizing to the maximum measured dose (dose at dmax),
FIG. 4.
(a) Ionization chamber charge measurements for increasing depth of Solid Water between the original treatment angles and the selected optimized treatment angles, demonstrating the decrease in relative dose delivered for the new angles. (b) Calculated percent depth dose between the original treatment angles and the optimized treatment angles.
While the depth of maximum dose did not change with the new angles, evidenced by the two data sets exhibiting a determination coefficient of R2 = 0.998, the relative absolute dose does decrease. Measurement of the delivered dose per monitor unit, following AAPM TG-51 Worksheet D, can be used to determine the appropriate scaling of monitor units to achieve the same prescription dose on a machine-by-machine basis.
3.C. Varying room geometry
To extend our findings to treatment rooms with more restrictive space, an equation for SSD-dependent optimal angle spread was identified. Analysis of the composite Cherenkov images of the polyethylene sheet placed at SSDs of 300, 370.5, and 441 cm support a linear relationship between angle spread and SSD, as shown in Fig. 5. Angle spread can be chosen for a given SSD following the equation,
FIG. 5.
Linear dependence of optimal angle spread on the SSD, using symmetric angle pairs. Images were acquired using 1° increments.
3.D. In vivo Cherenkov TSET imaging
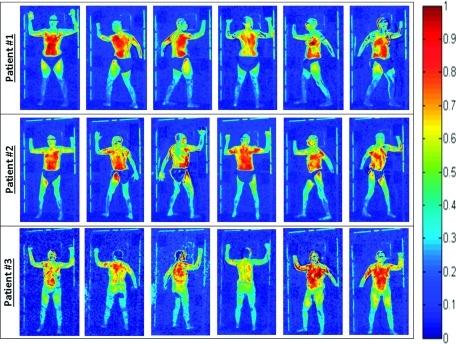
Initially, two patients receiving TSET following the established clinical protocol were imaged with the Cherenkov system. The composite Cherenkov images for both patients in each of the six treatment positions are shown in Fig. 6 (rows 1 and 2). All 12 images indicated that the torso region exhibited a higher Cherenkov emission intensity compared to the legs and feet.
FIG. 6.
Composite Cherenkov images for three patients in the six Stanford technique treatment positions. All images are represented on the same color scale. Patients #1 and #2 were treated with angle spread of 29° at SSD = 441 cm and were wearing cloth shorts. Patient #3 was treated with angle spread of 35° at SSD = 441 cm, sitting on a bicycle seat for patient stabilization (no cloth shorts).
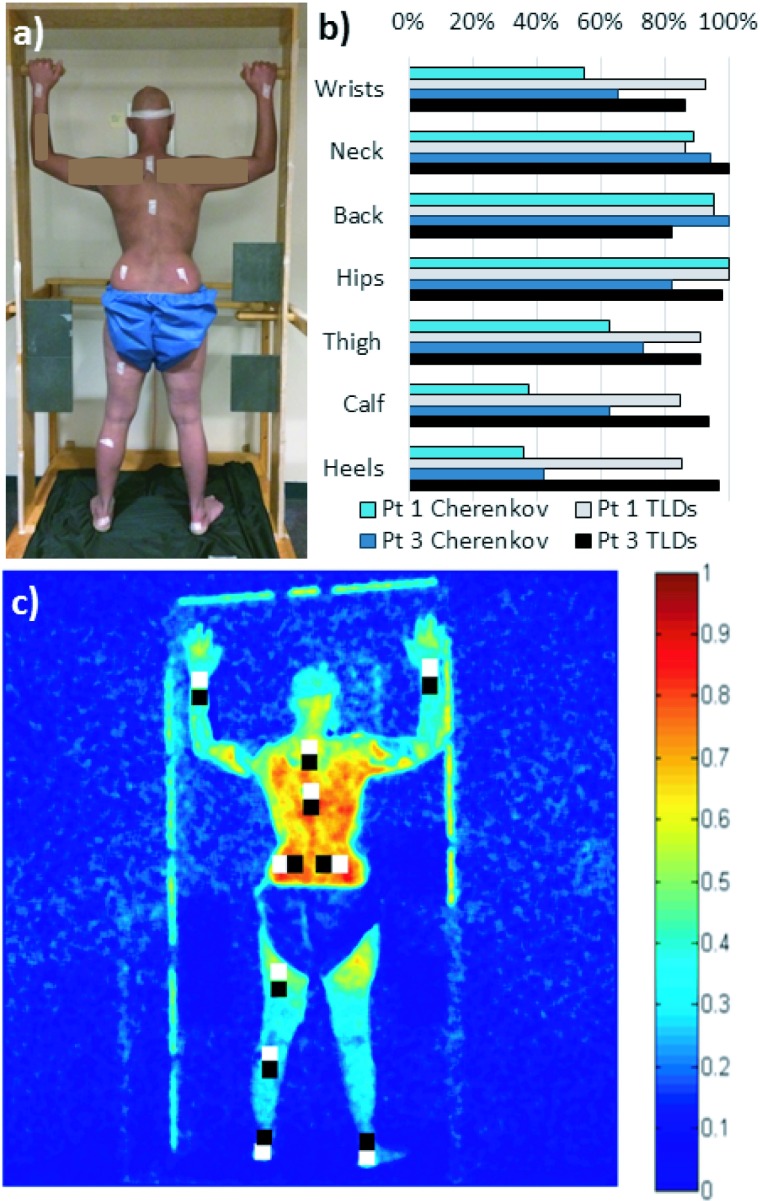
This observation was further investigated using TLD measurements on patient #1 in a single position (posterior), while dual treatment fields were delivered using the original treatment geometry (±14.5°, 29° spread, 255.5° and 284.5°), shown in Fig. 7. The TLD measurements [Fig. 7(b)] also indicated a higher surface dose in the torso (95%–100% of measured dose normalized to the maximum recorded in the posterior position) compared to the legs and feet (85%–91% of the normalized dose). The in vivo Cherenkov emission intensities showed an even larger variation, likely due to differences in patient and tissue-specific optical properties, which are still being investigated.
FIG. 7.
(a) Placement of ten TLDs on patient #1 (posterior position only). TLDs were also placed on patient #3 in similar approximate positions. (b) Plot comparing average Cherenkov intensity of ROIs directly on top of the TLD with the measured dose from the TLDs. Each data set is normalized to its respective highest measurement (at the hips). Measurements on opposing wrists and opposing heels are each averaged together for display clarity. Data from patients #1 and #3 are shown for comparison, although images (a) and (c) correspond to patient #1 only. (c) The two sets of ten 25 × 25 pixel regions of interest (ROIs) were analyzed for average Cherenkov intensity on patient #1. The white regions are directly on top of the tape affixing the TLDs, and the black regions are offset from the taped regions. There was no statistically significant difference between the mean Cherenkov intensity in the black and white labeled regions; the white labeled regions were used in (b).
All three methods of dose measurement (TLDs, ionization chamber, and Cherenkov intensity) indicated that the original prescribed treatment geometry produced heterogeneous treatment dose that could be reduced to less than 10% with the optimized treatment angles. After extensive verification, the new angle spread of (±17.5°, 35° spread, 252.5° and 287.5°), as opposed to (±14.5°, 29° spread, 255.5° and 284.5°), at a SSD of 441 cm was adopted clinically, and a third patient was treated using the new angles (Fig. 6, row 3). The Cherenkov images of the patient treated with the optimized angles are compared to the previously imaged patient who was treated with the original geometry (Fig. 6). Repeating the TLD measurements made on patient #1, surface dose was measured for the straight-on posterior treatment beam pair for patient #3, using the optimized beam angles. TLDs in ten positions on patient #3 had a range of 19% of the average dose value, 7% less than the 26% range observed in patient #1 before angle optimization took place, corroborating a more uniform clinical dose distribution.
4. DISCUSSION
Cherenkov imaging allows for observation of an optical analog of treatment delivery on a surface as a 2D image. It offers an advantage over other beam imaging technologies, such as flat panel detectors, which are limited in the scope of the measurement and by the physical size of the detectors themselves. TLDs, diodes, and ionization chambers are all useful beam characterization tools, but offer only point measurements with limited implementation for whole body dosimetry. In contrast, Cherenkov imaging uses a camera system to passively capture the data generated by the radiation and the volume being irradiated, and so the field of view and data quality are defined largely by the lens system and camera used. Therefore, this method is capable of observing a large treatment field, as in the case of TSBET, by choice of appropriate lens focal length and camera distance.
This also translates into a time advantage by permitting a more rapid and extensive optimization than would be feasible with other modalities, since each pixel in the image can be thought of as an independent measurement provided by a TLD or ionization chamber reading. For example, ionization chambers would require at least 9 point measurements to canvas the entire TSET field at each individual angle tested, thus each beam would need to be repeatedly delivered nine times to capture a fraction of the information collected from a single beam with Cherenkov imaging.
Similarly, while a set of TLDs could be used to measure many points in the field simultaneously, the time for postprocessing makes TLDs too onerous to analyze even a modest subset of gantry angle combinations. Alternatively, there are systems capable of supporting large numbers of diodes to assess similar large fields; however, in addition to much lower measurement resolution (they are still each point detectors), these systems require care in calibration due to angle and energy dependencies.
While a 62° span of gantry angles was considered for completeness in the original study presented here, it would be reasonable to limit future calibration imaging following this method to a smaller subset of possible angles. Both literature and the results of this study support looking at angles between ±15° and ±20° (spreads between 30° and 40°).
Past research has demonstrated a strong correlation between Cherenkov intensity and measured surface dose from flat, homogeneous phantoms,22 a correlation reinforced by the results presented here. Cherenkov imaging successfully determined the most homogenous combined beam geometry as a function of SSD, and a linear relationship was observed. These measurements are intended to provide general guidance for other institutions, with further verification of the beam field using ionization chamber measurements. While the new treatment angles did not appreciably alter the depth of maximum dose, the increase in angle spread from the previously implemented angles did cause a relative decrease in delivered dose per monitor unit. Either decreasing the SSD and adjusting gantry angles accordingly or increasing the number of MUs delivered will compensate for the decrease in dose caused by increasing the gantry angle spread.
X-ray or bremsstrahlung contamination is frequently brought up in regards to TSET, because these photons can deposit dose deeper than skin level. While the Cherenkov imaging method does not provide a method to directly measure the contribution of x-ray contamination, it is not regarded as a significant problem at typical TSET energies of 6 and 9 MeV; bremsstrahlung is more extensive in smaller fields at much higher electron energies, such as 20 MeV.28,29 Extensive studies have been conducted by other groups where the electron portion of the beam is magnetically steered from the main beam path so that only the bremsstrahlung can be measured; these have concluded the dose due to bremsstrahlung photons from 6 MeV TSET beam accounts for less than 1% of the total dose, often on the order of 0.2%, when using a properly designed setup.30,31
For many institutions, it is more feasible to use the depth-dose measurements from an ionization chamber to acquire a sense of the x-ray contamination for any particular TSET angle pair.32 Figure 4 clearly shows that the x-ray contamination between the two different treatment geometries compared are nearly the same and less than 1%, which follows suggested guidelines. Since x-ray contamination is most prevalent on the central axis of the beam,28 following the general rule to choose TSET beam angles where the beam axis does not intersect with the patient is desirable.11 The optimized treatment angles selected by the Cherenkov imaging method presented in this paper satisfy that criteria.
In this paper, Cherenkov imaging was also used to monitor treatment delivery of three patients receiving TSET. Despite the quantitative correlation between phantom images and ionization chamber measurements, localized Cherenkov intensities in patients did not strongly correlate to absolute surface dose as measured by a set of 10 TLDs for the beams treating in the straight-on posterior position only. However, there was general agreement than the surface dose in the hands and feet was less than the surface dose in the torso between the two methods. In addition, the TLD measurements from the optimized treatment on patient #3 had less variation than the TLD measurements from the original treatment setup used on patient #1, supporting a more homogeneous treatment geometry.
The relationship between dose uniformity in phantom studies as compared to TSET patients is a known issue described in AAPM TG-30 Report 23, which states that “the uniformity of dose achieved in phantom studies in the treatment plane cannot be reproduced over the patient... due to variable skin distance, self-shielding, and patient motion.”11 This, along with anatomical heterogeneities of the imaged patient volumes, is thought to be the cause of the disparity between the Cherenkov intensity from patients and the measured surface dose. Current work to correct for tissue optical properties is ongoing, which should result in better correlation of Cherenkov emission intensity with absolute surface dose in patients.
Improving delivered dose homogeneity has an important implication for TSET with lower dose schedules, which is a new trend in order to spare toxicity of treatment, and to allow repeated delivery of TSET.33 When treating with these dose-reduced schedules, it seems prudent to verify dose homogeneity to ensure areas of disease are not underdosed, which could lead to early failures.
5. CONCLUSION
The hypothesis that Cherenkov imaging could be used to verify TSET treatment geometry faster and more extensively than established modalities was supported by the results of this study, and a novel technique for evaluating beam homogeneity for large fields using Cherenkov imaging of phantoms was presented. A linear relationship between angle spread optimized for a homogeneous dual-field and treatment SSD was observed. The angles which produce the most homogenous field can be adopted by other institutions after dose calibration.
ACKNOWLEDGMENTS
This study has been funded by NIH Grant Nos. R21EB17559 and R01CA109558 as well as Norris Cotton Cancer Center Pilot funding.
REFERENCES
- 1.Navi D., Riaz N., Levin Y. S., Sullivan N. C., Kim Y. H., and Hoppe R. T., “The Stanford University experience with conventional-dose, total skin electron-beam therapy in the treatment of generalized patch or plaque (T2) and tumor (T3) mycosis fungoides,” Arch. Dermatol. 147(5), 561–567 (2011). 10.1001/archdermatol.2011.98 [DOI] [PubMed] [Google Scholar]
- 2.De Moraes F. Y., Carvalho H. D. A., Hanna S. A., Da Silva J. L. F., and Marta G. N., “Literature review of clinical results of total skin electron irradiation (TSEBT) of mycosis fungoides in adults,” Rep. Pract. Oncol. Radiother. 19(2), 92–98 (2014). 10.1016/j.rpor.2013.08.003 [DOI] [PMC free article] [PubMed] [Google Scholar]
- 3.Bagshaw M. A., Schneidman H. M., Farber E. M., and Kaplan H. S., “Electron beam therapy of mycosis fungoides,” Calif. Med. 95(5), 292–297 (1961). [PMC free article] [PubMed] [Google Scholar]
- 4.Lo T. C., Salzman F. A., Moschella S. L., Tolman E. L., and Wright K. A., “Whole body surface electron irradiation in the treatment of mycosis fungoides. An evaluation of 200 patients,” Radiology 130, 453–457 (1979). 10.1148/130.2.453 [DOI] [PubMed] [Google Scholar]
- 5.Micaily B., Vonderheid E. C., Brady L. W., and Andrews C., “Beam and total nodal irradiation for T-Cell lymphoma,” Int. J. Radiat. Oncol., Biol., Phys. 11, 1111–1115 (1985). 10.1016/0360-3016(85)90057-4 [DOI] [PubMed] [Google Scholar]
- 6.Kim T. H., Pla C., Pla M., and Podgorsak E. B., “Clinical aspects of a rotational total skin electron irradiation,” Br. J. Radiol. 57, 501–506 (1984). 10.1259/0007-1285-57-678-501 [DOI] [PubMed] [Google Scholar]
- 7.Karzmark C. J., Loevinger R., Steele R. E., and Weissbluth M., “A technique for large-field, superficial electron therapy,” Radiology 74, 633–644 (1960). 10.1148/74.4.633 [DOI] [PubMed] [Google Scholar]
- 8.Chen Z., Agostinelli A. G., Wilson L. D., and Nath R., “Matching the dosimetry characteristics of a dual-field Stanford technique to a customized single-field Stanford technique for total skin electron therapy,” Int. J. Radiat. Oncol., Biol., Phys. 59(3), 872–885 (2004). 10.1016/j.ijrobp.2004.02.046 [DOI] [PubMed] [Google Scholar]
- 9.Fuse H., Suzuki K., Shida K., Mori Y., Takahashi H., Kobayashi D., Seki M., Isobe T., Okumura T., Sakae T., and Sakurai H., “Total skin electron beam therapy using an inclinable couch on motorized table and a compensating filter,” Rev. Sci. Instrum. 85(6), 064301 (2014). 10.1063/1.4882336 [DOI] [PMC free article] [PubMed] [Google Scholar]
- 10.Piotrowski T. and Malicki J., “The rotary dual technique for total skin irradiation in the treatment of mycosis fungoides—A description of the applied method,” Rep. Pract. Oncol. Radiother. 11(1), 29–37 (2006). 10.1016/S1507-1367(06)71047-1 [DOI] [Google Scholar]
- 11.Karzmark C. J., Anderson J., Buffa A., Fessenden P., Khan F., Svensson G., and Wright K., “Total skin electron therapy: Technique and dosimetry,” Report of the American Association of Physicists in Medicine (AAPM) Task Group 30, AAPM Report No. 23, Medical Physics Publishing, Madison, WI, 1987.
- 12.Bloemen-van Gurp E. J., Mijnheer B. J., Verschueren T. A. M., and Lambin P., “Total body irradiation, toward optimal individual delivery: Dose evaluation with metal oxide field effect transistors, thermoluminescence detectors, and a treatment planning system,” Int. J. Radiat. Oncol., Biol., Phys. 69(4), 1297–1304 (2007). 10.1016/j.ijrobp.2007.07.2334 [DOI] [PubMed] [Google Scholar]
- 13.Schiapparelli P., Zefiro D., Massone F., and Taccini G., “Total skin electron therapy (TSET): A reimplementation using radiochromic films and IAEA TRS-398 code of practice,” Med. Phys. 37, 3510–3517 (2010). 10.1118/1.3442301 [DOI] [PubMed] [Google Scholar]
- 14.Gamble L. M., Farrell T. J., Jones G. W., and Hayward J. E., “Two-dimensional mapping of underdosed areas using radiochromic film for patients undergoing total skin electron beam radiotherapy,” Int. J. Radiat. Oncol., Biol., Phys. 62(3), 920–924 (2005). 10.1016/j.ijrobp.2005.02.057 [DOI] [PubMed] [Google Scholar]
- 15.Guidi G., Gottardi G., Ceroni P., and Costi T., “Review of the results of the in vivo dosimetry during total skin electron beam therapy,” Rep. Pract. Oncol. Radiother. 19(2), 144–150 (2014). 10.1016/j.rpor.2013.07.011 [DOI] [PMC free article] [PubMed] [Google Scholar]
- 16.Zhang R., Gladstone D. J., Jarvis L. A., Strawbridge R. R., Jack Hoopes P., Friedman O. D., Glaser A. K., and Pogue B. W., “Real-time in vivo Cherenkoscopy imaging during external beam radiation therapy,” J. Biomed. Opt. 18(11), 110504 (2013). 10.1117/1.JBO.18.11.110504 [DOI] [PMC free article] [PubMed] [Google Scholar]
- 17.Jarvis L. A., Zhang R., Gladstone D. J., Jiang S., Hitchcock W., Friedman O. D., Glaser A. K., Jermyn M., and Pogue B. W., “Cherenkov video imaging allows for the first visualization of radiation therapy in real time,” Int. J. Radiat. Oncol., Biol., Phys. 89(3), 615–622 (2014). 10.1016/j.ijrobp.2014.01.046 [DOI] [PubMed] [Google Scholar]
- 18.Zhang R., Andreozzi J. M., Gladstone D. J., Hitchcock W. L., Glaser A. K., Jiang S., Pogue B. W., and Jarvis L. A., “Cherenkoscopy based patient positioning validation and movement tracking during post-lumpectomy whole breast radiation therapy,” Phys. Med. Biol. 60(1), L1–L14 (2015). 10.1088/0031-9155/60/1/L1 [DOI] [PMC free article] [PubMed] [Google Scholar]
- 19.Andreozzi J. M., Zhang R., Glaser A. K., Jarvis L. A., Pogue B. W., and Gladstone D. J., “Camera selection for real-time, in vivo radiation treatment verification systems using Cherenkov imaging,” Med. Phys. 42(2), 994–1004 (2015). 10.1118/1.4906249 [DOI] [PMC free article] [PubMed] [Google Scholar]
- 20.Glaser A. K., Andreozzi J. M., Zhang R., Pogue B. W., and Gladstone D. J., “Optical cone beam tomography of Cherenkov-mediated signals for fast 3D dosimetry of x-ray photon beams in water,” Med. Phys. 42(7), 4127–4136 (2015). 10.1118/1.4922135 [DOI] [PMC free article] [PubMed] [Google Scholar]
- 21.Glaser A. K., Andreozzi J. M., Davis S. C., Zhang R., Pogue B. W., Fox C. J., and Gladstone D. J., “Video-rate optical dosimetry and dynamic visualization of IMRT and VMAT treatment plans in water using Cherenkov radiation,” Med. Phys. 41(6), 062102 (9pp.) (2014). 10.1118/1.4875704 [DOI] [PMC free article] [PubMed] [Google Scholar]
- 22.Zhang R., Glaser A. K., Gladstone D. J., Fox C. J., and Pogue B. W., “Superficial dosimetry imaging based on Čerenkov emission for external beam radiotherapy with megavoltage x-ray beam,” Med. Phys. 40(10), 101914 (12pp.) (2013). 10.1118/1.4821543 [DOI] [PMC free article] [PubMed] [Google Scholar]
- 23.Lewis M. A., Kodibagkar V. D., Öz O. K., and Mason R. P., “On the potential for molecular imaging with Cerenkov luminescence,” Opt. Lett. 35(23), 3889–3891 (2010). 10.1364/OL.35.003889 [DOI] [PMC free article] [PubMed] [Google Scholar]
- 24.Glaser A. K., Zhang R., Andreozzi J. M., Gladstone D. J., and Pogue B. W., “Cherenkov radiation fluence estimates in tissue for molecular imaging and therapy applications,” Phys. Med. Biol. 60(17), 6701–6718 (2015). 10.1088/0031-9155/60/17/6701 [DOI] [PMC free article] [PubMed] [Google Scholar]
- 25.Zhang R., Alisha V. D., Gunn J. R., Esipova T. V., Vinogradov S. A., Glaser A. K., Jarvis L. A., Gladstone D. J., and Pogue B. W., “Cherenkov-excited luminescence scanned imaging,” Opt. Lett. 40(5), 827–830 (2015). 10.1364/OL.40.000827 [DOI] [PubMed] [Google Scholar]
- 26.Glaser A. K., Zhang R., Davis S. C., Gladstone D. J., and Pogue B. W., “Time-gated Cherenkov emission spectroscopy from linear accelerator irradiation of tissue phantoms,” Opt. Lett. 37(7), 1193–1195 (2012). 10.1364/OL.37.001193 [DOI] [PMC free article] [PubMed] [Google Scholar]
- 27.Archambault L., Briere T. M., and Beddar S., “Transient noise characterization and filtration in CCD cameras exposed to stray radiation from a medical linear accelerator,” Med. Phys. 35(10), 4342–4351 (2008). 10.1118/1.2975147 [DOI] [PMC free article] [PubMed] [Google Scholar]
- 28.Holt J. G., “Some physical considerations in whole skin electron beam therapy,” Med. Phys. 9(5), 769–776 (1982). 10.1118/1.595135 [DOI] [PubMed] [Google Scholar]
- 29.Gur D., “Photon contamination in 8–20-MeV electron beams from a linear accelerator,” Med. Phys. 6(2), 145–146 (1999). 10.1118/1.594525 [DOI] [PubMed] [Google Scholar]
- 30.Morgan J. E. and Dowdy A. H., “Some problems peculiar to electron therapy,” Radiology 81, 317–319 (1963). 10.1148/81.2.317 [DOI] [PubMed] [Google Scholar]
- 31.J. H. Grollman, Jr., Bierman S. M., Morgan J. E., and Ottoman R. E., “X-ray contamination in total-skin electron therapy of lymphoma cutis and exfoliative dermatitis!,” Radiology 85, 356–360 (1964). 10.1148/85.2.356 [DOI] [PubMed] [Google Scholar]
- 32.Kahn F. M. and Gibbons J. P., The Physics of Radiation Therapy (Lippincott Williams and Wilkins, Philidelphia, PA, 2014). [Google Scholar]
- 33.Hoppe R. T., Harrison C., Tavallaee M., Bashey S., Sundram U., Li S., Million L., Dabaja B., Gangar P., Duvic M., and Kim Y. H., “Low-dose total skin electron beam therapy as an effective modality to reduce disease burden in patients with mycosis fungoides: Results of a pooled analysis from 3 phase-II clinical trials,” J. Am. Acad. Dermatol. 72(2), 286–292 (2015). 10.1016/j.jaad.2014.10.014 [DOI] [PubMed] [Google Scholar]


