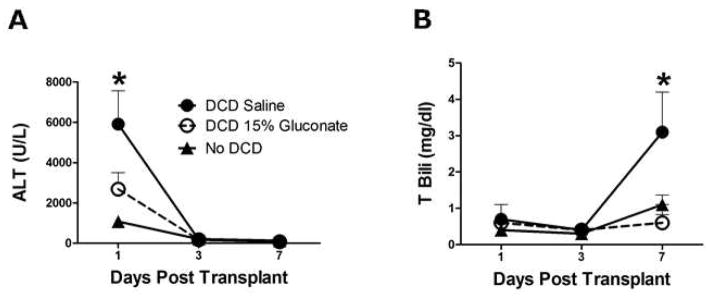
Figure 6.
Plasma ALT (panel A) and total bilirubin (panel B) values from rat liver transplant recipients after transplantation. The three groups include livers with 20 h of cold storage alone (no DCD), livers cold stored following 30 min of warm ischemia (DCD), and livers cold stored following 30 min of warm ischemia with gluconate given prior to warm ischemia (DCD 15% gluconate). Values represent mean ± SD, n=6 per group, * P<0.05 between all groups (panel A) and between DCD and the other groups (panel B).

