

Abstract
Intrinsically disordered regions of proteins can gain structure by binding to a partner. This process, of coupled folding and binding, is a fundamental part of many important biological processes. Structure-based models have proven themselves capable of revealing fundamental aspects of how coupled folding and binding occurs, however typical methods to enhance the sampling of these transitions, such as replica exchange, do not adequately sample the transition state region of this extremely rare process. Here we use a variant of Umbrella Sampling to enforce sampling of the transition states of coupled folding and binding of HdeA monomers at neutral pH, an extremely rare process that occurs over timescales ranging from seconds to hours. Using high resolution sampling in the transition state region we cluster states along the principal transition path to obtain a detailed description of coupled binding and folding for the HdeA dimer, revealing new insight into the ensemble of states that are accessible to client recognition. We then demonstrate that exchanges between umbrella sampling windows, as done in previous work, significantly improve relaxation in variables orthogonal to the restraints used. Altogether, these results show that Window Exchange Umbrella Sampling (WEUS) is a promising approach for systems that exhibit flexible binding, and can reveal transition state ensembles of these systems in high detail.
I. Introduction
A broad class of proteins do not fold to a stable 3D structure by themselves; they are either wholly intrinsically disordered, or have large disordered regions. Often, these disordered elements gain structure when bound to a partner, folding and binding concomitantly.1 Coupled folding and binding (CFaB) is an important phenomenon, involved in many cellular processes such as the regulation of transcription, signal transduction, protein phosphorylation, and the regulation of large macromolecular assemblies such as the ribosome.2 For α-synuclein, CFaB to lipid membranes is involved in synaptic regulation, and is implicated in Parkinson's disease.3
The reverse process – coupled unfolding and unbinding – occurs during the activation of the HdeA chaperone at low pH.4–9 HdeA exists in the periplasm of Gram-negative bacteria and converts from a stably folded dimer at high pH to a disordered monomeric form at low pH. The low-pH form is able to interact with other unfolded or misfolded proteins, acting as a chaperone to prevent aggregation due to acid stress. HdeA also facilitates recovery after acid shock by releasing substrate and returning to its folded dimer form,7 and the amphiphilic nature of HdeA (hydrophobic center with charged termini) helps keep HdeA-substrate dimers soluble.6
Although CFaB is of strong interest, a detailed view of this process is difficult to obtain using computational modeling approaches. The high entropic cost associated with disorder-to-order transitions is usually paid for by a favorable enthalpic contribution,2 resulting in a deep energy minimum in the bound state that is difficult to escape. Binding and unbinding processes, as well as exchange between bound poses, can be slow, on the range of 1 to 10 s−1 for α-synuclein.3 For HdeA, acid-induced dissociation occurs at a rate of 8.0 s−1, and this extends to hours for dissociation at neutral pH.10 Although progress is being made observing the binding of small molecules or peptides using all-atom molecular dynamics,11–14 CFaB is beyond the reach of this approach. Structure-based coarse-grained (CG) models (such as Gō-like models15) that use single beads for each amino-acid have had considerable success in this area. They have elucidated fundamental features of CFaB, such as: how the topography of the global energy landscape affects binding and folding;16 the role of electrostatic interactions;17 and the role of non-native interactions and dihedral angle corrections.18 It has been shown repeatedly that these CG models can achieve general agreement with experiment as to whether folding occurs in a “two-state” or “three-state” fashion.19–21 Kim and Hummer showed in 2008 that CG models can make quantitative connections to experiment using the second virial coefficient.22 We have recently shown that CG models can be used to describe pH dependent interactions in HdeA.23
Even CG models are not sufficient by themselves to study long-timescale CFaB events. An enhanced sampling algorithm, most commonly replica exchange,24,25 is often used in conjunction with coarse-graining8,17,19,22 to efficiently obtain binding affinities. A known problem experienced with replica exchange (including in our own work8) is the segregation of walkers in temperature: high temperature monomers get stuck in the high energy basin (in this case, the monomeric ensemble), and low-temperature monomers get stuck in the low-energy basin (the dimer ensemble). This is particularly a problem for systems with sharp phase transitions in temperature, such as protein folding.26 Although replica exchange can obtain accurate free energy differences between these basins by combining sampling of all replicas using the Weighted Histogram Analysis Method (WHAM),27 the sampling of the transition state region is often poor, and mechanistic information can be difficult to obtain.
Motivated by this problem, we set out to find a suitable method to thoroughly sample the transition state region of CFaB events. Umbrella Sampling28 is ideal for this purpose, as it can use external potentials to restrict walkers to a given value along an order parameter. Section II describes our approach, which uses two sets of contacts, one intramolecular and one intermolecular, along which umbrella sampling restraint potentials are set up using the DMC facility in CHARMM.29,30 The entire free energy landscape, including monomer and dimer conformations, can then be constructed using WHAM. In order to improve sampling convergence, we employ an exchange criterion, where adjacent windows can swap conformations according to a Metropolis Monte Carlo exchange probability, as done previously.31–35 This flavor of Umbrella Sampling has been referred to as Window Exchange Umbrella Sampling (WEUS)33, and has been shown to dramatically improve relaxation in degrees of freedom that are orthogonal to the applied restraints. We show below that this is also the case in our CFaB example, using the nonequilibrium relaxation of a symmetric quantity (the difference in structure between the monomers). We also describe how a progressive initialization technique36 can be used in this method when suitable starting conformations for each window are not available. Section IIIA verifies our approach using a test system – the helix-helix interface of the HdeA dimer – where the dissociation constant (Kd) can be determined directly. In Section III B we apply this approach to the CFaB of HdeA, obtaining excellent resolution in the difficult to sample transition state region. Using a clustering approach, we then determine a set of main states along the principal transition pathway and describe the process in detail, obtaining new insight into partially unfolded structures that could be active for binding unfolded substrates during acid stress.
II. Methods
A. Simulation setup
We model the HdeA homodimer (PDB ID:1BG837). This protein consists of 89 amino acids in each monomer, 76 of which are resolved in the crystal structure, and are modeled here. In our simulations, we use a coarse-grained representation (a Gō-like model15) in which each residue is described by a single sphere, and there are attractive interactions between residues that are close together in the native state. The model is constructed using the Gō model builder offered by the MMTSB tool set.38 The dimer is built as in our previous work,8 using subunit C and its image, such that the interactions within and between each monomer are identical. The disulfide bond between residues C18 and C66 is modelled using a distance restraint of 4.8 Å, with a strength of 378 kcal/mol/Å2.
Dynamics are performed using CHARMM.30 A Langevin integrator is used with a 20 fs time step, and a friction coefficient of 0.2 ps−1. A 12-10-6 van der Waals-like potential is used. The SHAKE algorithm is used to constrain all bonds, with a tolerance of 10−8. To prevent interactions through the periodic boundary we restrain the center of mass of monomer A to the center of the periodic box, using a harmonic restraint of strength 100 kcal/mol. For simulations of the helix-helix interactions, we use a 40 Å box size, while for the full HdeA dimer we use a 120 Å box size, which corresponds to a monomer concentration of 1.92 mM, and is sufficiently large in practice to ensure the monomers do not interact through the periodic boundaries, even when both monomers are unfolded in solution. For the nonbonded interactions we use a 25 Å cutoff.
B. Distance matrix restraints
Distance matrix restraints can be set with the DMC facility in CHARMM,29 and provide a harmonic biasing force that restrains sampling in the neighborhood of a given fraction of residue-residue contacts (fi). The energy of this biasing force is given by:
| (1) |
where FB is a biasing force in units of kcal/mol, and ϕ(X) is the fraction of contacts satisfied in a given conformation X. The contact fraction ϕ(X) is continuous:
| (2) |
where Nc is the number of contacts, di is the distance between residues in contact i, and ci is equal to the cutoff for that contact plus 1.25 Å. Here, the cutoffs are set to the inter-residue distances in the crystal structure, and the constant k is set to 20 Å−1.
These windows can be used for Umbrella Sampling by defining a set of restraint potentials that span a range of fi values. Here we define restraint potentials along two sets of contacts (intramolecular and intermolecular), defining a two-dimensional grid of windows that span the space from (fintra, finter) = (0,0) for unfolded monomers to (fintra, finter) = (1,1) for folded dimers. This necessitated modifications to the DMC facility in the CHARMM source code to allow for multiple distance matrix constraints, as well as to set a unique distance cutoff for each contact. We use 20 windows along each sampling coordinate, for 400 windows total, and these are evenly distributed from 0 to 1 along both fintra and finter.
C. Window exchange umbrella sampling implementation
The trajectories, together with the exchanges, are managed using an in-house Perl script that launches instances of CHARMM (referred to here as “workers”), sends them input commands on-the-fly, and reads their output. This allows the Perl script to use any worker to run dynamics starting from any structure, using any biasing potential. We start the simulations with a single active window in the folded dimer region, and this activates the other windows over the course of the simulation as described below. At the end of our simulations, all 400 sampling windows are active. In each sampling “cycle”, we run a trajectory fragment in each active window, of time-length 200 ps, or 10000 dynamics steps. This is accomplished by assigning windows to each free worker until all the active windows have been simulated. This approach gives us significant flexibility: the number of workers can be much smaller than the number of sampling windows, and simulations are also robust to worker failure.
Following the dynamics, exchanges are then attempted between neighboring windows that are either adjacent in fintra or finter. The total number of exchange attempts is equal to the number of active windows, and each attempt proceeds as follows. First, an active window (A) and a neighboring window (B) are chosen at random. If B is active, the conformations XA and XB are swapped according to the Metropolis criterion:
| (3) |
where Vi(Xj) is the potential energy of conformation j in window i. If window B is not yet active, then it becomes activated, using XA as an initial conformation, with probability:
| (4) |
In this way, we initialize the simulation using only the folded, dimer structure, and all 400 windows become active over the course of the simulation. For the full HdeA simulations we employ 32 workers, each on a single CPU, and achieve around 500 cycles per day of wall-clock time.
D. Weighted histogram analysis method
To remove the effect of the biasing potentials, and obtain unbiased weights for each frame in our simulations, we use the Weighted Histogram Analysis Method (WHAM).27,39,40 In WHAM, an unbiased probability distribution is obtained using a set of simulations that are performed using potential energy functions of the form (U(X) + Wi(X)), where U is the normal potential energy and Wi is the biasing potential energy function in the i-th window. Unbiased probabilities for each frame are then obtained using the relationship
| (5) |
where Xi,l is the l-th frame of the i-th simulation, N is the number of windows, nj is the number of frames sampled in window j, and fj is a biasing free energy for window j that is obtained using the set of equations:
| (6) |
for each k. In practice, the set of fk values are determined self-consistently by iteratively solving Eq. (6). See Souaille and Roux41 for a derivation of Equations 5 and 6.
To obtain the dissociation constant, we obtain the total probability of the dimer state:
| (7) |
where H(x) is the Heaviside step function and c0 is a cutoff demarcating monomer and dimer states equal to 1/ninter, which designates all structures with at least one intermolecular contact as a dimer. The dissociation constant is then obtained as Kd = Ctot(1 − Pdimer)2/Pdimer, where Ctot is the total monomer concentration of protein in our simulations.
III. Results
A. Helix-helix association
To verify our approach we first test it using a system that contains both intra- and intermolecular contacts, yet is small enough to obtain converged dissociation constants directly from straightforward simulation, without the use of WEUS and WHAM. We use a helix-helix interaction system, formed using residues 28 to 40 of both monomers of the acid shock protein HdeA (Figure 1 A). Only the Cα atoms are used, and the interactions between residues, both intra- and intermolecular, are taken from the Gō-like model of the full HdeA dimer. There are 18 intramolecular contacts in each monomer, and 12 intermolecular contacts in this system.
Fig. 1.
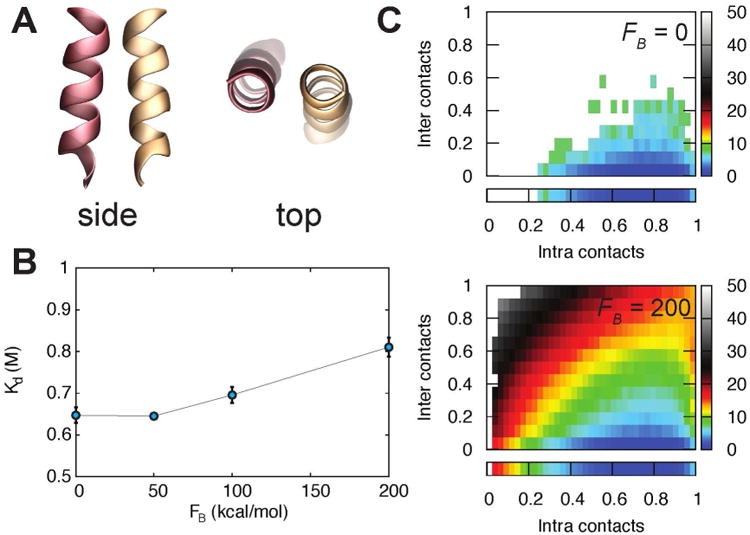
A) Side and top views of the small helix-helix interaction system: residues 28 through 40 of both monomers of HdeA, taken from PDB ID:lbg8.37 B) Dissociation constants obtained with straightforward simulations (FB = 0), and WEUS simulations (FB = 50, 100 and 200 kcal/mol). In each case, the average value over three independent simulations, and the associated standard deviation is shown. C) Distribution of intra- and intermolecular contacts obtained with straightforward simulation (FB = 0) and a WEUS simulation with FB = 200 kcal/mol. The color bars show the free energy in units of kT. The box below each map shows the distribution of intramolecular contacts in the monomeric state.
The interaction between these two helical segments is not strong enough to form a stable complex; we determine the dissociation constant to be 0.65 ± 0.02 M using 1200 independent straightforward simulations, which are run simply by setting FB = 0 in three WEUS simulations with 400 windows each. We then run WEUS simulations starting from the bound, folded structure for a range of non-zero biasing forces (FB). Figure 1B plots Kd as a function of FB, averaging over three independent simulations at each data point. Convergence of the dissociation constant occurs increasingly slowly as FB increases, and it is likely that 1000 cycles is still insufficient for FB = 200 kcal/mol (Figure S4). The binding constants agree to within 50% across the range of biasing forces used here, however we observe a small systematic increase in Kd with increasing force constant, likely due to long convergence times at high FB.
Figure 1C shows the distributions obtained with straightforward trajectories (FB = 0) and WEUS (FB = 200 kcal/mol). The sampling in the monomer region (zero intermolecular contacts) agrees well between the two simulations, but rare regions with either many intermolecular contacts, or very few intramolecular contacts are only described by the WEUS simulations. Significantly, the WEUS simulation samples the tail of the distribution with many intermolecular contacts and few intramolecular contacts out to almost 40 kT in free energy, while the FB = 0 simulation only samples out to 10 kT.
B. Coupled binding and folding of HdeA
The HdeA dimer has 162 intramolecular contacts in each monomer (324 total) and 51 intermolecular contacts. We define a two-dimensional grid of restraints along the finter and fintra directions, ranging from (0,0) to (1,1). We define windows along each coordinate with a spacing of 0.05, for a total of 400 windows. At the start of our WEUS simulations we only initialize one window in the fully folded, dimer region, and use a progressive initialization technique to activate other windows, when possible. All 400 regions are activated by the end of the simulation.
To initially investigate the stability of the HdeA dimer, we use a set of 400 straightforward trajectories starting in the dimer state, each 400 ns in length, for a total of 160 μs of sampling. Figure 2C (top) shows that the sampling obtained by this ensemble of trajectories is restricted to the dimer region, which emphasizes the extremely high free energy barriers that separate the monomer and dimer states. Figure 2D (bottom) shows that WEUS is not only able to leave the dimer basin, but obtains extensive sampling of the transition states between the stable monomer and dimer regions. Molecular details of the most probable transition pathway are discussed below in Section IIIB2.
Fig. 2.
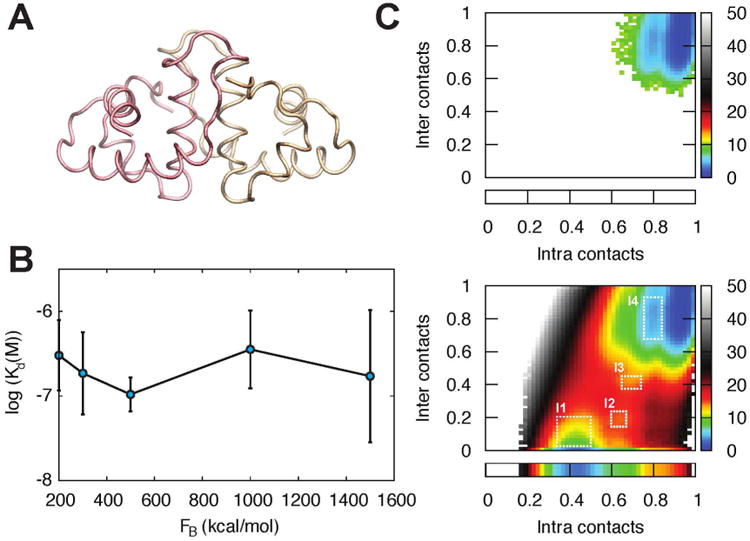
A) Dimer starting configuration of HdeA, taken from PDBID:lbg8.37 B) Dissociation constants obtained across a range of biasing forces, from FB = 200 to 1500 kcal/mol. Error bars are obtained by block averaging each simulation in increments of 200 cycles. C) Distribution of intra- and intermolecular contacts obtained with straightforward simulation (FB = 0) and a WEUS simulation with FB = 300 kcal/mol. The straightforward simulation is unable to leave the dimer state. Color bars show the free energy in units of kT. The box below each map shows the distribution of intramolecular contacts in the monomeric state.
1. Dissociation constant is independent of biasing strength
In order to investigate the impact of systematic error induced by the biasing forces, we run WEUS simulations of this system with biasing strengths ranging from 100 to 1500 kcal/mol. Figure 2B shows that the dissociation constants do not vary widely as a function of biasing strength, agreeing to within a factor of five. We scale the intermolecular interaction potentials using a unit-less, uniform scaling parameter α, and choose its value so as to reproduce the experimental dissociation constant in non-acidic conditions. Measurements have determined the Kd for HdeA at pH 7 to be about 200 nM,4 which is in excellent agreement with the Kd measured here using an intermolecular contact scaling strength (α) of 1.25. Figure S5 shows that the Kd is relatively sensitive to α, changing from sub-nanomolar to micromolar over the range 1.2 to 1.3. Surprisingly, the biasing strength does not significantly affect the sampling efficiency; all simulations require about 1000 cycles to reach their converged Kd (Figure S6).
2. Detailed binding mechanism
Our approach allows for the transition region between the folded dimer state and the unfolded monomer state in HdeA to be examined in detail. Whereas in previous work we identified a metastable intermediate (I4) close to the dimer region,8 here we can clearly observe a set of metastable structures (I1, I2, I3 and I4), between the monomer and dimer states. Rectangular regions bounding these intermediates are determined by eye and are shown in Figure 2C; their bounding coordinates are given in Table I. To examine the structures that contribute to the probability density in the local minima we independently cluster all of the structures visited in our WEUS simulations that lie within each region. Clustering is performed using MSMBuilder,42,43 using the same set of intra- and intermolecular contacts that define the Gō-like model. A 10 Å cutoff is used for each contact, and the clustering is performed on a Boolean matrix that defines whether or not a given contact is satisfied. The cutoff for k-means clustering is 0.2, and the number of clusters identified is 37, 9, 4 and 2 for intermediates I1, I2, I3 and I4, respectively. We calculate the probability of each cluster as proportional to the number of frames within each, and visualize a randomly chosen frame from each cluster that has a probability greater than 0.05 in Figure 3. For all structures if Figure 3, the monomer with more structure is termed “monomer A”, and is shown on the left, colored from green (N terminus) to blue (C terminus). The monomer with less structure is “monomer B”, and is shown on the right, colored from red (N terminus) to green (C terminus). The Shannon entropy of the clustering is shown for each intermediate state, and is computed as S = −kB Σi Pi ln(Pi) where the sum is over all clusters in the state.
Table I.
Bounding coordinates of the four intermediate regions along the principal association pathway.
| Intra | Inter | |||
|---|---|---|---|---|
| Min | Max | Min | Max | |
| I1 | 0.35 | 0.50 | 0.02 | 0.20 |
| I2 | 0.60 | 0.67 | 0.15 | 0.22 |
| I3 | 0.65 | 0.75 | 0.38 | 0.45 |
| I4 | 0.75 | 0.83 | 0.65 | 0.90 |
Fig. 3.
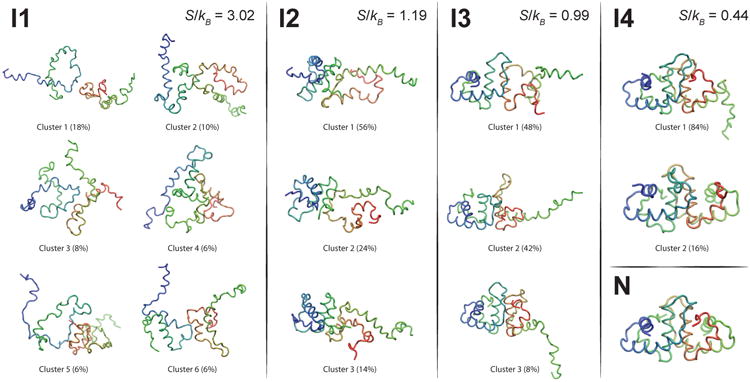
Representative structures for significantly populated states (> 5%) for intermediates I1, I2, I3, and I4. In each case, the monomer with more intramolecular contacts is shown on the left, and is colored from blue (N terminus) to green (C terminus). The other monomer is shown on the right, and is colored from green (N terminus) to red (C terminus). The native dimer state is shown in the bottom right for reference.
Intermediate I1 is very heterogeneous, showing not just large differences in position due to large motions in unstructured regions, but differences in which intra- and intermolecular contacts are formed. All cluster centers show both monomers having some structure, although neither monomer is completely folded. Both monomers retain some intramolecular structure, in accord with experimental findings at low pH.9,10 The clusters of intermediate I2, in contrast, show monomer A completely folded, with intermolecular contacts formed between the interfacial loop (IL) region 47-54 of monomer B (yellow) with the N-terminal region of monomer A (green). This large reduction in clustering entropy – from S/kB = 3.02 to S/kB = 1.19 – is consistent with the picture of a funnel-shaped folding and binding landscape. In I3, the interfacial helix (IH) region in monomer B (orange) folds and forms the helix-helix interface. The core of the dimer (IH1-IH2-IL1-IL2) is formed in I4, which lacks only the remaining intramolecular contacts in monomer B. This intermediate is analogous to the “I2” intermediate found in our previous work8 where helix D (residues 74 to 85) is largely unstructured. However, here we also find a smaller cluster with 16% of the population in I4 that instead primarily lacks contacts in the N terminal region (see the red region in Cluster 2). Intriguingly, the protonation of a key “pH-trigger” (Asp20) within the N-terminal helix was proposed to destabilize the helix macrodipole, thereby promoting disordering and dissociation of the HdeA complex.23 This is particularly interesting given the hypothesis that partially unfolded or “loosened” dimer states can be active for capturing unfolded substrate under acidic conditions.44 Cluster 2 of I4, as well as the set of structures in I3, provide a more detailed view of the types of possible loosened dimers that could be key components of the chaperone activation pathway and even play a role in substrate recognition.
3. Orthogonal relaxation is improved using window exchanges
The main motivation behind incorporating exchanges into umbrella sampling is to encourage relaxation orthogonal to the degrees of freedom that are used to define the window potentials. The current system provides an excellent opportunity to test relaxation both with and without window exchange. Here we define a parameter δ as the difference in the number of intramolecular contacts satisfied by monomer A and monomer B. Using the set of window configurations generated from a WEUS simulation with FB = 300, α = 1.25, and run for 2600 cycles, we generate an initial starting ensemble in which we enforce that δ > 0 for each configuration by swapping monomer identities. We can then examine the kinetics of relaxation of the expectation value of |δ| in each window, for both WEUS and conventional umbrella sampling with no exchanges.
We take the cumulative average of δ after 3000 cycles, and average this over three independent umbrella sampling simulations to obtain 〈|δ|〉 both with and without window exchanges. Both sets of simulations are run with FB = 300 kcal/mol. Figure 4 shows a comparison of 〈|δ|〉 after 3000 cycles in each window. For many regions, especially those with very low or very high fractions of intramolecular contacts (corresponding to two unfolded or two folded monomers, respectively) 〈|δ|〉 is close to zero. Peak 〈|δ|〉 is observed in both cases around fintra = 0.7, which corresponds to one folded and one mostly unfolded monomer. As expected, incorporating window exchanges into umbrella sampling leads to dramatically accelerated relaxation in orthogonal degrees of freedom. We also find that this effect is unchanged with increasing biasing constant (Figure S7).
Fig. 4.
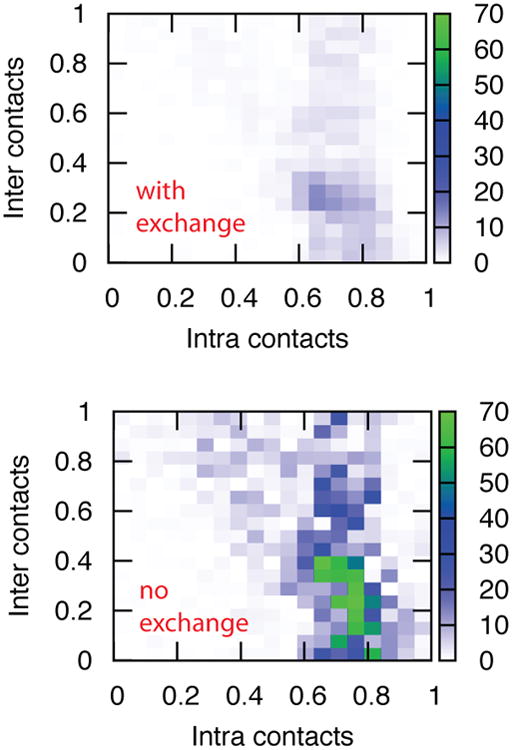
Relaxation of a prepared asymmetric state. Each map plots the expectation value of |δ|, which is the absolute value of the difference in the number of intramolecular contacts of monomer A and monomer B after a relatively long simulation time (3000 sampling cycles). The horizontal axis shows the total fraction of intramolecular contacts in the system, and the vertical axis shows the fraction of intermolecular contacts. Each sampling window is given its own box in the map. (Top) WEUS simulations with smaller |δ| values show that the sampling in a given window has equilibrated; it has sampled states where monomer A is more structured versus those where monomer B is more structured approximately equally. (Bottom) Conventional umbrella sampling simulations show large values of |δ| which reveal asymmetries between monomers A and B that persist over long time scales.
IV. Discussion
Here we have used a Window Exchange Umbrella Sampling (WEUS) method to study extremely long timescale coupled folding and binding events for HdeA. The restraint potentials are imposed using the fraction of intra- and intermolecular contacts. We note that for systems without large folding barriers, placing windows only along intermolecular contacts can be sufficient, as demonstrated by Rogers et al. for a small peptide binding to MCL-145. In other previous work, distance-based restraints are used on the centers of masses.46 We expect this would perform poorly in the case of HdeA as this distance does not clearly resolve the intermediate species identified here (Figure S8). We also do not employ any tethers to hold the monomers together, and our 120 Å box size allows for extensive sampling of the monomeric state to obtain a large ensemble of approach complexes. This approach can handle extremely long dissociation timescales, allowing us to use intermolecular contact strengths that reproduce the experimental dissociation constant. This is important, as the binding mechanism can change with intermolecular contact strength.
Prior studies have employed temperature replica exchange to study CFaB,8,47 which does not explicitly enhance sampling of the transition region and can result in walker segregation. We note that Hamiltonian replica exchange, where the strength of the intermolecular contacts is varied from one window to another, has also been used to study dimerization.48 A hybrid Hamiltonian and temperature replica exchange method (HTREM) has also been developed and applied to the dimerization of leucine zippers.49,50 Although these methods show improved exchange statistics over conventional temperature-based replica exchange, they also do not explicitly enforce sampling of the transition state region.
We recently published a method, WExplore,51,52 which is built upon the weighted ensemble algorithm53 and can define sampling regions in a high-dimensional space, and in principle can enhance sampling of the transition state region. However, WExplore is not found to be efficient for this problem (see Supplementary Information), requiring a larger number of walkers and a shorter time lag between exchanges than was used in the approach here. Another method with which we have expertise, Nonequilibrium Umbrella Sampling (NEUS),54,55 more strictly encourages sampling of the transition state region using a list of entry points for each region that are used to spawn new trajectories. We conducted a relaxation test for NEUS as in Section III B 3, and found that although it allows for the exchange of information between sampling regions, the list of entry points for each region results in very slow relaxation in orthogonal degrees of freedom (see Supplementary Information). To the best of our knowledge, WEUS is unique in that it both explicitly enhances transition state sampling, and has favorable orthogonal relaxation kinetics.
CFaB events are prevalent in cell signaling and regulation, yet are notoriously difficult to characterize due to the highly dynamical nature of these processes.56 Thus, an atomic-level description of CFaB mechanisms opens the avenue to previously unrealized functional insight. For example, the CFaB energy landscape of the conditionally disordered chaperone HdeA obtained by 2D-WEUS reveals several intermediate species that may facilitate the interpretation of a “loosened” dimer structure observed by NMR44 and support the notion that dimeric and not just monomeric species may interact with substrate.23 While in this work we employ 2D-WEUS with a Cα-based Go-like model, we emphasize that 2D-WEUS is not limited to such minimalist models. We envision the integration of this enhanced sampling method within multiscale frameworks alongside higher-resolution models.23,57,58 Such approaches will facilitate closer connections to experiment.
Furthermore, combining 2D-WEUS with transferable potentials for protein binding59 could play a predictive role in characterizing putative protein-protein interfaces. Conventional protein-protein docking approaches consider a limited degree of conformational flexibility and often employ rigid body searches of protein interaction space,22,60,61 which precludes the study of CFaB events. Molecular dynamics-based methods with general inter-protein potentials have shown promise in reproducing the folding and binding mechanisms of dimers with known structures59 and in characterizing alternate binding modes.59,62 Our approach could allow for a thorough investigation of protein binding dynamics for both known and putative complexes, yielding unprecedented insight into not only bound and unbound configurations, but also transition-state ensembles that are relevant to binding and unbinding kinetics.
Supplementary Material
Acknowledgments
This work was supported by the NIH through grant GM107233. The work was also funded by the NIH Ruth L. Kirschstein National Research Service Award Postdoctoral Fellowship (L.S.A. grant GM108298).
Contributor Information
Alex Dickson, Department of Chemistry, The University of Michigan, Ann Arbor, MI 48109.
Logan S. Ahlstrom, Department of Chemistry, The University of Michigan, Ann Arbor, MI 48109
Charles L. Brooks, III, Email: brookscl@umich.edu, Biophysics Program, The University of Michigan, Ann Arbor, MI 48109 and Department of Chemistry, The University of Michigan, Ann Arbor, MI 48109.
References
- 1.Wright PE, Dyson HJ. Curr Opin Struct Biol. 2009;19:31. doi: 10.1016/j.sbi.2008.12.003. [DOI] [PMC free article] [PubMed] [Google Scholar]
- 2.Dyson HJ, Wright PE. Nat Rev Mol Cell Biol. 2005;6:197. doi: 10.1038/nrm1589. [DOI] [PubMed] [Google Scholar]
- 3.Bodner C, Dobson C, Bax A. J Mol Biol. 2009;390:775. doi: 10.1016/j.jmb.2009.05.066. [DOI] [PMC free article] [PubMed] [Google Scholar]
- 4.Gajiwala KS, Burley SK. J Mol Biol. 2000;295:605. doi: 10.1006/jmbi.1999.3347. [DOI] [PubMed] [Google Scholar]
- 5.Hong W, Jiao W, Hu J, Zhang J, Liu C, Fu X, Shen D, Xia B, Chang Z. J Biol Chem. 2005;280:27029. doi: 10.1074/jbc.M503934200. [DOI] [PubMed] [Google Scholar]
- 6.Wu YE, Hong W, Liu C, Zhang L, Chang Z. Biochem J. 2008;412:389. doi: 10.1042/BJ20071682. [DOI] [PubMed] [Google Scholar]
- 7.Tapley TL, Franzmann TM, Chakraborty S, Jakob U, Bardwell JCA. Proc Natl Acad Sci U S A. 2010;107:1071. doi: 10.1073/pnas.0911610107. [DOI] [PMC free article] [PubMed] [Google Scholar]
- 8.Ahlstrom LS, Dickson A, Brooks CL., III J Phys Chem B. 2013;117:13219. doi: 10.1021/jp403264s. [DOI] [PMC free article] [PubMed] [Google Scholar]
- 9.Foit L, George J. Proc Natl Acad Sci. 2013:E1254–E1262. [Google Scholar]
- 10.Tapley TL, Körner JL, Barge MT, Hupfeld J, Schauerte JA, Gafni A, Jakob U, Bardwell JCA. Proc Natl Acad Sci U S A. 2009;106:5557. doi: 10.1073/pnas.0811811106. [DOI] [PMC free article] [PubMed] [Google Scholar]
- 11.Dagliyan O, Proctor EA, D'Auria KM, Ding F, Dokholyan NV. Structure. 2011;19:1837. doi: 10.1016/j.str.2011.09.014. [DOI] [PMC free article] [PubMed] [Google Scholar]
- 12.Shan Y, Kim ET, Eastwood MP, Dror RO, Seeliger MA, Shaw DE. J Am Chem Soc. 2011;133:9181. doi: 10.1021/ja202726y. [DOI] [PMC free article] [PubMed] [Google Scholar]
- 13.Buch I, Giorgino T, De Fabritiis G. Proc Natl Acad Sci U S A. 2011;108:10184. doi: 10.1073/pnas.1103547108. [DOI] [PMC free article] [PubMed] [Google Scholar]
- 14.Doerr S, De Fabritiis G. J Chem Theory Comput. 2014;10:2064. doi: 10.1021/ct400919u. [DOI] [PubMed] [Google Scholar]
- 15.Go N, Abe H. Biopolymers. 1981;20:991. doi: 10.1002/bip.1981.360200511. [DOI] [PubMed] [Google Scholar]
- 16.Chu X, Gan L, Wang E, Wang J. Proc Natl Acad Sci. 2013:1–10. [Google Scholar]
- 17.Ganguly D, Zhang W, Chen J. PLoS Comput Biol. 2013;9:e1003363. doi: 10.1371/journal.pcbi.1003363. [DOI] [PMC free article] [PubMed] [Google Scholar]
- 18.De Sancho D, Best RB. Mol BioSyst. 2012;8:256. doi: 10.1039/c1mb05252g. [DOI] [PubMed] [Google Scholar]
- 19.Levy Y, Wolynes PG, Onuchic JN. Proc Natl Acad Sci U S A. 2004;101:511. doi: 10.1073/pnas.2534828100. [DOI] [PMC free article] [PubMed] [Google Scholar]
- 20.Rumfeldt JaO, Galvagnion C, Vassall KA, Meiering EM. Prog Biophys Mol Biol. 2008;98:61. doi: 10.1016/j.pbiomolbio.2008.05.004. [DOI] [PubMed] [Google Scholar]
- 21.Turjanski AG, Gutkind JS, Best RB, Hummer G. PLoS Comput Biol. 2008;4:e1000060. doi: 10.1371/journal.pcbi.1000060. [DOI] [PMC free article] [PubMed] [Google Scholar]
- 22.Kim YC, Hummer G. J Mol Biol. 2008;375:1416. doi: 10.1016/j.jmb.2007.11.063. [DOI] [PMC free article] [PubMed] [Google Scholar]
- 23.Ahlstrom LS, Law SM, Dickson A, Brooks CL. J Mol Biol. 2015 doi: 10.1016/j.jmb.2015.01.002. [DOI] [PMC free article] [PubMed] [Google Scholar]
- 24.Hansmann U. Chem Phys Lett. 1997:140–150. [Google Scholar]
- 25.Sugita Y, Okamoto Y. Chem Phys Lett. 1999;314:141. [Google Scholar]
- 26.Lee MS, Olson MA. J Chem Phys. 2011;134 doi: 10.1063/1.3603964. [DOI] [PubMed] [Google Scholar]
- 27.Kumar S, Rosenberg JM, Bouzida D, Swendsen RH, Kollman PA. J Comput Chem. 1992;13:1011. [Google Scholar]
- 28.Torrie JM, Valleau JP. J Comput Phys. 1977;23:187. [Google Scholar]
- 29.Sheinerman FB, Brooks CL., III J Mol Biol. 1998;278:439. doi: 10.1006/jmbi.1998.1688. [DOI] [PubMed] [Google Scholar]
- 30.Brooks B, Brooks C, III, MacKerell A, Jr, Nilsson L, Petrella R, Roux B, Won Y, Archontis G, Bartels C, Boresch S, et al. J Comput Chem. 2009;30:1545. doi: 10.1002/jcc.21287. [DOI] [PMC free article] [PubMed] [Google Scholar]
- 31.Sugita Y, Kitao A, Okamoto Y. J Chem Phys. 2000;113:6042. 0009120. [Google Scholar]
- 32.Lou H, Cukier RI. J Phys Chem B. 2006;110:24121. doi: 10.1021/jp064303c. [DOI] [PubMed] [Google Scholar]
- 33.Park S, Kim T, Im W. Phys Rev Lett. 2012;108:108102. doi: 10.1103/PhysRevLett.108.108102. [DOI] [PMC free article] [PubMed] [Google Scholar]
- 34.Park S, Im W. J Chem Theory Comput. 2013;9:13. doi: 10.1021/ct3008556. [DOI] [PMC free article] [PubMed] [Google Scholar]
- 35.Park S, Im W. J Chem Theory Comput. 2014;10:2719. doi: 10.1021/ct500504g. [DOI] [PMC free article] [PubMed] [Google Scholar]
- 36.Dickson A, Maienschein-Cline M, Tovo-Dwyer A, Hammond JR, Dinner AR. J Chem Theory Comput. 2011:2710–2720. doi: 10.1021/ct200371n. [DOI] [PubMed] [Google Scholar]
- 37.Yang F, Gustafson KR, Boyd MR, Wlodawer A. Nat Struct Biol. 1998;5:763. doi: 10.1038/1796. [DOI] [PubMed] [Google Scholar]
- 38.Karanicolas J, Brooks CL., III J Mol Biol. 2003;334:309. doi: 10.1016/j.jmb.2003.09.047. [DOI] [PubMed] [Google Scholar]
- 39.Roux B. Comput Phys Commun. 1995;91:275. [Google Scholar]
- 40.Grossfield A. version 2.0.9. URL http://membrane.urmc.rochester.edu/content/wham/
- 41.Souaille M, Roux B. Comput Phys Commun. 2001;135:40. [Google Scholar]
- 42.Beauchamp KA, Bowman GR, Lane TJ, Maibaum L, Haque IS, Pande VS. J Chem Theory Comput. 2011;7:3412. doi: 10.1021/ct200463m. [DOI] [PMC free article] [PubMed] [Google Scholar]
- 43.Bowman GR, Huang X, Pande VS. Methods. 2009;49:197. doi: 10.1016/j.ymeth.2009.04.013. NIHMS150003. [DOI] [PMC free article] [PubMed] [Google Scholar]
- 44.Garrison MA, Crowhurst KA. Protein Sci. 2014;23:167. doi: 10.1002/pro.2402. [DOI] [PMC free article] [PubMed] [Google Scholar]
- 45.Rogers JM, Oleinikovas V, Shammas SL, Wong CT, De Sancho D, Baker CM, Clarke J. Proc Natl Acad Sci. 2014;111:15420. doi: 10.1073/pnas.1409122111. [DOI] [PMC free article] [PubMed] [Google Scholar]
- 46.Han W, Schulten K. J Am Chem Soc. 2015;136:12450. doi: 10.1021/ja507002p. [DOI] [PMC free article] [PubMed] [Google Scholar]
- 47.Ganguly D, Chen J. Proteins. 2011;79:1251. doi: 10.1002/prot.22960. [DOI] [PubMed] [Google Scholar]
- 48.Itoh SG, Okumura H. J Phys Chem B. 2014;118:11428. doi: 10.1021/jp505984e. [DOI] [PubMed] [Google Scholar]
- 49.Su L, Cukier RI. J Phys Chem B. 2009;113:9595. doi: 10.1021/jp900309q. [DOI] [PubMed] [Google Scholar]
- 50.Cukier RI. J Chem Phys. 2011;134:045104. doi: 10.1063/1.3548074. [DOI] [PubMed] [Google Scholar]
- 51.Dickson A, Brooks CL., III J Phys Chem B. 2014;118:3532. doi: 10.1021/jp411479c. [DOI] [PMC free article] [PubMed] [Google Scholar]
- 52.Dickson A, Mustoe AM, Salmon L, Brooks CL., III Nucleic Acids Res. 2014;42:12126. doi: 10.1093/nar/gku799. [DOI] [PMC free article] [PubMed] [Google Scholar]
- 53.Huber GA, Kim S. Biophys J. 1996;70:97. doi: 10.1016/S0006-3495(96)79552-8. [DOI] [PMC free article] [PubMed] [Google Scholar]
- 54.Warmflash A, Bhimalapuram P, Dinner AR. J Chem Phys. 2007;127:154112. doi: 10.1063/1.2784118. [DOI] [PubMed] [Google Scholar]
- 55.Dickson A, Warmflash A, Dinner AR. J Chem Phys. 2009;130:074104. doi: 10.1063/1.3070677. [DOI] [PubMed] [Google Scholar]
- 56.Bardwell JCA, Jakob U. Trends Biochem Sci. 2012;37:517. doi: 10.1016/j.tibs.2012.08.006. [DOI] [PMC free article] [PubMed] [Google Scholar]
- 57.Gopal SM, Mukherjee S, Cheng YM, Feig M. Proteins: Struct, Funct, Bioinf. 2010;78:1266. doi: 10.1002/prot.22645. [DOI] [PMC free article] [PubMed] [Google Scholar]
- 58.Li W, Yoshii H, Hori N, Kameda T, Takada S. Methods. 2010;52:106. doi: 10.1016/j.ymeth.2010.04.014. [DOI] [PubMed] [Google Scholar]
- 59.Zheng W, Schafer NP, Davtyan A, Papoian GA, Wolynes PG. Proc Natl Acad Sci U S A. 2012;109:19244. doi: 10.1073/pnas.1216215109. [DOI] [PMC free article] [PubMed] [Google Scholar]
- 60.Dominguez C, Boelens R, Bonvin AMJJ. J Am Chem Soc. 2003;125:1731. doi: 10.1021/ja026939x. [DOI] [PubMed] [Google Scholar]
- 61.Wang C, Bradley P, Baker D. J Mol Biol. 2007;373:503. doi: 10.1016/j.jmb.2007.07.050. [DOI] [PubMed] [Google Scholar]
- 62.Ravikumar KM, Huang W, Yang S. Biophys J. 2012;103:837. doi: 10.1016/j.bpj.2012.07.013. [DOI] [PMC free article] [PubMed] [Google Scholar]
Associated Data
This section collects any data citations, data availability statements, or supplementary materials included in this article.