

Introduction
In the combination antiretroviral therapy (cART) era, prevalence of HIV-associated neurocognitive disorders (HAND) remains high: 36.2-44.8% 1, contributing to morbidity 1 and mortality 2. Suboptimal control of HIV in the central nervous system (CNS) likely plays a role in this phenomenon, as supported by elevated neopterin and detectable HIV-1 RNA in cerebrospinal fluid (CSF) of patients on long term cART 3. Studies have shown that limited CNS penetration by antiretroviral (ARV) drugs is associated with HAND 4,5.
Multiple factors impact CNS drug penetration, including molecular size, lipophilicity, plasma protein binding, and affinity for efflux pump transporters 6. For example, the ATP-binding cassette (ABC) superfamily of efflux transporters, including p-glycoprotein and multidrug-resistance associated proteins (MRPs), are expressed at blood-brain and blood-CSF barriers and can limit drug disposition7. Because many ARVs are substrates and/or inhibitors of ABC transporters, complex drug-drug interactions can occur. Specifically, protease inhibitors (PIs) atazanavir (ATV) and darunavir (DRV) are common in cART regimens when given with ritonavir (RTV) plus a backbone of tenofovir disoproxil fumarate (TDF), the tenofovir (TFV) pro-drug, and emtricitabine (FTC) 8. Both ATV and DRV inhibit p-glycoprotein and MRP-1 9-11 ; these transporters are found at blood-brain and blood-CSF barriers and are important for TFV 12 and FTC transport 13.
We compared CSF TFV and FTC concentrations between patients receiving two different RTV-boosted PI regimens: ATV vs DRV. We also examined associations between CSF drug concentrations and CSF HIV-1 RNA detection.
Methods
Study population and specimens
Plasma and CSF specimens were obtained from a cross-sectional study conducted at the Grady Health System-affiliated Ponce de Leon Center in Atlanta, Georgia from May to December 2012. Data and specimen collection methods have been previously described 14. Briefly, plasma and CSF were collected at drug trough times in thirty (30) HIV-1 infected patients receiving daily TDF/FTC (300 mg/200 mg) plus RTV (100 mg)-boosted daily ATV (300 mg) or DRV (800 mg). Eligibility criteria included documented adherence to their current boosted-PI regimen and undetectable plasma HIV-1 RNA (<40 copies/mL) for ≥ 6 months preceding study entry. The Emory University Institutional Review Board and Grady Research Oversight Committee approved this study; written informed consent was obtained from all study participants.
Plasma and CSF drug concentrations
Blood was collected from venipuncture and spun at 2300 rpm for 10 minutes to eliminate erythrocytes from the resulting plasma specimen. CSF was collected via lumbar puncture using sterile technique a median 35 minutes following blood draw (interquartile range, IQR, 30-45). Plasma and CSF aliquots were stored at -80°Celsius until analysis. Plasma and CSF TFV and FTC were quantitated using a modified previously published methodology 15. The calibration curve was linear over the range of 5 to 1000 ng/mL for TFV and 5 to 5000 ng/mL for FTC using a 50 μL aliquot of human plasma. Validation of the plasma assay showed precision < 8% coefficient of variation between calibration standards on different assay runs, and accuracy < 6% deviation from known concentrations. Plasma quality controls showed overall precision < 7% and accuracy within 10%. CSF samples were extracted and analyzed with plasma samples. Cross-validation using CSF quality controls showed overall precision < 7% and accuracy within 13%. CSF and plasma quality controls showed < 5% difference for both analytes, demonstrating equivalence of the two matrices.
CSF HIV-1 RNA
CSF HIV-1 RNA was measured with COBAS® Ampliprep/COBAS® Taqman® version 2.0 HIV-1 assay (Roche Molecular Systems, Inc, Branchburg, NJ, USA); this assay detects 20 to 10,000,000 copies/mL, with 98.3% sensitivity and 99.4% specificity.
Statistical analyses
Demographic characteristics were summarized by descriptive statistics. Differences between ATV and DRV arms were examined using Chi Square or Fisher's exact tests for categorical variables and Wilcoxon rank sum tests for continuous variables. Drug concentrations were reported as geometric means with 95% confidence intervals (CI) and medians with IQR in ng/mL. D'Agostino and Pearson normality tests were performed to assess for normality of distribution. Differences between drug concentrations were assessed using parametric unpaired two-sided two-sample t tests with an alpha level of 0.05. Associations between plasma and CSF drug concentrations were evaluated using Spearman rank correlation tests. To assess variables predictive of mean CSF drug concentrations, univariate and multiple linear regression modeling with forward selection was utilized. Relationships between CSF drug concentrations and detection of CSF HIV-1 RNA were assessed using point biserial correlation tests. Analyses were performed using SAS® 9.3 (SAS Institute, Cary, NC) software.
Results
Study Demographics
Thirty HIV-infected persons were enrolled: 15 were receiving ATV and 15 were receiving DRV. Plasma samples were available for analysis from all 30 participants, and CSF was available for all (15/15) participants in the ATV arm and 14/15 in the DRV arm. Demographic characteristics have been previously described and were similar between treatment arms 14; briefly, most were males (23/30, 76.7%), black (26/30, 86.7%), and median age was 46.9 years (interquartile range, IQR, 37.9-51.9). Five of the 7 females were in the ATV arm compared to 2 in the DRV arm (p = 0.4).
Plasma and CSF TFV and FTC concentrations
Plasma TFV trough concentrations were similar in both arms: geometric mean was 48.4 ng/mL (95% CI, 35.4-66.2) in the ATV group and 53.2 ng/mL (95% CI 39.5-71.5) in the DRV group (Table 1). CSF TFV concentrations were above the limit of quantitation (5 ng/mL) in only 4 participants: 1 (6.7%) in the ATV arm and 3 (21.4%) in the DRV arm. Three of these 4 participants were black (75%) and male, consistent with the overall study population. However, participants with detectable CSF TFV were older than those with undetectable TFV (median age 52.0 years [IQR 45.3-61.1], versus 45.7 years [IQR 33.7-50.9]), had lower creatinine clearance (median 84.5 mL/min [IQR 58.8-123] versus 100.5 mL/min [IQR 83.8-119.8], and had higher median plasma TFV concentrations (142.55 ng/mL [IQR 73.9-214.6] versus 52.0 ng/mL [IQR 43.0-65.3]). Only 1 of these 4 participants achieved a CSF TFV concentration above 11.5 ng/mL, the lowest reported IC50 for wild-type HIV-1 16.
Table 1. Drug trough concentrations for tenofovir and emtricitabine.
| Tenofovir and emtricitabine trough concentrations (Cmin) in ng/mL | |||
|---|---|---|---|
|
| |||
| Atazanavir arm (n = 15) | Darunavir arm (n = 15) | P valuea | |
|
| |||
| Tenofovir | |||
| CSFb | |||
| GMc (95% CId) | n/ae | n/a | n/a |
| Median (IQRf) | n/a | n/a | |
| PLASMA | |||
| GM (95% CI) | 48.4 (35.4-66.2) | 53.2 (39.5-71.5) | nsg |
| Median (IQR) | 51.5 (32.7-62.1) | 53.1 (47.4-76.0) | |
| CSF:PLASMA | |||
| GM (95% CI) | n/a | n/a | n/a |
| Median (IQR) | n/a | n/a | |
|
| |||
| Emtricitabine | |||
| CSF | |||
| GM (95% CI) | 32.2 (22.7-45.5) | 53.5 (35.3-81.2)h | 0.05 |
| Median (IQR) | 33.4 (28.6-47.5) | 50.0 (39.9-108.9) | |
| PLASMA | |||
| GM (95% CI) | 56.7 (42.3-76.0) | 108.3 (65.7-178.5) | 0.02 |
| Median (IQR) | 69.6 (43.1-73.3) | 86.3 (73.7-200.0) | |
| CSF:PLASMA | |||
| GM (95% CI) | 0.6 (0.4-0.7) | 0.5 (0.4-0.6) | ns |
| Median (IQR) | 0.7 (0.4-0.9) | 0.6 (0.5-0.7) | |
Drug concentrations and CSF:Plasma Ratios compared between groups using parametric unpaired two-sided two- sample t tests. P values > 0.05 were considered non-significant (ns);
CSF = cerebrospinal fluid;
GM = geometric mean;
CI = confidence interval;
n/a = not applicable: CSF tenofovir was below limit of quantitation (<5 ng/mL) in 25/29 available samples;
IQR = interquartile range, 25th -75th percentile;
ns = non significant, p > 0.05;
14/15 participants in darunavir arm had CSF available for analysis
Compared with the ATV arm, mean plasma FTC concentrations were almost doubled in the DRV arm: 108.3 ng/mL (95% CI 65.7-178.5) and 56.7 ng/mL (95% CI 42.3-76.0), respectively (p = 0.02), Table 1. Using linear regression, other statistically significant predictors of plasma FTC concentrations in univariate analyses included creatinine clearance (p = 0.04) and age (p = 0.05). However, treatment arm was the only variable that remained significant in multiple linear regression analyses, p = 0.04. In addition, mean FTC CSF concentrations were higher in the DRV group compared to ATV: 53.5 ng/mL (95% CI 35.3-81.2) versus 32.2 ng/mL (95% CI 22.7-45.5), p = 0.05 (Table 1). CSF:Plasma FTC concentration ratios were similar in both arms: 0.6 (95% CI 0.4-0.7) for ATV and 0.5 (95% CI 0.4-0.6) for DRV, p = 0.4 (Table 1). Plasma and CSF FTC concentrations were significantly correlated in both DRV and ATV arms, r = 0.9, p < 0.0001 and r = 0.6, p = 0.02, respectively.
In univariate linear regression models, treatment arm (p = 0.05), plasma FTC concentration (p <0.0001, Figure 1a) and sex (p = 0.03, Figure 1b) were significant predictors of CSF FTC concentration. Because treatment arm and plasma FTC concentrations exhibited features of collinearity, only plasma FTC concentrations were chosen for multiple linear regression modeling. A two predictor model with plasma FTC concentration and sex explained 70% of the variance in FTC CSF concentrations, R2 = 0.7, (F= 31.9), p <0.0001. When holding sex constant, a 10% increase in FTC plasma concentration was associated with a 6.6% increase in CSF FTC concentrations. Holding plasma FTC concentrations constant, female sex was associated with a 30% decrease in CSF FTC concentrations.
Fig 1.
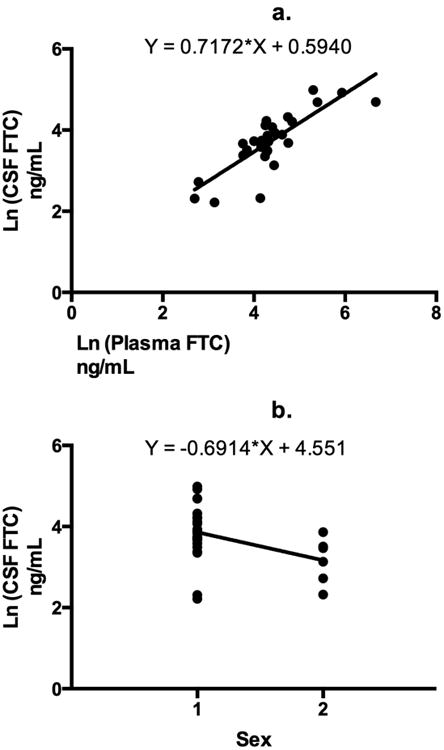
Univariate linear regression analyses are shown for the dependent variable Ln (cerebrospinal fluid [CSF] emtricitabine [FTC] concentration) and significant predictor variables a) Ln (Plasma FTC concentration) was a significant predictor of Ln (CSF FTC concentration), R2 = 0.7, p <0.0001 b) Sex (1 = male and 2 = females) was a significant predictor of Ln (CSF FTC concentration). There is a negative association between female sex and Ln (CSF FTC concentrations), R2 = 0.2, p = 0.03.
CSF HIV-1 RNA
Of the 30 study participants, 6 (20%) had detectable CSF HIV-1 RNA: 2 in the ATV arm and 4 in the DRV arm (p = 0.7). Detection of HIV-1 RNA in the CSF was not associated with CSF FTC concentrations in either group (ATV arm: r = 0.05, p = 0.9; DRV arm: r = 0.4, p = 0.2).
Discussion
Plasma and CSF drug trough concentrations of FTC and TFV were compared in HIV-1 infected individuals receiving two different PIs: ATV or DRV. In contrast, prior literature has reported random NRTI concentrations in populations receiving different ARV classes.
Plasma and CSF TFV concentrations in this study are consistent with those published previously 17,18: Specifically, both Calcagno et al and Best et al reported low CSF TFV concentrations, median 6 ng/mL (IQR 2-8) and 5.5 ng/mL (IQR 2.7-11.3), respectively. TFV may have difficulty penetrating the CSF-brain barrier due to low lipophilicity or affinity for efflux membrane transporters such as MRP 4 19. In addition, mean plasma and CSF FTC concentrations in our study were slightly lower than those reported by Calcagno et al: median 212 ng/mL (IQR 86.5-445.5) and 68 ng/mL (IQR 2.5-98.0), respectively. This may be explained by variation in post-dose sampling: Calcagno et al sampled a median of 15 hours post-dose (IQR 13.8-19.4) while our study sampled at trough times (median 23.8 hours [IQR 23.5 - 24.3]).
Participants in the DRV arm had significantly higher plasma FTC concentrations compared to the ATV arm, even when controlling for possible confounders. One possible explanation is drug-drug interactions. For example, plasma TFV concentrations are increased with boosted PIs: pharmacokinetic studies showed 29% increase in TFV Cmin with boosted ATV 20 and 37% increased Cmin with boosted DRV 21. While mechanisms for these drug-drug interactions have not been fully elucidated, PI inhibition of efflux transporters on apical renal tubule membranes, including p-glycoprotein, MRP2 and MRP4, is thought to play a role 22,23. A similar mechanism may explain the higher plasma FTC concentrations in the DRV arm although little is known regarding effect of DRV on MRP2 or MRP4 transporters.
Our data showed significantly higher CSF FTC concentrations in patients receiving DRV compared to ATV, however this difference was likely driven by high plasma FTC concentrations in the DRV arm. CSF FTC concentrations were strongly associated with plasma FTC concentrations, consistent with the literature 18. Female sex was negatively associated with CSF FTC concentrations. When we compared females (n = 7) to males (n = 23), we found no significant differences in age, race, creatinine clearance, or BMI to explain this finding, however our sample size of females was small, thus limiting our analyses. One theory to explain this sex discrepancy is differential expression of transporters on the brain-CSF and blood-brain barriers between males and females. For example, Schuetz et al 24 found decreased p-glycoprotein activity in females compared to males; sex differences in other transporter activity that may influence FTC movement into the CNS, such as MRP-1, have not been studied.
Detection of CSF HIV-1 RNA was not associated with CSF FTC concentrations: all 6 participants with detectable CSF HIV-1 had corresponding CSF FTC concentrations over the in vitro IC50 upper limit for FTC antiviral activity in cell culture (18.5 ng/mL) 25. However, CSF drug concentrations may not accurately represent brain parenchyma penetration, as drugs can exhibit heterogenous distribution in the brain due to factors such as changes in the functionality of barriers from HIV infection.
In summary, TFV CSF concentrations were below the limit of quantitation for most participants; it is unlikely that TFV plays a prominent role in virologic control of HIV-1 in the CNS. While 3 of the 4 participants with detectable TFV CSF concentrations were taking DRV, a larger dataset is needed to determine whether TFV CSF concentrations actually differ between arms. In contrast, FTC CSF concentrations differed significantly between treatment arms, largely due to higher plasma FTC concentrations in the DRV arm. To a lesser extent, sex was also a predictor of FTC CSF concentrations. Small sample size and cross-sectional study design were limitations of this study. Longitudinal studies adequately powered to examine the impact and mechanisms of drug-drug interactions and sex differences in ARV reservoir penetration are warranted and could impact clinical practice.
Acknowledgments
All listed authors met the criteria for authorship set forth by the International Committee for Medical Journal Editors. Author contributions were as follows: C.D.L and I.O. were lead study investigators, designed and wrote the study protocol, acquired/analyzed/interpreted data, and wrote and critically reviewed the article. A.N.S was a study investigator and wrote and critically reviewed the manuscript. K.R-W and E.P.A performed assays for plasma and CSF tenofovir and emtricitabine quantification and wrote and critically reviewed the article. A.V conducted all processing of plasma and CSF, contributed to study design, and wrote and critically reviewed the manuscript.
We are grateful to the faculty, staff, and research participants at the Ponce de Leon Center for their time and dedication to this project.
Sources of Funding: C.D.L received grant funding as a Bristol-Myers Squibb Virology Fellow to support conduct of this study. I. O has received funding from Bristol-Myers Squibb. C.D.L and A.N.S. received support from the National Center for Advancing Translational Sciences of the National Institutes of Health under Award Number UL1TR000454 and KL2TR000455. The content is solely the responsibility of the authors and does not necessarily represent the official views of the National Institutes of Health. This work is also supported by the Emory CFAR (P30 AI050409). A.N.S. received support from the National Institutes of Allergy and Infectious Diseases (1K23AI114401-01).
Footnotes
Conflicts of Interest: C.D.L received grant funding as a Bristol-Myers Squibb Virology Fellow to support conduct of this study. I.O has received funding from Bristol-Myers Squibb.
Compliance with Ethical Standards: The Emory University Institutional Review Board and Grady Research Oversight Committee approved this study, and it was conducted in accordance with the ethical standards laid down in the 1964 Declaration of Helsinki and its later amendments. The authors have full control of the primary data and agree to allow the journal to review the data if requested.
References
- 1.Heaton RK, Franklin DR, Ellis RJ, et al. HIV-associated neurocognitive disorders before and during the era of combination antiretroviral therapy: differences in rates, nature, and predictors. Journal of neurovirology. 2011 Feb;17(1):3–16. doi: 10.1007/s13365-010-0006-1. [DOI] [PMC free article] [PubMed] [Google Scholar]
- 2.Ellis RJ, Deutsch R, Heaton RK, et al. Neurocognitive impairment is an independent risk factor for death in HIV infection. San Diego HIV Neurobehavioral Research Center Group. Archives of neurology. 1997 Apr;54(4):416–424. doi: 10.1001/archneur.1997.00550160054016. [DOI] [PubMed] [Google Scholar]
- 3.Hagberg L, Cinque P, Gisslen M, et al. Cerebrospinal fluid neopterin: an informative biomarker of central nervous system immune activation in HIV-1 infection. AIDS research and therapy. 2010;7:15. doi: 10.1186/1742-6405-7-15. [DOI] [PMC free article] [PubMed] [Google Scholar]
- 4.Letendre S, Marquie-Beck J, Capparelli E, et al. Validation of the CNS Penetration-Effectiveness rank for quantifying antiretroviral penetration into the central nervous system. Archives of neurology. 2008 Jan;65(1):65–70. doi: 10.1001/archneurol.2007.31. [DOI] [PMC free article] [PubMed] [Google Scholar]
- 5.Liner KJ, 2nd, Hall CD, Robertson KR. Effects of antiretroviral therapy on cognitive impairment. Current HIV/AIDS reports. 2008 May;5(2):64–71. doi: 10.1007/s11904-008-0011-7. [DOI] [PubMed] [Google Scholar]
- 6.Nau R, Sorgel F, Eiffert H. Penetration of drugs through the blood-cerebrospinal fluid/blood-brain barrier for treatment of central nervous system infections. Clinical microbiology reviews. 2010 Oct;23(4):858–883. doi: 10.1128/CMR.00007-10. [DOI] [PMC free article] [PubMed] [Google Scholar]
- 7.Kis O, Robillard K, Chan GN, Bendayan R. The complexities of antiretroviral drug-drug interactions: role of ABC and SLC transporters. Trends in pharmacological sciences. 2010 Jan;31(1):22–35. doi: 10.1016/j.tips.2009.10.001. [DOI] [PubMed] [Google Scholar]
- 8.Panel on antiretroviral guidelines for adults and adolescents. Guidelines for the use of antiretroviral agents in HIV-1 infected adults and adolescents. Department of Health and Human Services. E1-E8, F1. Available at: http://www.aidsinfo.nih.gov/ContentFiles/AdultandAdolescentGL.pdf.
- 9.Lee LS, Soon GH, Shen P, Yong EL, Flexner C, Pham P. Darunavir/ritonavir and efavirenz exert differential effects on MRP1 transporter expression and function in healthy volunteers. Antiviral therapy. 2010;15(2):275–279. doi: 10.3851/IMP1505. [DOI] [PubMed] [Google Scholar]
- 10.Janneh O, Anwar T, Jungbauer C, et al. P-glycoprotein, multidrug resistance-associated proteins and human organic anion transporting polypeptide influence the intracellular accumulation of atazanavir. Antiviral therapy. 2009;14(7):965–974. doi: 10.3851/IMP1399. [DOI] [PubMed] [Google Scholar]
- 11.Fujimoto H, Higuchi M, Watanabe H, et al. P-glycoprotein mediates efflux transport of darunavir in human intestinal Caco-2 and ABCB1 gene-transfected renal LLC-PK1 cell lines. Biological & pharmaceutical bulletin. 2009 Sep;32(9):1588–1593. doi: 10.1248/bpb.32.1588. [DOI] [PMC free article] [PubMed] [Google Scholar]
- 12.Tong L, Phan TK, Robinson KL, et al. Effects of human immunodeficiency virus protease inhibitors on the intestinal absorption of tenofovir disoproxil fumarate in vitro. Antimicrobial agents and chemotherapy. 2007 Oct;51(10):3498–3504. doi: 10.1128/AAC.00671-07. [DOI] [PMC free article] [PubMed] [Google Scholar]
- 13.Bousquet L, Pruvost A, Didier N, Farinotti R, Mabondzo A. Emtricitabine: Inhibitor and substrate of multidrug resistance associated protein. European journal of pharmaceutical sciences : official journal of the European Federation for Pharmaceutical Sciences. 2008 Nov 15;35(4):247–256. doi: 10.1016/j.ejps.2008.06.017. [DOI] [PubMed] [Google Scholar]
- 14.Delille CA, Pruett ST, Marconi VC, et al. Effect of protein binding on unbound atazanavir and darunavir cerebrospinal fluid concentrations. Journal of clinical pharmacology. 2014 Sep;54(9):1063–1071. doi: 10.1002/jcph.298. [DOI] [PMC free article] [PubMed] [Google Scholar]
- 15.James AM, K J, Ofotokun I, Sheth A, Acosta EP. Tenofovir and emtricitabine uptake into non-monocytic female genital tract cells with and without hormonal contraceptives. Journal of Experimental Pharmacology. 2013;5:1–10. doi: 10.2147/JEP.S45308. [DOI] [PMC free article] [PubMed] [Google Scholar]
- 16.Tenfovir disoproxil fumarate [package insert] Foster City, CA: Gilead Sciences, Inc; 2013. [Google Scholar]
- 17.Best BM, Letendre SL, Koopmans P, et al. Low cerebrospinal fluid concentrations of the nucleotide HIV reverse transcriptase inhibitor, tenofovir. Journal of acquired immune deficiency syndromes. 2012 Apr 1;59(4):376–381. doi: 10.1097/QAI.0b013e318247ec54. [DOI] [PMC free article] [PubMed] [Google Scholar]
- 18.Calcagno A, Bonora S, Simiele M, et al. Tenofovir and emtricitabine cerebrospinal fluid-to-plasma ratios correlate to the extent of blood-brainbarrier damage. Aids. 2011 Jul 17;25(11):1437–1439. doi: 10.1097/QAD.0b013e3283489cb1. [DOI] [PubMed] [Google Scholar]
- 19.Imaoka T, Kusuhara H, Adachi M, Schuetz JD, Takeuchi K, Sugiyama Y. Functional involvement of multidrug resistance-associated protein 4 (MRP4/ABCC4) in the renal elimination of the antiviral drugs adefovir and tenofovir. Molecular pharmacology. 2007 Feb;71(2):619–627. doi: 10.1124/mol.106.028233. [DOI] [PubMed] [Google Scholar]
- 20.Agarwala S, E T, Villegas C, Wang Y, Hughes E, Grasela D. Pharmacokinetic interaction between tenofovir and atazanavir coadministration with ritonavir in healthy subjects. 16th Int Workshop Clin Pharmacol HIV Ther. 2005 Abstract 16. [Google Scholar]
- 21.Back DJ, S V, Lefebvre E, De Pauw M, De Paepe E, Vangeneugden T, Hoetlmans R. Use of TMC114 in combination with other drugs: guidance from pharmacokinetic studies. 8th Int Congr Drug Ther HIV Infect. 2006 Abstract PL5.1. [Google Scholar]
- 22.Huisman MT, Smit JW, Crommentuyn KM, et al. Multidrug resistance protein 2 (MRP2) transports HIV protease inhibitors, and transport can be enhanced by other drugs. Aids. 2002 Nov 22;16(17):2295–2301. doi: 10.1097/00002030-200211220-00009. [DOI] [PubMed] [Google Scholar]
- 23.Lee CG, Gottesman MM, Cardarelli CO, et al. HIV-1 protease inhibitors are substrates for the MDR1 multidrug transporter. Biochemistry. 1998 Mar 17;37(11):3594–3601. doi: 10.1021/bi972709x. [DOI] [PubMed] [Google Scholar]
- 24.Schuetz EG, Furuya KN, Schuetz JD. Interindividual variation in expression of P-glycoprotein in normal human liver and secondary hepatic neoplasms. The Journal of pharmacology and experimental therapeutics. 1995 Nov;275(2):1011–1018. [PubMed] [Google Scholar]
- 25.Emtricitabine [package insert] Foster City, CA: Gilead Sciences, Inc; 2012. [Google Scholar]