

Abstract
Background
We previously described two dynamics of contrast enhancement in scans of active multiple sclerosis lesions: Medium-sized, early lesions enhance centrifugally, whereas larger, slightly older lesions enhance centripetally. Due to technical limitations, our previous study did not characterize lesions < 5mm in diameter, cortical enhancement, and anatomical structures within lesions.
Objective
To obtain initial observations of these important aspects of lesion development on a 7 tesla scanner at high spatial resolution.
Methods
We scanned 8 patients, acquiring precontrast T2*-weighted scans, T1-weighted scans before and after contrast, and high-resolution dynamic contrast-enhanced scans during and up to 30min after contrast.
Results
We detected 15 enhancing lesions, obtaining dynamic data in 10. Five lesions < 4mm enhanced centrifugally (initial central enhancement expanded outward), and 5 lesions > 4mm enhanced centripetally (initial peripheral enhancement gradually filled the lesion). A leukocortical lesion initially showed enhancement in its white matter portion, which gradually spread into the cortex. 73% of lesions were clearly perivenular.
Conclusion
Most active lesions are perivenular, and the smallest lesions enhance centrifugally. This supports the idea that lesions grow outward from a central vein.
Keywords: veins, contrast enhancing lesions, blood-brain barrier, magnetic resonance imaging, 7 tesla, susceptibility weighted imaging
Introduction
Blood-brain barrier (BBB) disruption typically occurs in new multiple sclerosis (MS) lesions and is associated with inflammation in areas surrounding parenchymal microvessels (1). In vivo opening of the BBB in MS is detectable by MRI, and serial MRI studies show that contrast enhancement is a transient phenomenon due to temporary BBB opening, usually lasting ~1 month. Although relapses with focal neurological deficits sometimes correlate with new contrast-enhancing lesions in the appropriate location, in general neither clinical exacerbations nor other changes in symptoms or signs are strongly correlated with the occurrence of enhancing lesions (2, 3).
Two main patterns of contrast enhancement – the so-called “ring” and “nodular” types of enhancing lesions – have been described in white matter (WM) lesions based on T1-weighted images performed at a single time point several minutes after contrast injection (4). Compared to nodular lesions, ring lesions have been thought to be associated with more severe tissue damage (5, 6). In pathology studies, although heterogeneity of MS lesions has been described (7), no clear histologic differences between the different static patterns of lesion enhancement have been observed (8).
Our prior study of the spatiotemporal patterns of BBB opening, which used dynamic contrast-enhanced (DCE) MRI on a standard clinical 3T magnet, gave insight into the pathogenesis of tissue damage in developing MS lesions (9). Specifically, we demonstrated that newly forming WM lesions > 5 mm in diameter have one of two dynamic patterns of spatiotemporal enhancement: Early, medium-sized lesions enhance centrifugally (central enhancement expands into a nodule), whereas slightly older, larger lesions enhance centripetally (thin peripheral enhancement gradually fills the lesion center). We also found that centrifugally enhancing lesions can evolve into centripetally enhancing lesions (but not vice versa) over several days, which may reflect the outward expansion of MS lesions from their central vein (9). The prominent perivenular inflammation observed in Pattern I and II demyelinated lesions by Lucchinetti et al (7) invites speculation that such lesions may develop via the two dynamic patterns of lesion enhancement that we observed.
Due to limitations in spatial resolution and sensitivity on the 3T magnet, we could not, in our initial study, characterize enhancement dynamics in smaller lesions (< 5mm diameter), nor could we investigate enhancement patterns within gray matter (GM) and the appearance of fine anatomical structures within lesions (e.g., the central vein itself).
To this end, we undertook the present study at 7T, which enabled a more detailed investigation of newly forming lesions. At 7T, the extent of deoxyhemoglobin-related signal loss within veins is magnified on T2*-weighted images, a phenomenon that in a previous study allowed identification of a central vein in 87% of lesions (10). In addition, 7T imaging shows a hypointense peripheral rim in some chronic lesions (11, 12), which, by correlation with ex vivo studies, appears to correspond to macrophages loaded with iron in the peripheral area of chronic active lesions (13, 14). However, no investigations of BBB permeability in acute MS lesions at 7T have been reported to date. Our aim in this study, therefore, was to investigate the dynamics of contrast enhancement and their relationship to intralesional anatomic structures using high-resolution MRI at 7T.
Methods
Participants
We scanned 8 participants with MS under an institutional review board-approved natural history protocol. Based on the identification of contrast-enhancing lesions in scheduled examinations at 3T, individuals were invited to undergo dedicated 7T MRI scans. Experienced MS clinicians determined disability according to the Expanded Disability Status Scale (EDSS) (15) and obtained clinical data.
MRI Protocol
Imaging was performed in a 7T Siemens whole-body scanner using a volume-transmit head coil with 32 receive channels (Nova Medical). Three whole-brain T1-weighted scans (3D MPRAGE; TR=2200ms; TE=2.93ms; TI=1050ms; FA=7deg; AT=6:35min; nominal resolution=0.7x0.7x0.7mm) were acquired before as well as 5 and 20 min after injection of either gadolinium-DTPA or gadobutrol at standard dose (0.1 mmol/kg) over one minute. Contrast was injected while participants were still in the scanner, and during the injection we obtained multiple repeats of a T1-weighted DCE-MRI sequence covering the lesion of interest (3D FLASH; TR=9ms; TE=5.66ms; FA=13deg; 32 slices; AT=32sec per volume; nominal resolution=0.5x0.5x0.8mm). We repeated this sequence at variable time points over a 30min period following contrast administration. We also acquired T2*-weighted images (2D FLASH; TR=1000ms; TE=38ms; 19 slices; FA=55deg; AT=4:34min; nominal resolution=0.3x0.3x1mm) before contrast injection. The total time in the scanner was between 60 and 90 minutes.
Image post-processing
We analyzed MRI data using MIPAV (http://mipav.cit.nih.gov). We rigidly registered the post-contrast T1-MPRAGE and T2*-weighted images to the precontrast T1-MPRAGE images. We also rigidly registered all dynamic volumes to the first scan in which arterial enhancement was evident. We measured the largest diameter of enhancing lesions in pre- and postcontrast T1-MPRAGE images. On the T2*-weighted images, we determined the presence or absence of a central vein and a peripheral hypointense rim within enhancing lesions. We determined the initial pattern of enhancement (nodular, closed ring, or open ring) according to the lesion’s appearance on the first DCE image in which we discerned contrast enhancement. We determined the dynamic enhancement pattern from the 4D DCE volume, as in our previous work (9), or from the three registered sets of T1-MPRAGE images, as either centrifugal or centripetal.
Statistical Analysis
We report results as mean ± overall standard deviation. We used paired t-tests to determine whether there was a difference in the mean size of enhancing lesions before and after contrast injection.
Results
Participants
We studied 8 patients with enhancing lesions, 6 of whom had clinically defined relapsing-remitting MS (RRMS), 1 primary-progressive MS (PPMS), and 1 secondary-progressive MS (SPMS) (Table). Only 2 patients were taking disease-modifying therapy (one interferon and the other glatiramer acetate), and no patient had received intravenous steroids in the month prior to scanning.
Table.
Clinical characteristics
| MS Type | Number | Sex (F/M) | Age (y) | EDSS | DD (y) | Treatment |
|---|---|---|---|---|---|---|
| RRMS | 6 | 5/1 | 33±11 | 1.5 (0–3.5) | 3±3 | 4 UT/2 DMT |
| SPMS | 1 | 1/0 | 48 | 5.5 | 21 | UT |
| PPMS | 1 | 0/1 | 51 | 6 | 11 | UT |
DD=disease duration; UT=untreated; DMT=disease-modifying treatment. Values are given as mean ± standard deviation for age and disease duration, and median (range) for EDSS.
Enhancing lesions
We studied a total of 15 enhancing lesions. We were able to obtain dynamic information, via either DCE-MRI or multiple T1-MPRAGE acquisitions, or both, in 10 of the 15 lesions.
Small lesions enhance centrifugally
We found 5 centrifugally enhancing lesions. These lesions appeared smaller in the precontrast T1-MPRAGE images (mean diameter: 1.9±0.1mm) than in the T1-MPRAGE images performed 5min (3.2±0.6mm, p=0.03) and 20min (3.9±0.4mm, p < 0.001) after contrast injection (examples in Figure 1A-B). Lesion diameter trended toward expansion between the 5 and 20min time points (p=0.07).
Figure 1.
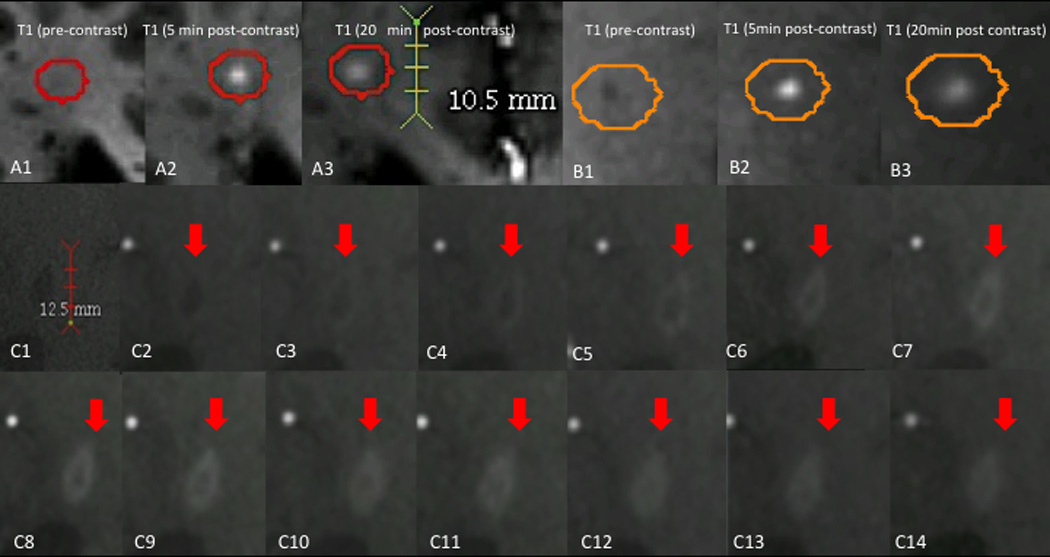
Dynamics of lesion enhancement. A, B: small, centrifugally enhancing lesions. A1, B1: T1-weighted images before contrast injection. A1: Isointense lesion. B1: Hypointense lesion. A2, B2: T1-weighted images 5min after contrast injection, demonstrating homogenously enhancing lesions. A3, B3: T1-weighted images 20min after contrast injection, demonstrating that the enhancement area has enlarged and that contrast material has spread out from the lesion center to the periphery. C: Centripetally enhancing lesion. C1: Precontrast dynamic-contrast enhanced T1-weighted images (DCE-MRI). C2-C14: Dynamic T1-weighted images, obtained using a different imaging sequence, at consecutive time points showing centripetal enhancement of the lesion. An initial ring of enhancement thickens over the time, eventually evolving into a homogenous, nodular enhancing lesion.
DCE-MRI data were analyzable in 2 of these enhancing lesions; the remaining 3 centrifugal lesions were either not captured in the DCE-MRI field of view, which had been set to capture another enhancing lesion in the same person, or obscured by imaging artifacts (e.g., subject motion) that interfered with analysis.
Larger lesions enhance centripetally
We detected 5 centripetally enhancing lesions. Lesions were slightly smaller in the precontrast T1-MPRAGE images (4.9±3.0mm) than in T1-MPRAGE images performed 5min (6.0±0.7mm) and 20min (6.1±1.1mm) after contrast injection. There was an early apparent enlargement of the lesions after gadolinium application (p=0.01); however, there was no significant difference between T1-MPRAGE 5 and 20 min after contrast injection for these lesions (p=0.8). In all of the centripetal lesions, DCE-MRI showed an initial ring of enhancement that was succeeded by centripetal thickening of the ring. In the last DCE scan, 3 of the lesions were fully nodular (Figure 1C), whereas 2 persisted as ring-enhancing.
Most enhancing lesions are perivenular
Eleven out of 15 enhancing lesions (73%) showed a clear central vein in T2*-weighted images. All centripetal lesions had a clear central vein, and in 2 of the small, centrifugal lesions, a clear central vein was also visible (Figure 2A-B).
Figure 2.
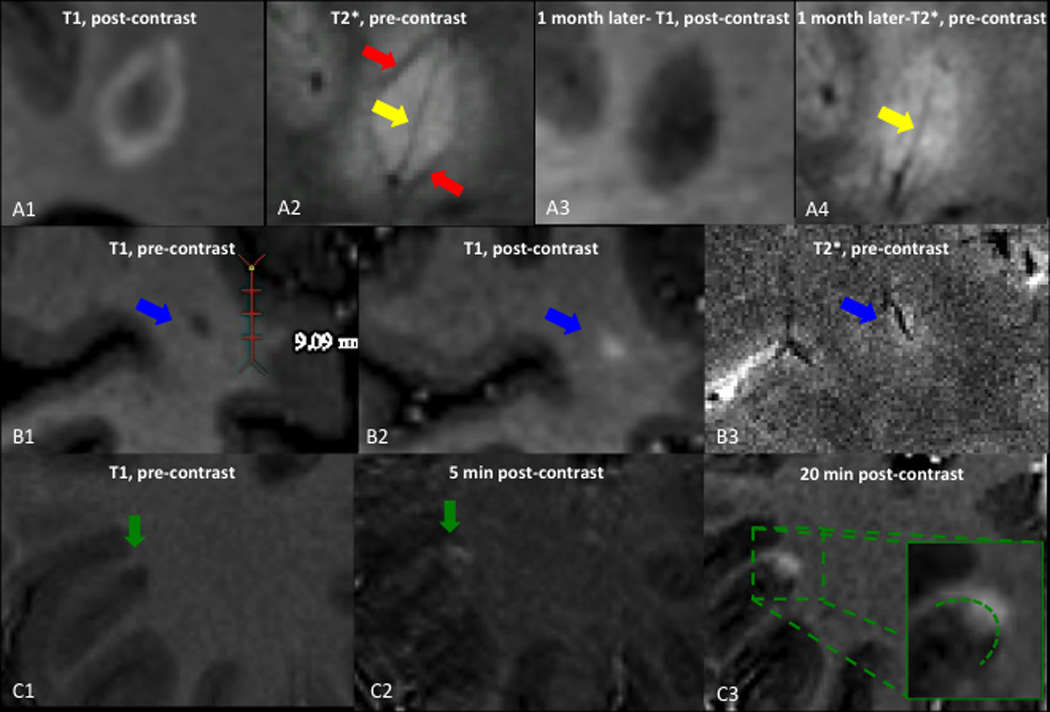
Susceptibility changes in active lesions and cortical enhancement. A: centripetally enhancing lesion, also shown in Figure 1C. A1, A3: T1-weighted images performed 5min after contrast injection. A1: the lesion shows ring enhancement. A3: One month later, enhancement has disappeared. A2, A4: T2*-weighted images. A2: The yellow arrow points to the hypointense central vein, and the red arrow shows a hypointense rim at the edge of the lesion. A4: One month later, the peripheral hypointense rim has almost disappeared, whereas the central vein persists. B1: T1-weighted images before contrast injection shows a small, hypointense lesion. B2: T1-weighted images 5min after contrast injection shows nodular enhancement of the lesion. B3: Precontrast T2*-weighted image shows a small vein centering the lesion. C: Leukocortical lesion. C1: Precontrast T1-weighted images shows a hypointense leukocortical lesion. C2: T1-weighted images 5min after contrast shows enhancement of the white matter portion of the lesion, but not the gray matter portion. C3: T1-weighted images 20min after contrast injection shows passage of contrast into the cortex.
Enhancing lesions can show a T2*-hypointense rim
The T2*-weighted images, which were performed before gadolinium administration, demonstrated a hypointense rim in 2 enhancing lesions. One of these was a lesion that first displayed ring enhancement in a 3T scan performed 3 months earlier. The other was a new centripetal lesion. In the latter, both the enhancement and the hypointense rim had nearly completely resolved in a follow-up 7T scan performed 1 month later (Figure 2A).
Cortical enhancement
A “leukocortical” lesion, spanning the gray-white junction, showed initial enhancement in the WM only on the T1-MPRAGE scan performed 5min after contrast. Only later, on the T1-MPRAGE scan performed 20min after contrast injection, was contrast enhancement visible in the cortex (Figure 2C).
Discussion
In this pilot study, we found that lesions < 4mm in diameter tend to enhance centrifugally, that larger lesions tend to enhance centripetally, and that enhancement in the GM portion of leukocortical lesions is delayed, appearing to arrive via passive spread from the WM rather than direct local opening of the BBB. We also found that most enhancing lesions are centered by a small vein that is visible on high resolution MRI, and that a transient area of T2*-weighted hypointensity at the lesion edge, which is colocalized with the site of BBB opening, can also be detected.
In our previous work (9), we found that small, young lesions enhanced centrifugally, whereas larger, slightly older lesions enhanced centripetally. However, one of the main technical limitations of that study was the lack of characterization of lesions < 5mm in diameter. Our initial investigation of the BBB at higher resolution confirms that larger lesions enhance centripetally and that smaller lesions tend to enhance centrifugally, and in the present dataset all lesions < 4mm in diameter enhanced centrifugally. Two factors may account for the failure to observe centrifugal enhancement in lesions ≥5mm in diameter in the current study: (1) the small sample of lesions analyzed; and (2) the potential that higher resolution dynamic imaging may force reclassification of some centripetal lesions as centrifugal. Regardless, these results reinforce our previous hypothesis that these two patterns of enhancement represent different stages of a single pathophysiological process based on outward expansion of newly forming lesions.
Interestingly, we detected delayed spread of enhancement into the cortex in a single leukocortical lesion. The pathology of active GM lesions differs from that of WM lesions in that significant inflammatory infiltration and BBB disruption is not clearly detected in GM lesions (16, 17). In addition, enhancement in purely cortical lesions (as opposed to lesions that span GM and WM; see (18)) has so far not been clearly demonstrated on MRI. We therefore believe that passage into the GM of contrast material that has already leaked into the WM component of the lesion is responsible for this finding.
In one of the centripetally enhancing lesions imaged with DCE-MRI, we detected slight outward spread of enhancement from the initially enhancing peripheral ring into the normal appearing white matter. This gradual spread on DCE-MRI seems to be a different phenomenon from the apparent enlargement of lesions on the two T1-MPRAGE scans performed after contrast administration, compared to the precontrast T1-MPRAGE. We believe that this apparent enlargement on T1-MPRAGE may relate to the lesion rim’s isointensity to white matter on precontrast T1-MPRAGE, perhaps due to the presence of reactive oxygen species or proteins that change the tissue’s longitudinal relaxation time constant. This rim, which is the locus of BBB opening, enhances avidly in these lesions, raising signal intensity relative to white matter and thus increasing the apparent size of the lesion. Overall, however, the timing of the dynamic events in enhancing lesions suggests that flow of the contrast agent through tissue, rather than local BBB opening, may be responsible for most of the directional patterns of contrast spreading.
An important limitation of our previous work was the lack of visualization of anatomical structures within lesions. Similar to what has been previously described on noncontrast 7T studies (10), we found that 73% of enhancing lesions are centered by a small but clearly discernible vein. Although our studies were performed at high spatial resolution, it is possible that central veins in some lesions were too small to be detected. Regardless, this finding strengthens the hypothesis that new lesions expand outward from a central vein at least in part by centrifugal spread of soluble factors, as we suggested in our previous paper.
We also found that a peripheral hypointense rim on T2*-weighted images, a finding that appears to be stable when observed in chronic lesions (11) but that has not previously been described in acute lesions, may be present in actively enhancing lesions as a transient phenomenon. In a previous study, a rim with similar signal characteristics on MRI stained positive for microglia and iron, suggesting the accumulation of iron-laden macrophages possibly related to oligodendrocyte damage (13).
In the two acute lesions reported here, the hypointense rim colocalized with the area of BBB opening as seen on postcontrast T1-weighted images, and in the one case where follow-up imaging was available, disappeared as the contrast enhancement resolved. This suggests that a T2* hypointense rim may be an intrinsic sign of BBB opening, possibly reflecting the leakage of paramagnetic serum proteins or the presence of paramagnetic reactive oxygen species associated with the inflammatory process. It is of course possible that iron-laden macrophages are responsible for this finding as well, but the transient nature of the finding and its temporal association with gadolinium leakage, make this less likely in our view. Dedicated studies looking at local variations in magnetic susceptibility could potentially clarify this issue.
Limitations
The main limitation of the present study is the limited number of cases (only 15 enhancing lesions), which means that we can only report our initial observations about enhancement properties at high resolution. An additional important limitation is the lack of histopathology data to test our hypotheses. Finally, scans were limited to 90 minutes, and postcontrast images were acquired only during the final 30 minutes. Thus, the delayed contrast-enhanced data reported in our prior study are not available here.
Conclusions
Active MS lesions, like their chronic counterparts, are centered by a vein that is visible on high-resolution MRI, which supports the pathology-derived concept that lesions grow outward from a central vein. Additionally, diffusion of contrast through tissue, rather than local BBB opening, seems to be responsible for the observed spatiotemporal enhancement dynamics, including in leukocortical lesions.
Acknowledgments
This study was supported by the Intramural Research Program of NINDS. We thank the study participants, the NIH Functional Magnetic Resonance Imaging Facility technologists for technical support, and the Neuroimmunology Branch clinical group for coordinating the scanning.
Footnotes
Conflict of Interest Statement
The authors have nothing to disclose.
References
- 1.Alvarez JI, Cayrol R, Prat A. Disruption of central nervous system barriers in multiple sclerosis. Biochim Biophys Acta. 2010 doi: 10.1016/j.bbadis.2010.06.017. Epub 2010/07/14. [DOI] [PubMed] [Google Scholar]
- 2.Bastianello S, Pozzilli C, Bernardi S, Bozzao L, Fantozzi LM, Buttinelli C, et al. Serial study of gadolinium-DTPA MRI enhancement in multiple sclerosis. Neurology. 1990;40(4):591–595. doi: 10.1212/wnl.40.4.591. Epub 1990/04/01. [DOI] [PubMed] [Google Scholar]
- 3.Harris JO, Frank JA, Patronas N, McFarlin DE, McFarland HF. Serial gadolinium-enhanced magnetic resonance imaging scans in patients with early, relapsing-remitting multiple sclerosis: implications for clinical trials and natural history. Ann Neurol. 1991;29(5):548–555. doi: 10.1002/ana.410290515. Epub 1991/05/01. [DOI] [PubMed] [Google Scholar]
- 4.Kermode AG, Tofts PS, Thompson AJ, MacManus DG, Rudge P, Kendall BE, et al. Heterogeneity of blood-brain barrier changes in multiple sclerosis: an MRI study with gadolinium-DTPA enhancement. Neurology. 1990;40(2):229–235. doi: 10.1212/wnl.40.2.229. Epub 1990/02/01. [DOI] [PubMed] [Google Scholar]
- 5.Morgen K, Jeffries NO, Stone R, Martin R, Richert ND, Frank JA, et al. Ring-enchancement in multiple sclerosis: marker of disease severity. Mult Scler. 2001;7(3):167–171. doi: 10.1177/135245850100700306. Epub 2001/07/28. [DOI] [PubMed] [Google Scholar]
- 6.Davis M, Auh S, Riva M, Richert ND, Frank JA, McFarland HF, et al. Ring and nodular multiple sclerosis lesions: a retrospective natural history study. Neurology. 2010;74(10):851–856. doi: 10.1212/WNL.0b013e3181d31df5. Epub 2010/03/10. [DOI] [PMC free article] [PubMed] [Google Scholar]
- 7.Lucchinetti C, Bruck W, Parisi J, Scheithauer B, Rodriguez M, Lassmann H. Heterogeneity of multiple sclerosis lesions: implications for the pathogenesis of demyelination. Ann Neurol. 2000;47(6):707–717. doi: 10.1002/1531-8249(200006)47:6<707::aid-ana3>3.0.co;2-q. Epub 2000/06/14. [DOI] [PubMed] [Google Scholar]
- 8.Bruck W, Bitsch A, Kolenda H, Bruck Y, Stiefel M, Lassmann H. Inflammatory central nervous system demyelination: correlation of magnetic resonance imaging findings with lesion pathology. Annals of neurology. 1997;42(5):783–793. doi: 10.1002/ana.410420515. Epub 1997/12/10. [DOI] [PubMed] [Google Scholar]
- 9.Gaitan MI, Shea CD, Evangelou IE, Stone RD, Fenton KM, Bielekova B, et al. Evolution of the blood-brain barrier in newly forming multiple sclerosis lesions. Ann Neurol. 2011;70(1):22–29. doi: 10.1002/ana.22472. Epub 2011/06/29. [DOI] [PMC free article] [PubMed] [Google Scholar]
- 10.Tallantyre EC, Morgan PS, Dixon JE, Al-Radaideh A, Brookes MJ, Evangelou N, et al. A comparison of 3T and 7T in the detection of small parenchymal veins within MS lesions. Invest Radiol. 2009;44(9):491–494. doi: 10.1097/RLI.0b013e3181b4c144. Epub 2009/08/05. [DOI] [PubMed] [Google Scholar]
- 11.Bian W, Harter K, Hammond-Rosenbluth KE, Lupo JM, Xu D, Kelley DA, et al. A serial in vivo 7T magnetic resonance phase imaging study of white matter lesions in multiple sclerosis. Mult Scler. 2012 doi: 10.1177/1352458512447870. Epub 2012/05/30. [DOI] [PubMed] [Google Scholar]
- 12.Yao B, Bagnato F, Matsuura E, Merkle H, van Gelderen P, Cantor FK, et al. Chronic multiple sclerosis lesions: characterization with high-field-strength MR imaging. Radiology. 2012;262(1):206–215. doi: 10.1148/radiol.11110601. Epub 2011/11/16. [DOI] [PMC free article] [PubMed] [Google Scholar]
- 13.Pitt D, Boster A, Pei W, Wohleb E, Jasne A, Zachariah CR, et al. Imaging cortical lesions in multiple sclerosis with ultra-high-field magnetic resonance imaging. Arch Neurol. 2010;67(7):812–818. doi: 10.1001/archneurol.2010.148. Epub 2010/07/14. [DOI] [PubMed] [Google Scholar]
- 14.Bagnato F, Hametner S, Yao B, van Gelderen P, Merkle H, Cantor FK, et al. Tracking iron in multiple sclerosis: a combined imaging and histopathological study at 7 Tesla. Brain. 2011;134(Pt 12):3602–3615. doi: 10.1093/brain/awr278. Epub 2011/12/16. [DOI] [PMC free article] [PubMed] [Google Scholar]
- 15.Kurtzke JF. A new scale for evaluating disability in multiple sclerosis. Neurology. 1955;5(8):580–583. doi: 10.1212/wnl.5.8.580. Epub 1955/08/01. [DOI] [PubMed] [Google Scholar]
- 16.Bo L, Vedeler CA, Nyland H, Trapp BD, Mork SJ. Intracortical multiple sclerosis lesions are not associated with increased lymphocyte infiltration. Mult Scler. 2003;9(4):323–331. doi: 10.1191/1352458503ms917oa. Epub 2003/08/21. [DOI] [PubMed] [Google Scholar]
- 17.van Horssen J, Brink BP, de Vries HE, van der Valk P, Bo L. The blood-brain barrier in cortical multiple sclerosis lesions. J Neuropathol Exp Neurol. 2007;66(4):321–328. doi: 10.1097/nen.0b013e318040b2de. Epub 2007/04/07. [DOI] [PubMed] [Google Scholar]
- 18.Popescu BF, Lucchinetti CF. Meningeal and cortical grey matter pathology in multiple sclerosis. BMC neurology. 2012;12:11. doi: 10.1186/1471-2377-12-11. Epub 2012/03/09. [DOI] [PMC free article] [PubMed] [Google Scholar]