

Summary
Plants exhibit an extraordinary range of genome sizes, varying by > 2000‐fold between the smallest and largest recorded values. In the absence of polyploidy, changes in the amount of repetitive DNA (transposable elements and tandem repeats) are primarily responsible for genome size differences between species. However, there is ongoing debate regarding the relative importance of amplification of repetitive DNA versus its deletion in governing genome size.
Using data from 454 sequencing, we analysed the most repetitive fraction of some of the largest known genomes for diploid plant species, from members of Fritillaria.
We revealed that genomic expansion has not resulted from the recent massive amplification of just a handful of repeat families, as shown in species with smaller genomes. Instead, the bulk of these immense genomes is composed of highly heterogeneous, relatively low‐abundance repeat‐derived DNA, supporting a scenario where amplified repeats continually accumulate due to infrequent DNA removal.
Our results indicate that a lack of deletion and low turnover of repetitive DNA are major contributors to the evolution of extremely large genomes and show that their size cannot simply be accounted for by the activity of a small number of high‐abundance repeat families.
Keywords: DNA deletion, Fritillaria, genome size evolution, genome turnover, Liliaceae, repetitive DNA, transposable elements (TEs)
Introduction
Genome size may differ by > 40‐fold between species of the same ploidy within a single genus of plants (Bennett & Leitch, 2012; Kelly et al., 2012). The observation that a few families (Hawkins et al., 2006; Piegu et al., 2006), or even a single family (Neumann et al., 2006), of transposable elements (TEs) can dominate plant genomes and account for variation in genome size between closely related species has led to the suggestion that differences in the propensity for TE amplification play a primary role in governing genome size change (Grover & Wendel, 2010). However, at least some plant and animal species with large genomes appear to lose DNA more slowly than those with smaller genomes (Bensasson et al., 2001; Wicker & Keller, 2007; Hawkins et al., 2009; Hu et al., 2011; Sun et al., 2012a), indicating that differences in the rate of DNA removal may play an important role in determining genome size. Recombination‐based mechanisms, such as illegitimate recombination and unequal intrastrand homologous recombination, can delete substantial amounts of DNA (Ma et al., 2004) and comparatively high rates of deletion in smaller genomes may result in a dearth of ancient TE copies, as amplified DNA is rapidly purged (Wang & Liu, 2008; Hawkins et al., 2009; The International Brachypodium Initiative, 2010; Blass et al., 2012). Nevertheless, it has also been argued that variation in DNA removal rate is unlikely to be the major determinant of genome size (Vitte & Bennetzen, 2006), and the significance of differences in the efficiency of DNA deletion in governing genome expansions remains unclear.
If the general view that plant genomes expand as a result of increased activity of relatively few repeat families (Vitte & Bennetzen, 2006; Elbaidouri & Panaud, 2013; reviewed by Bennetzen & Wang, 2014) holds true, differences between species with extremely large genome sizes should also be explained by the proliferation of a small number of highly abundant repeats. To test this prediction, we analysed the repeat content of species of Fritillaria, a genus in the lily family (Liliaceae; monocotyledons) that represents the most extreme case known in plants of absolute genome size expansion independent of recent whole‐genome duplication. Reported genome size (1C) values in diploid Fritillaria vary between 30.15 and 85.38 Gb (Leitch et al., 2007; Ambrožová et al., 2011). This c. 55 Gb difference equates to > 350 times the size of the Arabidopsis thaliana genome (Bennett et al., 2003; Bennett & Leitch, 2012) and > 860 times that of Genlisea aurea, the smallest land plant genome sequenced to date (Leushkin et al., 2013). Assuming a similar amount of non‐TE‐related genes as in other monocotyledon genomes, such as banana (Musa acuminata) (139 Mb; D'Hont et al., 2012) and rice (Oryza sativa) (101 Mb; International Rice Genome Sequencing Project, 2005), < 1% of Fritillaria genomes would comprise protein‐coding gene sequences. Moreover, genome sizes in excess of 50 Gb appear to have arisen independently in separate lineages of Fritillaria (Leitch et al., 2007; Ambrožová et al., 2011), providing an unparalleled opportunity to examine replicated expansions near the upper end of the genome size scale.
Materials and Methods
Taxon sampling and plant material
We selected Fritillaria affinis (Schultes) Sealy and Fritillaria imperialis L. to test the hypothesis that differences in genome sizes between species are governed by differential amplification of a small number of highly abundant repeats. Each species represents one of two major species groups within Fritillaria (Rønsted et al., 2005; Supporting Information Fig. S1) and has a genome size of c. 45 Gb (Ambrožová et al., 2011; Table S1). Low‐pass 454 sequencing was conducted on eight further species (Fig. S1); these were included so that repetitive elements that have amplified specifically in F. affinis or F. imperialis could be identified. Species were selected to represent different Fritillaria subgenera (Rix, 2001), and its sister group Lilium (Rønsted et al., 2005), and to span the range of known genome sizes in the genus (Leitch et al., 2007; Ambrožová et al., 2011). For phylogenetic reconstruction of evolutionary relationships and inference of ancestral genome size, we used an expanded set of species (Table S2) including members of all eight subgenera of Fritillaria, and representatives of related genera within the Liliaceae (Fig. S1).
DNA extraction
Total genomic DNA was extracted from fresh or silica‐dried leaves using a cetrimonium bromide (CTAB) method modified from Doyle & Doyle (1987) with purification via CsCl density‐gradient ultracentrifugation. Alternatively, existing DNA was taken from the DNA bank at the Royal Botanic Gardens, Kew (Table S2).
Chromosome counts
Chromosome counts were conducted to verify ploidy of individuals used for 454 sequencing and genome size estimation. Young roots were pretreated with saturated alpha‐bromonaphthalene at 4°C for 24 h, fixed in ethanol : glacial acetic acid (3 : 1) at 4°C for 48 h, and stored in 70% ethanol at −20°C. Roots were washed in double distilled water at room temperature (RT) for c. 30 min, hydrolysed in 1 M HCl at 60°C for 4–12 min, and stained with Schiff's reagent for ≥ 30 min at RT. Root tips were squashed in 45% acetic acid and counterstained with 2% aceto‐orcein as necessary. Where suitable root material was unavailable, we used published counts from the same accessions (Leitch et al., 2007; Ambrožová et al., 2011). Where counts could not be obtained for accessions used for genome size estimation, ploidy was inferred by comparing the 1C values with published measurements from the same, or closely related, species with known ploidy (Table S3).
Genome size estimation by flow cytometry (FC)
We used FC to estimate nuclear DNA contents of all species included in 454 sequencing (Fig. S1) and for species included in phylogenetic analyses, where previously published FC estimates were not available. Samples were prepared and analysed as described in Pellicer et al. (2014); Pisum sativum (‘Ctirad’; 1C = 4445 Mb; Doležel et al., 1998) and Allium cepa (‘Ailsa Craig’; 1C = 16405 Mb; Van't Hof, 1965) were used as internal standards. For each individual analysed, three samples were prepared (from separate leaves or different parts of the same leaf) and three replicates of each sample run. Fresh leaf material was unavailable for Fritillaria pluriflora, and therefore a value estimated previously for the same accession with Feulgen microdensitometry (FM) was used (Table S1).
Phylogenetic analysis of species relationships
Relationships between Fritillaria species and related genera were reconstructed from a combined data set comprising sequences from three plastid genome regions: c.1.6 kb of the maturase K (matK) gene, c.1.4 kb of the ribulose‐1,5‐bisphosphate carboxylase/oxygenase large subunit (rbcL) gene and c.1.4 kb of the ribosomal protein L16 (rpl16) gene (partial intron and 3ʹ exon). Sequences were either taken from Day et al. (2014) or amplified and sequenced as described in Day et al. (2014). Sequences used in phylogenetic analyses have been submitted to GenBank (accession nos. KP998197–KP998208; see Table S2). As a consequence of low levels of variation, sequences were aligned manually using macclade v4.04 (Maddison & Maddison, 2002); indels within coding regions were aligned so as to maintain the correct reading frame. Phylogenetic analyses were conducted using maximum parsimony and Bayesian inference (BI). Maximum parsimony analyses were conducted in PAUP* v4.0 b10 (Swofford, 2003) as described in Kelly et al. (2013). For phylogenetic analyses using BI, best‐fit models of evolution for each data set were selected with the Akaike Information Criterion in mrmodeltest v2.3 (Nylander, 2004). Data sets were partitioned into separate codon positions for matK and rbcL and codon positions and intron for rpl16; model testing was carried out on each partition separately. Analysis by BI was carried out using mrbayes v3.2.1 (Ronquist et al., 2012) as described in Kelly et al. (2013). Parameter values from each run were viewed in tracer v1.5 (Rambaut & Drummond, 2009) to confirm that effective sample sizes of > 200 had been obtained for each parameter and stationarity reached. Trees sampled during the first 500 000 generations of each run were discarded as the burn‐in. A majority rule consensus tree showing all compatible groupings was constructed using bayestrees v1.3 (www.evolution.reading.ac.uk/BayesTrees.html) (Fig. S1). The combined alignment and phylogenetic trees have been submitted to TreeBase (study accession: S16132).
Ancestral genome size reconstruction
To test for evidence of independent genomic expansions in F. affinis and F. imperialis, we conducted ancestral genome size reconstruction using genome size data listed in Table S1. To remove the effect of genome size increase resulting from recent polyploidization, monoploid genome size (1Cx; Greilhuber et al., 2005) values were used; 1Cx‐values were calculated by dividing the 2C value by the ploidy level (Table S3). Ancestral genome sizes were reconstructed for the most recent common ancestor (MRCA) of the clades containing F. affinis and F. imperialis (Figs 1, S1) using bayestraits v1.1beta by analysing genome sizes for extant species (1Cx‐values in Gb; Table S1) as continuously varying data (Pagel, 1997, 1999) along with the 36 000 post burn‐in trees from the mrbayes analysis. The 1Cx‐values from Fritillaria and relatives have a distribution that is significantly different from normal (one‐sample Kolmogorov–Smirnov test of untransformed data; P = 0.008). Therefore, before analysis they were Box‐Cox transformed using the bcPower function in the ‘car’ package of R (R Core Team, 2014) with a lambda setting of −2 (one‐sample Kolmogorov–Smirnov test of transformed data; P = 0.443).
Figure 1.
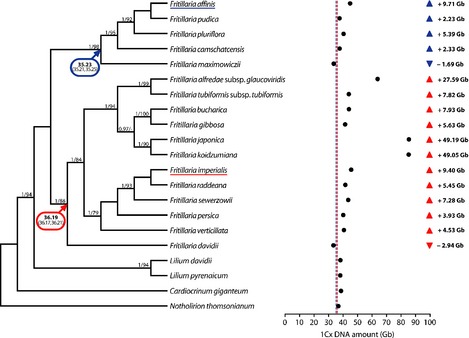
Ancestral genome size reconstruction and evidence for genome expansion in Fritillaria. Phylogenetic relationships between species of Fritillaria and related genera are shown; values above branches indicate node support (posterior probabilities of ≥ 0.95/bootstrap percentages ≥ 70). Ancestral genome sizes for the most recent common ancestor (MRCA) of each major Fritillaria clade are shown; 95% confidence intervals are given in parentheses. Closed circles indicate monoploid genome size (1Cx‐values in Gb) for extant species; dashed lines indicate the ancestral genome sizes for the MRCA of the F. affinis (blue) and F. imperialis (red) clades. For each species of Fritillaria, the increase or decrease in genome size relative to the MRCA of its clade is indicated.
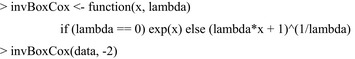
The best‐fit model for analysis of continuously varying characters (i.e. random walk versus directional) was selected by conducting Bayes factor tests using the logarithm of the harmonic mean estimated from five separate runs of bayestraits (as outlined in the bayestraits manual; www.evolution.rdg.ac.uk/Files/BayesTraits-V1.0-Manual.pdf) under the Markov Chain Monte Carlo option, with the following settings: 1000 million iterations, burn‐in of 250 million iterations, sampling every 10 000 generations, estimating the scaling parameters (δ, κ and λ) and with the RateDev (RD) parameter optimized to maximize the number of iterations with the recommended 20–40% acceptance rate. The directional model was favoured in the majority of iterations and was therefore selected, and the posterior distribution of model parameters generated used to specify the model settings for the second phase of analysis during which genome sizes of internal nodes were estimated using the addMRCA command. All settings were as described above for the first phase with the exception that the DataDev (DD) parameter was optimized to maximize the number of iterations within the 20–40% acceptance rate. At both stages of the analysis, parameter values were examined in tracer v1.5 to confirm that a sufficient burn‐in had been removed and stationarity reached. The final settings used for RD and DD were 0.00008 and 0.00035, respectively. Values for the ancestral genome size of subgenus Liliorhiza and the Eurasian clade were calculated by averaging all estimates for these nodes from the 75 001 post burn‐in iterations. The 95% confidence intervals for the mean values were calculated in R using the t‐test command (R Core Team, 2014). Mean and confidence interval values were back transformed in R using the following commands:
Impact of genome size estimation method on ancestral genome size reconstruction
Because alternative genome size estimation methods (e.g. FM versus FC) can yield different results (e.g. fig. 1 in Ambrožová et al., 2011), we tested the impact of using 1Cx‐values from different methods on ancestral genome size reconstruction. The bayestraits analyses were repeated with F. pluriflora, the only species with a 1Cx‐value estimated by FM (Table S1), pruned from the trees (using bayestrees v1.3) and removed from the input 1Cx‐values. Parameter values were checked again to confirm that appropriate settings for RD and DD had been used (i.e. 0.00008 for RD and 0.00035 for DD), and to ensure that stationarity had been reached.
454 sequencing
Sequencing of total genomic DNA was conducted by the University of Liverpool Centre for Genomic Research (Liverpool, UK) and Creative Genomics (New York, NY, USA) using the Roche 454 GS FLX Titanium system; initial processing of reads, including removal of adaptor sequences, was conducted by the sequencing centres. Two runs each were performed for F. affinis and F. imperialis, generating 2428 117 and 2393 894 reads, respectively. One‐eighth of a run was generated for each of the eight remaining species, producing 86 783–118 017 reads per species. 454 sequence data have been submitted to the European Nucleotide Archive (ENA; accession no. PRJEB6757). We used cd‐hit‐454 v4.5.6 (Niu et al., 2010) to identify exact duplicate 454 reads (the same length with 100% similarity), which are probably artefacts of emulsion PCR (Gomez‐Alvarez et al., 2009), with the following parameter settings: ‐c 1 ‐aL 1 ‐aS 1 ‐D 0 ‐g 1. From clusters of duplicate reads identified by cd‐hit‐454, custom Perl scripts were used to remove redundant reads from each 454 data set (retaining a single read from each cluster).
To identify reads of organellar origin, all unique 454 reads were screened against custom databases of monocot plastid genomes (all genomes available from NCBI at the time of analysis and a draft plastid genome sequence of Lilium superbum; Givnish et al., 2010) and monocot mitochondrial genomes (all genomes available from NCBI at the time of analysis) using the stand‐alone version of Blast (v2.2.16; Altschul et al., 1997). Parameter settings used for Blastn searches were: ‐v 1 ‐G 0 ‐E 2 ‐K 0 ‐b 0 ‐e 0.000001 ‐F mL. Reads with a significant hit (E‐value ≤ 1 × 10⁻⁶) to the plastid or mitochondrial databases were filtered from the 454 data sets using a custom Perl script. All remaining reads were considered to be of nuclear origin; we refer to these as the ‘unique nuclear reads’ (Table S4).
De novo identification of repetitive sequence families in Fritillaria
To generate reference sequences for repetitive element families from the Fritillaria genomes, we performed graph‐based clustering of unique nuclear 454 reads using the repeatexplorer pipeline via galaxy (Novák et al., 2010, 2013). Clustering was performed separately for F. affinis and F. imperialis to create a reference set of repeat families for each. Initial runs of repeatexplorer revealed that the number of reads from F. affinis that it is possible to cluster is limited by the presence of a relatively high‐abundance tandem repeat (corresponding to the FriSAT1 repeat identified by Ambrožová et al., 2011). The number of reads that can be analysed simultaneously by repeatexplorer is governed by the number of similarity hits produced, as all read overlaps are loaded into the computer memory during the graph‐based clustering step (Novák et al., 2013). Consequently, this limit does not differ greatly between, for example, 200 and 400 bp reads (it is recommended that reads of the same length are used), allowing coverage to be increased by analysing longer reads. Therefore, to maximize the genome coverage for F. affinis, clustering was performed on 400 bp reads; custom Perl scripts were used to trim reads of > 400 bp from the 3′ end and to remove any reads of < 400 bp. For F. affinis, all 400 bp reads were inputted into repeatexplorer, allowing it to randomly subsample the data set to the maximum number of reads that could be processed (830 674 of 1056 953 available 400 bp reads were used). A random sample of 400 bp reads (842 670) from F. imperialis was taken using the sequence sampling tool (v1.0.0) in repeatexplorer to create a data set providing the same level of genome coverage (0.74%) as for F. affinis. The clustering pipeline was run with ≥ 220 bp overlap for clustering and ≥ 160 bp overlap for assembly. All clusters containing ≥ 0.01% of the input reads were examined manually to identify clusters that required merging (i.e. where there was evidence that a single repeat family had been split over multiple clusters). Clusters were merged if they met the following criteria: they formed connected components with a significant number of similarity hits between the clusters (e.g. in a pair of clusters, 5% of the reads in the smaller cluster had Blast hits to reads in the larger cluster); they were of the same repeat type (e.g. Copia LTR retrotransposons); they would be merged in a logical position (e.g. for repetitive elements containing conserved domains, clusters were only merged if it would result in the conserved domains being joined in the correct order). The reclustering pipeline was run using ≥ 160 bp overlap for assembly and the merged clusters were examined manually to verify that all domains were in the correct orientation.
Clusters were annotated in repeatexplorer according to hits from Blast searches to the repeatmasker Viridiplantae database and to a database of conserved domains; where a substantial number of reads matched the same repeat type (e.g. 20% of reads in the cluster matching a Gypsy LTR retrotransposon) these annotations were retained. For clusters not annotated in repeatexplorer (i.e. no significant Blast hits), or where only very few reads had a Blast hit or separate reads matched different repeat types (i.e. inconsistent Blast hits), contigs were searched against GenBank using Blastn and Blastx (Altschul et al., 1997) and submitted to Tandem Repeat Finder (Benson, 1999).
To calculate the proportion of the genome (genome proportion (GP)) comprised of each repeat family (i.e. cluster), we conducted Blast searches of all unique nuclear reads (Table S4) against databases of the contigs from the clustering analysis. GP was calculated for all clusters containing ≥ 0.05% of the reads inputted into repeatexplorer (Tables S5, S6; we refer to these as the ‘top’ repeat families); we used ≥ 0.05% reads as a cut‐off as these clusters contain > 165 kb of data, which is sufficient to provide several‐fold coverage for most known repetitive elements (e.g. see http://gydb.org), and therefore can be expected to represent complete elements. Contigs from all clusters were used to create separate custom Blast databases for F. affinis and F. imperialis using the makeblastdb tool in Blast+ (v2.2.24+; Camacho et al., 2009). The unique nuclear read data sets from each of the 10 species sequenced (Table S4) were searched against each database using megablast in the Blastn tool in Blast+ (v2.2.24+). To capture the maximum number of hits, searches were conducted with a relaxed E‐value of 100 and no filter for low‐complexity sequence (further increases to the E‐value cut‐off did not result in additional hits); a single hit was recorded for each read. Blast results were then filtered using a custom Perl script to retain only those where ≥ 55% of the query read matched one of the contigs, with ≥ 90% similarity between the query and subject in the matching portion. We calculated the GP from the filtered Blast hits using a custom Perl script. For each contig, the number of bases of the query sequence participating in the top high‐scoring pair for each Blast hit was summed to give the total number of bp representing each contig in the data sets of unique nuclear reads. For each cluster, the number of bp for all of its contigs was summed and expressed as a percentage of the total data set size (i.e. total number of bp in the set of unique nuclear reads; Table S4) to give the value for GP. The genomic abundance of each cluster in Mb was calculated as follows: (total Mb of cluster in data set × genome size in Mb/data set size in Mb). GP and Mb estimates for the top clusters in F. affinis and F. imperialis are shown in Tables S5 and S6.
Statistical analyses
To test the relationship between the amount of single/low‐copy DNA in the genome (the S/L fraction) and overall genome size, we used data from published DNA reassociation studies (Thompson, 1978; Wenzel & Hemleben, 1982; Elsik & Williams, 2000; Table S7). Estimates of the percentage of S/L DNA (often referred to as the ‘unique’ or ‘single‐copy’ fraction in older references, but here conservatively called the S/L fraction) were used to calculate the size of this portion of the genome in Mb on the basis of the prime 1C value for each species from release 6.0 of the Plant DNA C‐values Database (Bennett & Leitch, 2012). Any duplicate values for the estimated percentage of S/L DNA (i.e. values from earlier studies compiled in later publications) were removed; where there were multiple independent estimates for a species, we averaged all the percentages and used this mean value. The size of the S/L fraction was calculated on the basis of both 1C and 1Cx genome size (Table S7). Ploidy values were taken from the Plant DNA C‐values Database, as this information was sometimes lacking in the original DNA reassociation studies (Thompson, 1978; Wenzel & Hemleben, 1982; Elsik & Williams, 2000); where the Plant DNA C‐values Database contained entries for individuals of different ploidies from the same species, we used the C values for diploids to calculate the size of the S/L fraction in Mb, as the percentage of S/L DNA estimated should be the same irrespective of ploidy. Correlation between the size of the S/L fraction per 1C and 1Cx genome and total genome size (expressed both as 1C and 1Cx‐values) was tested using Kendall's tau‐b from the ‘Kendall’ package in R for all species simultaneously and for separate plant families where data were available for at least five species (Fig. S2).
Results
Extreme genome size expansions occur independently in Fritillaria
In order to test the prediction that extreme genome size expansion occurs via the massive amplification of a few repeat families, we analysed two species of Fritillaria with similar monoploid genome sizes (1Cx‐value = 2C value/ploidy level; Greilhuber et al., 2005), F. affinis (1Cx = 44.94 Gb) and F. imperialis (1Cx = 45.59 Gb; Table S1). To verify whether genomic expansion occurred separately in these species, we reconstructed the genome size for the MRCA of each clade. The results show that both species have a genome > 9 Gb larger than the estimate for the MRCA of their clade (Fig. 1), corroborating phylogenetically independent increases in each lineage. Analyses with or without F. pluriflora (see the Materials and Methods section) yielded very similar results (35.226/35.084 Gb with/without F. pluriflora for the MRCA of the Liliorhiza clade; 36.192/36.162 Gb for the MRCA of the Eurasian clade). Therefore, ancestral genome size values estimated with all species were used.
Extreme genome expansions are not governed by the activity of just a few repeat families
To identify sequences involved in these independent genome expansions, we conducted low‐pass 454 sequencing (c. 2% genome coverage) to capture the most highly repeated components. We clustered separately 454 reads at the same level of coverage for each species (0.74%) to identify different families of repeats. For each cluster containing ≥ 0.05% of the input reads (i.e. the ‘top’ repeat families; n = 47 in F. affinis and n = 41 in F. imperialis), we used all 454 reads to estimate the number of Mb and proportion of the genome (GP) comprised of this repeat (see the Materials and Methods section). The top repeats in F. affinis together account for 9.44 Gb, or 21.00% of the genome (Fig. 2; Table S5); only three individually have a GP of ≥ 1%, with the most abundant family having a GP of 11.19% (> 5 Gb; Fig. 2; Table S5). In F. imperialis, the top repeats account for 3.95 Gb, or 8.66% of the genome (Fig. 2; Table S6); the most abundant repeat has a GP of 1.64% and is the only family comprising ≥ 1% of the genome. Despite the presence in F. affinis of a repeat constituting > 11% of the genome, the top repeats together do not account fully for the estimated 9.71‐Gb expansion. In F. imperialis, amplification of the top repeats explains only 42% of the estimated expansion. Moreover, these calculations assume that the F. affinis and F. imperialis repeats were either absent in their respective ancestors or present in few copies. To test whether these repeats show evidence of specific amplification in the F. affinis and F. imperialis lineages, we estimated their abundance in eight additional species (Fig. S1). The most abundant repeats from F. affinis and F. imperialis comprise ≥ 200 and ≥ 101 Mb, respectively, in each of the nine other species (Fig. 2; Tables S5, S6). Assuming similar minimum abundances in the MRCA of their lineages, this implies that up to 9.24 Gb of the 9.44 Gb comprised of these repeats in F. affinis and up to 3.85 Gb of the 3.95 Gb in F. imperialis result from amplification subsequent to divergence from their ancestors. This accounts for 95% of the estimated expansion in F. affinis and 41% of that in F. imperialis. Thus, neither independent genome expansion fits a model of genome size increase via massive amplification of a handful of repeat families. Moreover, as these values encompass all repeat families of ≥ 0.05% GP, any remaining families have a GP of < 0.05% (equivalent to < 23 Mb per family). Consequently, c. 80–90% of the DNA of these species is predicted to comprise repeat families of ≤ 0.05% GP, indicating that the vast majority of their genomes are made up of a heterogeneous set of relatively low‐abundance DNA.
Figure 2.
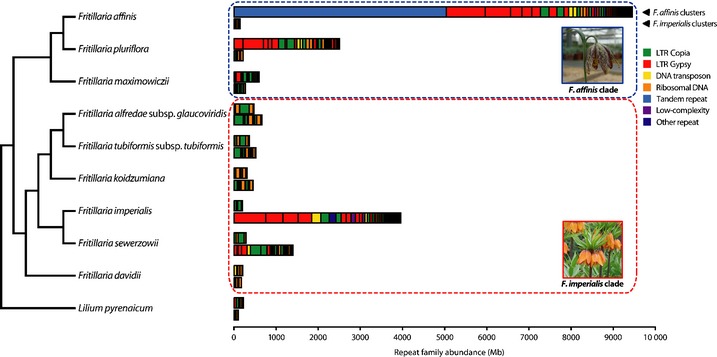
Cumulative abundance of the most common repeat families from Fritillaria affinis and Fritillaria imperialis. For each species, the abundance in their genome of the top repeat families identified from F. affinis (upper bar) and F. imperialis (lower bar) is shown in megabases (Mb). Repeat families are ordered from left to right according to their abundance in F. affinis (upper bar in each pair) and F. imperialis (lower bar in each pair) and coloured according to repeat type; LTR, long terminal repeat retrotransposon. The summary of relationships between the 10 species is derived from the phylogenetic tree shown in Fig. 1.
A potential cause of contrasting patterns of repeat diversity between species is the application of different stringency levels when delimiting repetitive element families and assessing their abundance. To test whether our approach to de novo identification and quantification of repeat families may be responsible for the different pattern of repeat diversity detected in Fritillaria to that expected on the basis of data from other species, we used the same methods to analyse data from barley (Hordeum vulgare), a species in which a large portion of the genome is made up of a small number of high‐abundance repeat families (Wicker et al., 2009; Notes S1). Results obtained by applying our approach to the analysis of data from barley agree with previous results in revealing a large fraction of the genome to be comprised of a small number of high‐abundance repeats, with the top 10 repeat families accounting for 30.33% of the genome compared with 35.38% in the analysis of Wicker et al. (2009). Although our approach to de novo repeat family identification and quantification might result in some additional families being recognized, with consequently lower abundance for individual families (Notes S1), it is clear that any difference in stringency between the methods we have used and those that have been applied elsewhere does not change the overall picture of repeat diversity in the species analysed. Consequently, the contrasting genomic composition of F. affinis and F. imperialis compared with that of other species with smaller genomes cannot be attributed simply to differences in the specific methods for characterizing repeats.
Very large genomes show evidence for low deletion and turnover of DNA
The heterogeneous repeat content in Fritillaria could have arisen via distinct pathways. First, global amplification of repetitive DNA and high genome turnover could result in many repeat families amplifying simultaneously but remaining relatively small in size because of rapid deletion of amplified copies. Second, simultaneous amplification of a number of different repeat families accompanied by low rates of deletion could lead amplified copies to accumulate, creating an increasing fraction of repeat‐derived DNA that degenerates and diverges over time. To distinguish between these scenarios, we examined the level of intrafamily heterogeneity for repeats in Fritillaria (Notes S2). This reveals that most repeat families are not made up of homogeneous copies that show evidence for recent amplification but are instead dominated by copies with relatively low similarity to each other (Fig. 3), which is consistent with a scenario of ongoing amplification and accumulation of repetitive DNA as a result of low rates of deletion.
Figure 3.
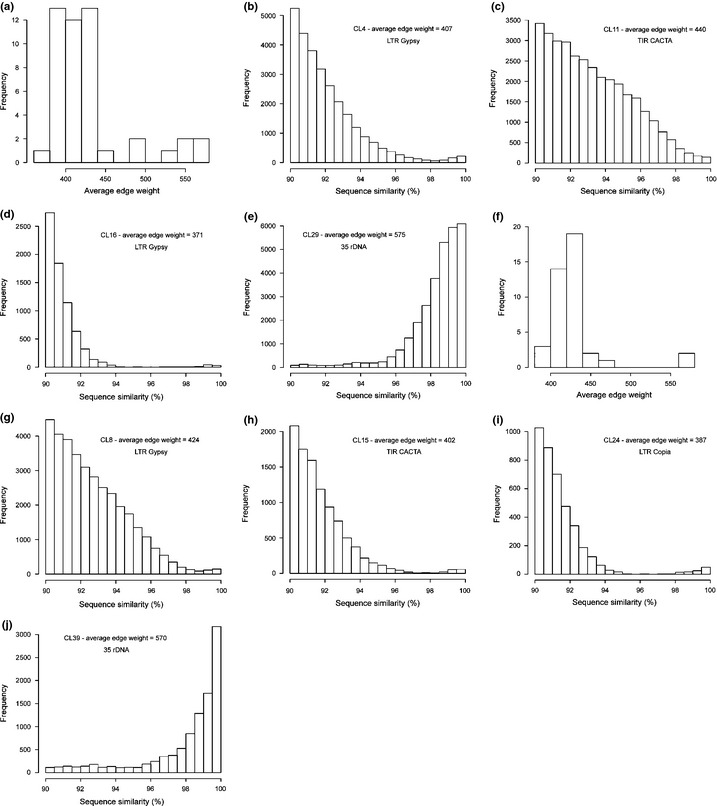
Intrafamily heterogeneity of repeats in Fritillaria. (a) Histogram of average edge weights from graphs of all top repeat families from Fritillaria affinis (n = 47). (b–e) Histograms of percentage sequence similarity for read pairs from selected repeat families representing a range of different edge weights from F. affinis, illustrating that repeat families with average edge weights of < 450, which comprise the vast majority of the top families, show an absence of peaks of very high similarity read pairs (i.e. ≥ 98% sequence similarity). (f) Histogram of average edge weights from graphs of all top repeat families from F. imperialis (n = 41). (g–j) Histograms of percentage sequence similarity for read pairs from selected repeat families representing a range of different edge weights from F. imperialis, showing a similar pattern to that described above for F. affinis. Cluster names and repeat types follow those listed in Supporting Information Tables S5 and S6; see Notes S2 for further explanation.
To investigate whether other plant species also show evidence for accumulation of heterogeneous repeat‐derived DNA, we used data on the proportion of the genome comprised of single‐ or low‐copy DNA (the S/L fraction) from classical DNA reassociation studies (see the Materials and Methods section; Table S7). We find that the size of the S/L fraction is significantly positively correlated with both 1C (Kendall's tau‐b 0.784; P < 2.22−16) and 1Cx genome size (0.816; P < 2.22−16; Fig. S2). This relationship is also detected when analysing separately data for individual plant families (Fig. S2). Estimated sizes of the S/L fraction per monoploid genome range c. 70×, from 91 Mb in Stellaria media (Carophyllaceae) to 6338 Mb in Anemone blanda (Ranunculaceae; Table S7). Findings from other studies demonstrate that repeat‐derived DNA contributes to the large S/L fraction in some species and that the relationship between genome size and amount of S/L DNA cannot be explained by increases in the number of protein‐coding gene sequences (see the Discussion section).
Discussion
By examining the repetitive DNA content of Fritillaria species, which have some of the largest recorded genomes in plants, we have shown that the huge size of these genomes is not determined by the activity of few high‐copy‐number TE families, as suggested to be the case in species with smaller genomes (Wicker et al., 2009). If species with small and large genomes differ only in their propensity for DNA amplification, with similar DNA deletion efficiency, we would expect the majority of large genomes to be made up of repetitive DNA with evidence of recent amplification, with a dearth of older, more divergent, elements. Instead, the pattern in Fritillaria is consistent with the accumulation and degeneration of repeat copies as a result of the failure to remove DNA as it is amplified. The approach we used for de novo repetitive element identification may have resulted in a slightly higher number of repeat families being inferred than would have been the case with methods used in earlier studies (see the Results section). However, the scale of the difference is not sufficient to explain the contrast between the results we obtained in Fritillaria, where dozens of repeat families are required to have amplified in order to explain recent genome size expansion, and the scenario proposed previously whereby very large genomes derive from massive amplification of a small number of repeat families (reviewed by Bennetzen & Wang, 2014).
Few studies have examined repetitive DNA composition in species with genomes exceeding 20 Gb (Kovach et al., 2010; Metcalf et al., 2012; Sun et al., 2012b), but those that have indicate the pattern of repeat diversity uncovered in Fritillaria may be a general characteristic of very large genomes. Only 40.2% of the c. 50‐Gb Australian lungfish (Neoceratodus forsteri) genome can be assigned to recognizable repetitive DNA (Metcalf et al., 2012). The black salamander (Aneides flavipunctatus) has a genome size of c. 44 Gb, < 50% of which can be assigned to known TEs (Sun et al., 2012b). The majority of the c. 22‐Gb genome of loblolly pine (Pinus taeda) is comprised of highly divergent, relatively low‐abundance, repetitive DNA (Kovach et al., 2010; Wegrzyn et al., 2014). In addition, the draft sequence of the Norway spruce genome (Picea abies), which is just below 20 Gb, reveals a similar picture (Nystedt et al., 2013). Although it has been suggested that the diversity of repeats in Pinus and Picea may be a specific characteristic of conifers (Kovach et al., 2010; Nystedt et al., 2013), our results demonstrate that the presence of highly heterogeneous repetitive DNA is a more widespread feature of very large genomes, a property that has also been noted recently by Metcalfe & Casane (2013).
Further support for this assertion comes from the observation that, in plants (angiosperms and gymnosperms), the amounts of both highly repeated and low‐copy DNA increase with escalating genome size (Elsik & Williams, 2000), with the amount of S/L DNA ranging from 91 Mb in Stellaria media (Carophyllaceae) to 6338 Mb in Anemone blanda (Table S7). Moreover, as these estimates encompass relatively few species, the actual range in S/L fraction size may be much greater. For example, the entire genome of Genlisea aurea is estimated to be c. 64 Mb (Greilhuber et al., 2006), which is smaller than the S/L fraction alone in Stellaria media. Repetitive sequences with 10 or more copies make up c. 3 Mb of the G. aurea genome assembly (Leushkin et al., 2013; a further 2.6 Mb of the assembly matches known repetitive elements, but the level of repetitiveness was not reported). Therefore, even if the remaining c. 61 Mb of the G. aurea genome is comprised solely of S/L DNA, there is a > 100‐fold difference between plant species in the amount of S/L DNA. Genome‐scale analyses have revealed the presence of multiple ancient whole‐genome duplications (WGDs) within seed plants (Jiao et al., 2011). Recent WGDs are accounted for when calculating the size of the S/L fraction per monoploid genome (see the Materials and Methods section; Table S7) and therefore do not inflate estimates of the size of this portion of the genome. However, ancient WGDs may not be apparent from chromosome numbers in extant species (Simillion et al., 2002) and, despite subsequent wide‐scale gene loss (e.g. The Brassica rapa Genome Sequencing Project Consortium, 2011), may contribute to increases in S/L fraction size through the retention and divergence of duplicate gene copies. Certain lineages have undergone multiple ancient WGD events; the most extensive series of duplications known are those in Brassica and Gossypium, both of which have undergone an up to 36‐fold duplication of the genes that would have been present in the MRCA of angiosperms (The Brassica rapa Genome Sequencing Project Consortium, 2011; Paterson et al., 2012). However, this still does not approach the > 100‐fold level of duplication that would be required if ancient WGDs alone were to account for variation in S/L fraction size. Furthermore, based on current understanding of the phylogenetic distribution of ancient WGDs among angiosperms (Vanneste et al., 2014), the largest S/L fractions are not found in lineages with the most ancient WGDs. For example, despite multiple WGDs in the Brassica lineage (The Brassica rapa Genome Sequencing Project Consortium, 2011), Brassica rapa subsp. pekinensis has a S/L fraction size of 368 Mb (Table S7), which is < 6% of the size of the S/L fraction in A. blanda. Findings such as these, added to the fact that DNA showing similarity to known TEs can be detected within the S/L sequences (Elsik & Williams, 2000; Whitelaw et al., 2003), suggest that it is the accumulation of repeat‐derived DNA that is primarily responsible for the large size of the S/L fraction in some species. The occurrence of escalating amounts of low‐similarity DNA with growth in overall genome size supports the conclusion that in species with large genomes repetitive DNA is retained, creating an increasing repeat‐derived fraction that decays over time to the point where its component sequences are highly divergent.
Conclusions
Our results from Fritillaria demonstrate that extreme cases of genomic expansion can take place via the accumulation of highly heterogeneous, relatively low‐abundance, repeat‐derived DNA and indicate that a lack of deletion and low turnover of repetitive DNA play major roles in genome size evolution. These findings will have important consequences for understanding the content and evolution of plant genomes. Very large genomes may clearly still contain highly amplified repeat families that individually have a substantial impact on genome size, such as is shown here with the high‐abundance tandem repeat in F. affinis (Fig. 2). However, the overall picture we have revealed, both from analysis of genomic Fritillaria data and from S/L data from diverse plant species, is not one of genomes growing principally by the activity of a few repeat families as had previously been suggested. Whether very large plant genomes (> 20 Gb) exist where significant genome expansion results solely from the amplification of one or two repeat families remains to be seen. Irrespective of this, our results, as well as those from some gymnosperm and animal species, indicate that such a mode of evolution is not a general feature of extreme genome size expansions. The universality of the patterns we have revealed awaits testing with data from further species with giant genomes, such as those found in the Melanthiaceae (Pellicer et al., 2014) or Viscum (Zonneveld, 2010).
Repetitive DNA can be removed from the genome via homologous and illegitimate recombination (Fedoroff, 2012); the importance of recombination‐based processes in DNA removal is suggested by the greater estimated rate of DNA deletion in genomic regions with high recombination rates compared with those undergoing less recombination (Nam & Ellegren, 2012). A recent theory presented by Fedoroff (2012) provides a plausible mechanism by which recombination frequency, and hence DNA removal rate, might be constrained. Most repetitive elements in plant genomes are highly methylated and contained within recombinationally inert heterochromatin (Fedoroff, 2012; Henderson, 2012). It is proposed that epigenetic mechanisms, which control the formation of heterochromatin, evolved to prevent deleterious effects of unconstrained recombination (Fedoroff, 2012); if unsuppressed, the presence of multiple TE copies would be expected to stimulate large numbers of ectopic recombination events (Bennetzen & Wang, 2014). Consequently, efficient epigenetic regulation of repetitive elements may actually prevent their removal, as they become locked into tracts of the genome that cannot be accessed by the recombination machinery (Fedoroff, 2012). If this theory holds true, plant species with large genomes may accumulate more repetitive DNA because of the rapid action of epigenetic mechanisms subsequent to amplification, whereas epigenetic silencing is predicted to reach completion more slowly in species with smaller genomes, providing a window of opportunity for removal of repetitive DNA via recombination before heterochromatinization is achieved. This argument runs counter to the suggestion that epigenetic silencing of repetitive DNA may be less effective in species with large genomes, thus allowing TEs to proliferate more easily (Kelly & Leitch, 2011). Although epigenetic mechanisms involved in regulating activity of repetitive elements have been examined in limited taxa, there is evidence that they may be less efficient in the larger genome of Arabidopsis lyrata (1C = 245 Mb; Lysak et al., 2009) than in the smaller genome of A. thaliana (Hollister et al., 2011). However, initial evidence on the function of epigenetic mechanisms in F. imperialis indicates that this species shows all the signatures that are usually associated with strict epigenetic regulation of repetitive DNA in small genomes (Becher et al., 2014). Nevertheless, irrespective of whether greater efficiency of epigenetic control has a role in stimulating genome size expansion, our results provide clear evidence that a key factor in the evolution of very large genomes is a lack of DNA removal leading to ongoing accumulation and low turnover of repetitive and repeat‐derived sequences.
Supporting information
Please note: Wiley Blackwell are not responsible for the content or functionality of any supporting information supplied by the authors. Any queries (other than missing material) should be directed to the New Phytologist Central Office.
Fig. S1 Phylogenetic relationships between Fritillaria species.
Fig. S2 Relationship between single/low‐copy sequence fraction size and genome size.
Table S1 Monoploid genome sizes used in ancestral state reconstruction
Table S2 Plant material used for sequencing and genome size estimation
Table S3 Newly generated 1C values
Table S4 Summary of 454 sequence data obtained for each species
Table S5 Top repeat families from Fritillaria affinis
Table S6 Top repeat families from Fritillaria imperialis
Table S7 Single/low‐copy fraction size and genome size
Notes S1 Potential impact of sequence similarity thresholds on repeat diversity patterns.
Notes S2 Analysis of intrafamily heterogeneity of repeats in Fritillaria.
Acknowledgements
We thank Laurence Hill, Jeremy Broome, Richard Kernick, and Kit Strange for cultivating plant material, Andrew Meade for bayestraits advice, Laura Martínez‐Suz for statistical advice, Yasmin Milner for generating some Sanger sequences, James Leebens‐Mack for the Lilium superbum plastid genome prepublication, Mark Chase for comments and three anonymous reviewers for comments on an earlier version of this manuscript. This paper includes 454 data generated by the Centre of Genomic Research, which is based at the University of Liverpool. This work was supported by the Natural Environment Research Council (grant no. NE/G01724/1), the Czech Science Foundation (grant no. P501/12/G090), the AVCR (grant no. RVO:60077344) and a Beatriu de Pinós postdoctoral fellowship to J.P. (grant no. 2011‐A‐00292; Catalan Government‐E.U. 7th F.P.).
References
- Altschul SF, Madden TL, Schaffer AA, Zhang J, Zhang Z, Miller W, Lipman DJ. 1997. Gapped BLAST and PSI‐BLAST: a new generation of protein database search programs. Nucleic Acids Research 25: 3389–3402. [DOI] [PMC free article] [PubMed] [Google Scholar]
- Ambrožová K, Mandáková T, Bureš P, Neumann P, Leitch IJ, Koblížková A, Macas J, Lysak MA. 2011. Diverse retrotransposon families and an AT‐rich satellite DNA revealed in giant genomes of Fritillaria lilies. Annals of Botany 107: 255–268. [DOI] [PMC free article] [PubMed] [Google Scholar]
- Becher H, Ma L, Kelly LJ, Kovarik A, Leitch IJ, Leitch AR. 2014. Endogenous pararetrovirus sequences associated with 24 nt small RNAs at the centromeres of Fritillaria imperialis L. (Liliaceae), a species with a giant genome. Plant Journal 80: 823–833. [DOI] [PubMed] [Google Scholar]
- Bennett MD, Leitch IJ. 2012. Plant DNA C‐values database (release 6.0, Dec. 2012). [WWW document] URL http://data.kew.org/cvalues/. [accessed 14 October 2014].
- Bennett MD, Leitch IJ, Price HJ, Johnston JS. 2003. Comparisons with Caenorhabditis (~100 Mb) and Drosophila (~175 Mb) using flow cytometry show genome size in Arabidopsis to be ~157 Mb and thus ~25% larger than the Arabidopsis Genome Initiative estimate of ~125 Mb. Annals of Botany 91: 547–557. [DOI] [PMC free article] [PubMed] [Google Scholar]
- Bennetzen JL, Wang H. 2014. The contributions of transposable elements to the structure, function and evolution of plant genomes. Annual Review of Plant Biology 65: 505–530. [DOI] [PubMed] [Google Scholar]
- Bensasson D, Petrov DA, Zhang D, Hartl DL, Hewitt GM. 2001. Genomic gigantism: DNA loss is slow in mountain grasshoppers. Molecular Biology and Evolution 18: 246–253. [DOI] [PubMed] [Google Scholar]
- Benson G. 1999. Tandem repeats finder: a program to analyze DNA sequences. Nucleic Acids Research 27: 573–580. [DOI] [PMC free article] [PubMed] [Google Scholar]
- Blass E, Bell M, Boissinot S. 2012. Accumulation and rapid decay of non‐LTR retrotransposons in the genome of the three‐spine stickleback. Genome Biology and Evolution 4: 687–702. [DOI] [PMC free article] [PubMed] [Google Scholar]
- Camacho C, Coulouris G, Avagyan V, Ma N, Papadopoulos J, Bealer K, Madden TL. 2009. BLAST+: architecture and applications. BMC Bioinformatics 10: 421. [DOI] [PMC free article] [PubMed] [Google Scholar]
- D'Hont A, Denoeud F, Aury J‐M, Baurens F‐C, Carreel F, Garsmeur O, Noel B, Bocs S, Droc G, Rouard M et al 2012. The banana (Musa acuminata) genome and the evolution of monocotyledonous plants. Nature 488: 213–217. [DOI] [PubMed] [Google Scholar]
- Day PD, Berger M, Hill L, Fay MF, Leitch AR, Leitch IJ, Kelly LJ. 2014. Evolutionary relationships in the medicinally important genus Fritillaria L. (Liliaceae). Molecular Phylogenetics and Evolution 80: 11–19. [DOI] [PubMed] [Google Scholar]
- Doležel J, Greilhuber J, Lucretti S, Meister A, Lysak MA, Nardi L, Obermayer R. 1998. Plant genome size estimation by flow cytometry: inter‐laboratory comparison. Annals of Botany 82: 17–26. [Google Scholar]
- Doyle JJ, Doyle JL. 1987. A rapid DNA isolation procedure for small quantities of fresh leaf tissue. Phytochemical Bulletin 19: 11–15. [Google Scholar]
- Elbaidouri M, Panaud O. 2013. Comparative genomic paleontology across plant kingdom reveals the dynamics of TE‐driven genome evolution. Genome Biology and Evolution 5: 954–965. [DOI] [PMC free article] [PubMed] [Google Scholar]
- Elsik CG, Williams CG. 2000. Retroelements contribute to the excess low‐copy number DNA in pine. Molecular and General Genetics 264: 47–55. [DOI] [PubMed] [Google Scholar]
- Fedoroff NV. 2012. Transposable elements, epigenetics, and genome evolution. Science 338: 758–767. [DOI] [PubMed] [Google Scholar]
- Givnish TJ, Ames M, McNeal JR, McKain MR, Steele PR, dePamphilis CW, Graham SW, Pires JC, Stevenson DW, Zomlefer WB et al 2010. Assembling the tree of the monocotyledons: plastome sequence phylogeny and evolution of Poales. Annals of the Missouri Botanical Garden 97: 584–616. [Google Scholar]
- Gomez‐Alvarez V, Teal TK, Schmidt TM. 2009. Systematic artifacts in metagenomes from complex microbial communities. ISME Journal 3: 1314–1317. [DOI] [PubMed] [Google Scholar]
- Greilhuber J, Borsch T, Müller K, Worberg A, Porembski S, Barthlott W. 2006. Smallest angiosperm genomes found in Lentibulariaceae with chromosomes of bacterial size. Plant Biology 8: 770–777. [DOI] [PubMed] [Google Scholar]
- Greilhuber J, Doležel J, Lysak MA, Bennett MD. 2005. The origin, evolution and proposed stabilization of the terms ‘Genome Size’ and ‘C‐Value’ to describe nuclear DNA contents. Annals of Botany 95: 91–98. [DOI] [PMC free article] [PubMed] [Google Scholar]
- Grover CE, Wendel JF. 2010. Recent insights into mechanisms of genome size change in plants. Journal of Botany 2010: article ID 382732. [Google Scholar]
- Hawkins JS, Kim HR, Nason JD, Wing RA, Wendel JF. 2006. Differential lineage‐specific amplification of transposable elements is responsible for genome size variation in Gossypium . Genome Research 16: 1252–1261. [DOI] [PMC free article] [PubMed] [Google Scholar]
- Hawkins JS, Proulx SR, Rapp RA, Wendel JF. 2009. Rapid DNA loss as a counterbalance to genome expansion through retrotransposon proliferation in plants. Proceedings of the National Academy of Sciences, USA 106: 17811–17816. [DOI] [PMC free article] [PubMed] [Google Scholar]
- Henderson IR. 2012. Control of meiotic recombination frequency in plant genomes. Current Opinion in Plant Biology 15: 556–561. [DOI] [PubMed] [Google Scholar]
- Hollister JD, Smith LM, Guo Y‐L, Ott F, Weigel D, Gaut BS. 2011. Transposable elements and small RNAs contribute to gene expression divergence between Arabidopsis thaliana and Arabidopsis lyrata . Proceedings of the National Academy of Sciences, USA 108: 2322–2327. [DOI] [PMC free article] [PubMed] [Google Scholar]
- Hu TT, Pattyn P, Bakker EG, Cao J, Cheng JF, Clark RM, Fahlgren N, Fawcett JA, Grimwood J, Gundlach H et al 2011. The Arabidopsis lyrata genome sequence and the basis of rapid genome size change. Nature Genetics 43: 476–481. [DOI] [PMC free article] [PubMed] [Google Scholar]
- International Rice Genome Sequencing Project . 2005. The map‐based sequence of the rice genome. Nature 436: 793–800. [DOI] [PubMed] [Google Scholar]
- Jiao Y, Wickett NJ, Ayyampalayam S, Chanderbali AS, Landherr L, Ralph PE, Tomsho LP, Hu Y, Liang H, Soltis PS et al 2011. Ancestral polyploidy in seed plants and angiosperms. Nature 473: 97–100. [DOI] [PubMed] [Google Scholar]
- Kelly LJ, Leitch AR, Clarkson JJ, Knapp S, Chase MW. 2013. Reconstructing the complex evolutionary origin of wild allotetraploid tobaccos (Nicotiana section Suaveolentes). Evolution 67: 80–94. [DOI] [PubMed] [Google Scholar]
- Kelly LJ, Leitch AR, Fay MF, Renny‐Byfield S, Pellicer J, Macas J, Leitch IJ. 2012. Why size really matters when sequencing plant genomes. Plant Ecology & Diversity 5: 415–425. [Google Scholar]
- Kelly LJ, Leitch IJ. 2011. Exploring giant plant genomes with next‐generation sequencing technology. Chromosome Research 19: 939–953. [DOI] [PubMed] [Google Scholar]
- Kovach A, Wegrzyn JL, Parra G, Holt C, Bruening GE, Loopstra CA, Hartigan J, Yandell M, Langley CH, Korf I et al 2010. The Pinus taeda genome is characterized by diverse and highly diverged repetitive sequences. BMC Genomics 11: 420. [DOI] [PMC free article] [PubMed] [Google Scholar]
- Leitch IJ, Beaulieu JM, Cheung K, Hanson L, Lysak MA, Fay MF. 2007. Punctuated genome size evolution in Liliaceae. Journal of Evolutionary Biology 20: 2296–2308. [DOI] [PubMed] [Google Scholar]
- Leushkin EV, Sutormin RA, Nabieva ER, Penin AA, Kondrashov AS, Logacheva MD. 2013. The miniature genome of a carnivorous plant Genlisea aurea contains a low number of genes and short non‐coding sequences. BMC Genomics 14: 476. [DOI] [PMC free article] [PubMed] [Google Scholar]
- Lysak MA, Koch MA, Beaulieu JM, Meister A, Leitch IJ. 2009. The dynamic ups and downs of genome size evolution in Brassicaceae. Molecular Biology and Evolution 26: 85–98. [DOI] [PubMed] [Google Scholar]
- Ma J, Devos KM, Bennetzen JL. 2004. Analyses of LTR‐retrotransposon structures reveal recent and rapid genomic DNA loss in rice. Genome Research 14: 860–869. [DOI] [PMC free article] [PubMed] [Google Scholar]
- Maddison DR, Maddison WP. 2002. MacClade 4: analysis of phylogeny and character evolution, Version 4.04. Sunderland, MA, USA: Sinauer Associates. [Google Scholar]
- Metcalfe CJ, Casane D. 2013. Accommodating the load: the transposable element content of very large genomes. Mobile Genetic Elements 3: e24775. [DOI] [PMC free article] [PubMed] [Google Scholar]
- Metcalf CJ, Filée J, Germon I, Joss J, Casane D. 2012. Evolution of the Australian lungfish (Neoceratodus forsteri) genome: a major role for CR1 and L2 LINE elements. Molecular Biology and Evolution 29: 3529–3539. [DOI] [PubMed] [Google Scholar]
- Nam K, Ellegren H. 2012. Recombination drives vertebrate genome contraction. PLoS Genetics 8: 1002680. [DOI] [PMC free article] [PubMed] [Google Scholar]
- Neumann P, Koblížková A, Navrátilová A, Macas J. 2006. Significant expansion of Vicia pannonica genome size mediated by amplification of a single type of giant retroelement. Genetics 173: 1047–1056. [DOI] [PMC free article] [PubMed] [Google Scholar]
- Niu B, Fu L, Sun S, Li W. 2010. Artificial and natural duplicates in pyrosequencing reads of metagenomic data. BMC Bioinformatics 11: 187. [DOI] [PMC free article] [PubMed] [Google Scholar]
- Novák P, Neumann P, Macas J. 2010. Graph‐based clustering and characterization of repetitive sequences in next‐generation sequencing data. BMC Bioinformatics 11: 378. [DOI] [PMC free article] [PubMed] [Google Scholar]
- Novák P, Neumann P, Pech J, Steinhaisl J, Macas J. 2013. RepeatExplorer: a Galaxy‐based web server for genome‐wide characterization of eukaryotic repetitive elements from next‐generation sequence reads. Bioinformatics 29: 792–793. [DOI] [PubMed] [Google Scholar]
- Nylander JAA. 2004. MrModeltest v2. Uppsala, Finland: Evolutionary Biology Centre, Uppsala University. [Google Scholar]
- Nystedt B, Street NR, Wetterbom A, Zuccolo A, Lin Y‐C, Scofield DG, Vezzi F, Delhomme N, Giacomello S, Alexeyenko A et al 2013. The Norway spruce genome sequence and conifer genome evolution. Nature 497: 579–584. [DOI] [PubMed] [Google Scholar]
- Pagel M. 1997. Inferring evolutionary processes from phylogenies. Zoologica Scripta 26: 331–348. [Google Scholar]
- Pagel M. 1999. Inferring the historical patterns of biological evolution. Nature 401: 877–884. [DOI] [PubMed] [Google Scholar]
- Paterson AH, Wendel JF, Gundlach H, Guo H, Jenkins J, Jin D, Llewellyn D, Showmaker KC, Shu S, Udall J et al 2012. Repeated polyploidization of Gossypium genomes and the evolution of spinnable cotton fibres. Nature 492: 423–427. [DOI] [PubMed] [Google Scholar]
- Pellicer J, Kelly LJ, Leitch IJ, Zomlefer WB, Fay MF. 2014. A universe of dwarfs and giants: genome size and chromosome evolution in the monocot family Melanthiaceae. New Phytologist 201: 1484–1497. [DOI] [PubMed] [Google Scholar]
- Piegu B, Guyot R, Picault N, Roulin A, Saniyal A, Kim H, Collura K, Brar DS, Jackson S, Wing RA et al 2006. Doubling genome size without polyploidization: dynamics of retrotransposition‐driven genomic expansions in Oryza australiensis, a wild relative of rice. Genome Research 16: 1262–1269. [DOI] [PMC free article] [PubMed] [Google Scholar]
- R Core Team . 2014. R: a language and environment for statistical computing. Vienna, Austria: R Foundation for Statistical Computing. [Google Scholar]
- Rambaut A, Drummond AJ. 2009. Tracer v1.5. [WWW document] URL http://tree.bio.ed.ac.uk/software/tracer. [accessed 14 October 2014].
- Rix EM. 2001. Fritillaria: a revised classification. Oxford, UK: The Fritillaria Group of the Alpine Garden Society. [Google Scholar]
- Ronquist F, Teslenko M, van der Mark P, Ayres DL, Darling A, Hohna S, Larget B, Liu L, Suchard MA, Huelsenbeck JP. 2012. MRBAYES 3.2: efficient Bayesian phylogenetic inference and model selection across a large model space. Systematic Biology 61: 539–542. [DOI] [PMC free article] [PubMed] [Google Scholar]
- Rønsted N, Law S, Thornton H, Fay MF, Chase MW. 2005. Molecular phylogenetic evidence for the monophyly of Fritillaria and Lilium (Liliaceae; Liliales) and the infrageneric classification of Fritillaria . Molecular Phylogenetics and Evolution 35: 509–527. [DOI] [PubMed] [Google Scholar]
- Simillion C, Vandepoele K, Van Montagu MCE, Zabeau M, Van de Peer Y. 2002. The hidden duplication past of Arabidopsis thaliana . Proceedings of the National Academy of Sciences, USA 99: 13627–13632. [DOI] [PMC free article] [PubMed] [Google Scholar]
- Sun C, López Arriaza JR, Mueller RL. 2012a. Slow DNA loss in the gigantic genomes of salamanders. Genome Biology and Evolution 4: 1340–1348. [DOI] [PMC free article] [PubMed] [Google Scholar]
- Sun C, Shepard DB, Chong RA, López Arriaza JR, Hall K, Castoe TA, Feschotte C, Pollock DD, Mueller RL. 2012b. LTR retrotransposons contribute to genomic gigantism in Plethodontid salamanders. Genome Biology and Evolution 4: 168–183. [DOI] [PMC free article] [PubMed] [Google Scholar]
- Swofford DL. 2003. PAUP*: phylogenetic analysis using parsimony (*and other methods), Version 4. Sunderland, MA, USA: Sinauer Associates. [Google Scholar]
- The Brassica rapa Genome Sequencing Project Consortium . 2011. The genome of the mesopolyploid crop species Brassica rapa . Nature Genetics 43: 1035–1039. [DOI] [PubMed] [Google Scholar]
- The International Brachypodium Initiative . 2010. Genome sequencing and analysis of the model grass Brachypodium distachyon . Nature 493: 763–768. [DOI] [PubMed] [Google Scholar]
- Thompson W. 1978. Perspectives on the evolution of plant DNA. Carnegie Institute of Washington Year Book 77: 310–316. [Google Scholar]
- Van't Hof J. 1965. Relationships between mitotic cycle duration S period duration and average rate of DNA synthesis in root meristem cells of several plants. Experimental Cell Research 39: 48–58. [DOI] [PubMed] [Google Scholar]
- Vanneste K, Baele G, Maere S, Van de Peer Y. 2014. Analysis of 41 plant genomes supports a wave of successful genome duplications in association with the Cretaceous‐Paleogene boundary. Genome Research 24: 1334–1347. [DOI] [PMC free article] [PubMed] [Google Scholar]
- Vitte C, Bennetzen JL. 2006. Analysis of retrotransposon structural diversity uncovers properties and propensities in angiosperm genome evolution. Proceedings of the National Academy of Sciences, USA 103: 17638–17643. [DOI] [PMC free article] [PubMed] [Google Scholar]
- Wang H, Liu J‐S. 2008. LTR retrotransposon landscape in Medicago truncatula: more rapid removal than in rice. BMC Genomics 9: 382. [DOI] [PMC free article] [PubMed] [Google Scholar]
- Wegrzyn JL, Liechty JD, Stevens KA, Wu L‐S, Loopstra CA, Vasquez‐Gross HA, Dougherty WM, Lin BY, Zieve JJ, Martínez‐García PJ et al 2014. Unique features of the loblolly pine (Pinus taeda L.) megagenome revealed through sequence annotation. Genetics 196: 891–909. [DOI] [PMC free article] [PubMed] [Google Scholar]
- Wenzel W, Hemleben V. 1982. A comparative study of genomes in angiosperms. Plant Systematics and Evolution 139: 209–227. [Google Scholar]
- Whitelaw CA, Barbazuk WB, Pertea G, Chan AP, Cheung F, Lee Y, Zheng L, van Heeringen S, Karamycheva S, Bennetzen JL et al 2003. Enrichment of gene‐coding sequences in maize by genome filtration. Science 302: 2118–2120. [DOI] [PubMed] [Google Scholar]
- Wicker T, Keller B. 2007. Genome‐wide comparative analysis of copia retrotransposons in Triticeae, rice, and Arabidopsis reveals conserved ancient evolutionary lineages and distinct dynamics of individual copia families. Genome Research 17: 1072–1081. [DOI] [PMC free article] [PubMed] [Google Scholar]
- Wicker T, Taudien S, Houben A, Keller B, Graner A, Platzer M, Stein N. 2009. A whole‐genome snapshot of 454 sequences exposes the composition of the barley genome and provides evidence for parallel evolution of genome size in wheat and barley. Plant Journal 59: 712–722. [DOI] [PubMed] [Google Scholar]
- Zonneveld B. 2010. New record holders for maximum genome size in eudicots and monocots. Journal of Botany 2010: article ID 527357. [Google Scholar]
Associated Data
This section collects any data citations, data availability statements, or supplementary materials included in this article.
Supplementary Materials
Please note: Wiley Blackwell are not responsible for the content or functionality of any supporting information supplied by the authors. Any queries (other than missing material) should be directed to the New Phytologist Central Office.
Fig. S1 Phylogenetic relationships between Fritillaria species.
Fig. S2 Relationship between single/low‐copy sequence fraction size and genome size.
Table S1 Monoploid genome sizes used in ancestral state reconstruction
Table S2 Plant material used for sequencing and genome size estimation
Table S3 Newly generated 1C values
Table S4 Summary of 454 sequence data obtained for each species
Table S5 Top repeat families from Fritillaria affinis
Table S6 Top repeat families from Fritillaria imperialis
Table S7 Single/low‐copy fraction size and genome size
Notes S1 Potential impact of sequence similarity thresholds on repeat diversity patterns.
Notes S2 Analysis of intrafamily heterogeneity of repeats in Fritillaria.