

Abstract
Cellular transformation is initiated by the activation of oncogenes and a closely associated developmental reprogramming of the epigenetic landscape. Transcription factors, regulators of chromatin states and microRNAs influence cell fates in development and stabilize the phenotypes of normal, differentiated cells and of cancer cells. The miR‐302/367 cluster, predominantly expressed in human embryonic stem cells (hESs), can promote the cellular reprogramming of human and mouse cells and contribute to the generation of iPSC. We have used the epigenetic reprogramming potential of the miR‐302/367 cluster to “de‐program” tumor cells, that is, hift their gene expression pattern towards an alternative program associated with more benign cellular phenotypes. Induction of the miR‐302/367 cluster in extensively mutated U87MG glioblastoma cells drastically suppressed the expression of transformation related proteins, for example, the reprogramming factors OCT3/4, SOX2, KLF4 and c‐MYC, and the transcription factors POU3F2, SALL2 and OLIG2, required for the maintenance of glioblastoma stem‐like tumor propagating cells. It also diminished PI3K/AKT and STAT3 signaling, impeded colony formation in soft agar and cell migration and suppressed pro‐inflammatory cytokine secretion. At the same time, the miR‐302/367 cluster restored the expression of neuronal markers of differentiation. Most notably, miR‐302/367 cluster expressing cells lose their ability to form tumors and to establish liver metastasis in nude mice. The induction of the miR‐302/367 cluster in U87MG glioblastoma cells suppresses the expression of multiple transformation related genes, abolishes the tumor and metastasis formation potential of these cells and can potentially become a new approach for cancer therapy.
Keywords: tumor suppression, miR‐302/367 regulated gene expression, epigenetic regulation of the tumor cell state
Short abstract
What's new?
The transformation of normal cells into malignant cells shares many similarities with the reprogramming of somatic cells into pluripotent cells, raising the possibility that reprogramming factors may be used to counteract cellular transformation. This study demonstrates that reversion of transformation and normalization of cellular properties can be achieved in highly‐aberrant glioblastoma cells through the expression of the miR‐302/367 cluster. miR‐302/367 drastically changes the gene expression pattern and abolishes transformation‐related phenotypes in a coordinated fashion. miR‐302/367 prevents tumor and metastasis formation and restores features of neuronal differentiation. Such “deprogramming” of tumor cells could potentially become a new concept for cancer therapy.
Somatic mutations detected in cancer cells have greatly contributed to the understanding of the disease. Distinct mutational signatures could be associated with individual cancer indications and stages of development. They affect 12 signaling pathways and regulate cell fate, cell survival and genome maintenance.1 These insights have been exploited for the improvement of diagnosis and therapy.2
Targeted drugs which inhibit transformation associated signaling components and molecular pathways have shown beneficial effects in many patients. The choice of drug is based upon the identification of a suited target molecule, usually a mutated version of a “driver gene” product.3 Although patients often favorably respond to targeted therapies, the beneficial effects are not necessarily persistent and drug resistant tumor cells frequently emerge during prolonged treatment.4, 5 For this reason, alternatives to therapies targeting single molecules, based on the manipulation of entire tumor cell gene expression programs, are being considered.6
The determination of cellular fates is a dynamic process which specifies self‐renewal and the differentiation of cellular functions. It is governed by transcription factors which recognize proximal promoter regions of target genes, distal enhancer elements and act in a combinatorial and cell type specific fashion.7 Transcriptional activation is also determined by the epigenetic state of the cellular chromatin, composed of complexes of structured DNA, RNA, histones and regulatory proteins.8 governing the accessibility of promoters and enhancers and cell type specific chromatin configurations. Nuclear architectures reflect the cellular phenotypes and developmental specifications are accompanied by progressive chromatin restrictions.9 Oncogenic transformation is also accompanied by specific epigenomic characteristics. Transcription factors and chromatin modifying enzymes cooperate in the acquisition of the transformation specific epigenetic state.10
Differentiated, somatic cells can be reprogrammed and reconverted to pluripotency. Reprogramming is accompanied by distinct changes in chromatin and alterations in transcriptional programs.11 Reprogramming and cellular transformation share global changes in chromatin structure and DNA methylation and cancer cells might have reverted to a developmentally more primitive epigenetic state.7, 11 The expression of reprogramming factors in vivo provided a link to the transformation process. Partial reprogramming of cells in vivo caused epigenetic alterations sufficient to trigger the development of kidney tumors and teratomas.12, 13
The similarities between reprogramming of somatic cells to pluripotency and transformation of normal cells to malignant cells, have interesting practical implications. Reprogramming and transformation can be affected by the expression of the transcription factors OCT4, KLF4, SOX2 and c‐MYC or by the expression of the miR‐302/367 cluster.14 The reprogramming agents erase epigenetic restrictions of particular differentiation states and stabilize new ones. These properties have been mainly exploited to derive stable, induced pluripotent cells with the potential to produce normal downstream lineages.15
There are reports, however, which indicate that it is possible to reprogram tumor cells and relieve the transformed state. Somatic cell hybridization and chromosome transfer studies indicated early on, that it is possible to suppress the tumorigenic phenotype of cancer cells through imposed changes in their gene expression patterns.16 Retinoids have widely been used to induce the differentiation of acute promyelocytic leukemia (APML) cells and have increased survival intervals of patients.17 Reactivation of blocked terminal differentiation programs could also be achieved in solid tumors through histone deacetylase inhibitors (HDACI), PPAR‐γ agonists and histone lysine demethylases.18, 19
Only a few attempts have been made to use reprogramming factors to counteract cellular transformation. Induced cancer stem‐like cells resulted from the introduction of OCT4, NANOG, SOX2, LIN28, KLF4 and c‐MYC expression vectors20 into human lung fetal fibroblasts. This discouraged the use of reprogramming agents as cancer therapeutics. However, in osteosarcoma cells, the expression of the four reprogramming factors resulted in a loss of tumorigenicity and restored features of terminal differentiation.21
The potential tumorigenicity of cells expressing the reprogramming factors is most likely due to the ectopic expression of the oncogenic factors c‐MYC and KLF4. For this reason, we have investigated the effects of the expression of the miR‐302/367 cluster. It can reprogram cells and yield iPSCs, similar to the reprogramming factors, but avoids the expression of oncogenic components. The miR‐302/367 cluster is composed of five miRNAs. miR‐302a‐d have the same seven base pair seed sequence and target specificity and suppresses the cyclin E‐CDK2 and cyclin D‐CDK4/6 cell cycle pathways during the G1‐S transition.22 It also promotes the expression of the tumor suppressor genes, p16Ink4a and p14/p19Arf and thus counteracts tumorigenicity in the reprogrammed cells.23
The expression of the miR‐302/367 cluster in U87MG glioblastoma cells drastically changed their gene expression program and their transformation related phenotypes. It reversed the features of epithelial to mesenchymal transition and suppressed the ability for colony formation in soft agar. The miR‐302/367 cluster expressing cells also lose their ability to form tumors upon transplantation into mice and to establish liver metastasis.
Material and Methods
Cell lines
The lentiviral producer cell line HEK‐293T and the human GBM cancer cell lines U87MG and U373 were purchased from the American Type Culture Collection (ATCC), the human foreskin fibroblast cell line BJ from Stemgent (Cambridge, MA). All cell lines were maintained in Dulbecco's modified Eagle's medium (DMEM; Invitrogen) including 10% fetal calf serum (FCS), penicillin/streptomycin (100 U/mL; 100 μg/mL), and 2 mM L‐glutamine and grown at 37°C, 5% CO2 and 98% humidity.
Colony formation
Anchorage independent growth of GBM cells was evaluated by the soft agar colony formation assay and the tumor sphere formation assay. For the soft agar colony formation assay, U87MG, U87‐pLVET and U87‐miR 302/367 cells were suspended in a 0.35% pure agarose matrix (Biozyme) containing DMEM with 10% FCS, penicillin/streptomycin and 2 mM L‐glutamine. They were plated at a density of 3 × 10³ cells per well in a six‐well dish on a presolidified 0.5% pure agarose matrix containing basal layer. Colony formation was measured by staining with 0.5% crystal violet and detected under a microscope after 3 weeks. Experiments were done in triplicate. Stained colonies were counted in five different areas per well, and quantified as averages.
Cell invasion assay
The cell invasion assay measures interactions between tumor cells and the extracellular matrix (ECM). Millicell Cell Culture Inserts (12 mm diameter, 8 μm pores) (Merk Millipore) were coated with ECM (Sigma‐Aldrich). The cells were plated at a density of 3 × 10³ cells per insert on ECM solidified matrix and inserted in a well of a 12‐well dish with 500 μl of DMEM medium. Noninvading cells were removed from the upper compartment of the insert after 16 hrs incubation. The invading cells, in the lower compartment of the insert, were stained with 1% crystal violet in 2% ethanol for 20 min and fixed with 3.7% paraformaldehyde for 10 min. The cells were washed two times with 1X PBS, and invading cells were quantitated. Experiments were performed in triplicates. Invading cells were counted in nine different areas per well, and quantified as average counting. To evaluate the effects of secreted soluble factors on the invasiveness of U87MG cells, cells were plated at a density of 3 × 10³ cells per well in a 12‐well dish. The ECM coated Millicell cell culture inserts were placed on the well, and U87MG cells were plated at a density of 3 × 10³ cells per insert in the well of a 12‐well dish in the presence of the manipulated cells.
Cytokine array analysis
Cytokines secreted by U87MG and U87‐miR 302/367 cluster cells were detected in cytokine arrays (RayBiotech). The procedure was performed according to manufacturer's protocol. 1 × 10⁶ cells were plated on 100 mm dishes in DMEM medium. The next day, the DMEM medium was discarded, cells were washed two times with PBS and cultured for 2 days in serum free DMEM medium. The medium containing the secreted cytokines was collected and briefly centrifuged. 1 ml of the supernatant was incubated with the human antibody array membranes at 4°C overnight, followed by membrane blocking. The membrane was incubated with biotin‐conjugated anti‐cytokines at room temperature for 2 hrs. Then 1:1,000 of diluted IRDYE 800CW streptavidin (LI‐COR Biosciences) was added followed by a washing step. Florescence signals on the membranes were detected and scanned by Odyssey Infrared Imaging System. The experiments were carried out in duplicate, and the Odyssey software was used to analyze the pixel density of each cytokine. Each of the cytokine pixel densities was normalized to positive and negative pixel densities.
In vivo tumorigenecity
To assess the effects of the miR‐302/367 cluster expression on the potential of U87MG cells to form tumors and metastasis, the cells were injected into the right hind flank of NSG (NOD SCID, IL‐2 receptor gamma chain knockout mice) mice. 5 × 10⁶ U87MG, U87‐pLVET and U87‐miR 302/367 cells were injected with 20% growth factor reduced MatrigelTM (BD, Cat #354230, Lot #3010866) per NSG mice. The tumor volumes were measured on the indicated days with a vernier caliper (Fig. 5b). The volume was calculated with the ellipsoid formula: pie/6 × (length × width2).
Figure 5.

The effects of miR‐302/367 cluster expression on U87MG tumor growth and liver metastasis formation in vivo. (a) 6‐ to 8‐ week‐old NSG male mice were injected s.c. in the flank with 5 × 10⁶ cells in 0.1 mL of PBS with 20% matrigel. Tumor formation in the mice at the site of injection was monitored for 30 days, the tumors were excised and photographed. (b) Starting at 1 week after injection of the cells, tumor volumes were measured as indicated. n = 7. (c) 30 days after implantation of the cells, the mice were sacrificed and liver metastasis were visualized macroscopically and by immunoperoxidase staining with a Ki‐67 specific antibody in tissue sections.
Statistical analyses
All experiments were repeated at least three times and the values in the figures are presented as means ± standard deviation (SD). Animal studies included seven animals per group. The statistical analyses were evaluated with two‐way analysis of variance (ANOVA) in which p < 0.05 was considered as significant. Post hoc multiple comparisons were followed by Bonferroni's test.
Results
U87MG glioblastoma cells endogenously express reprogramming factors and stem cell markers.
We have carried out most of our experiments with a well characterized tumor model derived from a glioblastoma multiforme (GBM) patient.24 GBM is a frequently occurring tumor of the central nervous system and often resistant toward conventional therapies.25 U87MG cells have been derived from a human grade IV glioma and have been widely used in experimental studies. Its genome has been fully sequenced26 and revealed multiple severe aberrations, including intrachromosomal translocation events, large structural variations of [mt]100 nucleotides in length, small insertions and deletions and a high number of single nucleotide variations. Many of its genes are homozygously mutated, among them many cell adhesion molecules and the PTEN gene, a crucial regulator of PI3K/AKT activity. The cells efficiently forms tumors at the site of injection and metastasis in the liver of nude mice.
We have further characterized the U87MG cell line with respect to the gene expression patterns of glioblastoma stem‐like cells (GSC) and differentiated glioblastoma cells (DGC). The results of these comparisons, based on bioinformatic analyses, are shown in Figures 1 a and 1 b. The heatmap and the hierarchical cluster show that U87MG cells lack the expression of a set of genes characteristic for the fully differentiated state, but share the expression of multiple genes with GSCs (Figs. 1 a and 1 b).
Figure 1.
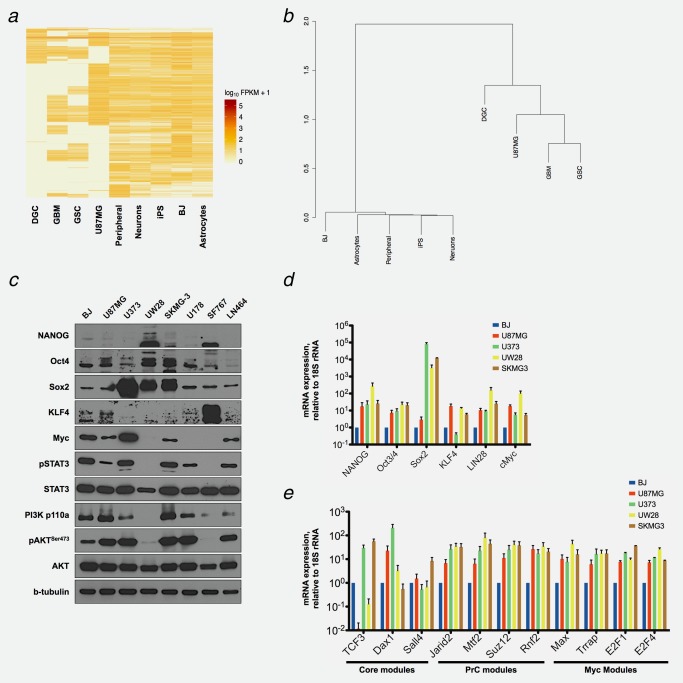
Comparison of the global gene expression patterns in a normal human cell line, normal tissues and GBM tumors and expression of the reprogramming factors NANOG, OCT4, SOX2, KLF4, c‐MYC, and the activation of STAT3, PI3K and AKT in GBM cell lines. (a). Heatmaps of significantly expressed genes in U87MG cells, human iPS cells, normal and GBM tissues were derived from RNA‐seq data obtained from the National Center for Biotechnology Information Gene Expression Omnibus. A list of all RNA‐seq data sets are provided in the Supporting Information Table S7. DGC: differentiated glioblastoma cells from GBM patient tissue; GSC: isolated glioblastoma stem‐like cells from GBM patient tissue; GBM: glioblastoma patient tissue; U87MG: glioblastoma cell line; Peripheral: normal peripheral brain tissue; Neurons: neurons derived from human iPS cells; iPS: human, induced pluripotent stem cells; BJ: human foreskin cells; Astrocytes: astrocytes cells islated from normal fetal cortex. (b) Hierarchical clustering was performed upon normalization and a comparison of the RNA‐seq data sets. The dendrogram was depicted using the binary data clustering method. (c) Western blot analyses were carried out with protein lysates obtained from BJ cells, normal human foreskin fibroblasts, and from the glioblastoma cell lines U87MG, U373, UW28, SKMG‐3, U178, SF767 and LN464. The indicated proteins were visualized with specific antibodies described in the materials section. b‐tubulin was used as the loading control for the gels. (d) mRNA expression levels of the reprogramming factors in GBM cells were determined by RT‐qPCR. (e) mRNA expression levels of the CPM (Core, PrC and Myc) modules in GBM cells were determined by RT‐qPCR. The RT‐qPCR data were standardized to 18S rRNA, and compared to the values obtained in BJ cells. n = 3.
We also measured the endogenous expression of reprogramming factors in U87MG cells and related glioblastoma cell lines. Embryonic stem cell marker expression has been previously found to be associated with tumor grade and unfavorable prognosis.27, 28 We determined the expression of reprogramming factors and of stem cell genetic programs in seven GBM cell lines by Western blotting (Fig. 1 c) and RT‐qPCR (Figs. 1 d and 1 e). Since there is no normal human cell match for U87MG cells, the human foreskin cell line (BJ) served as a control. Unexpectedly, the expression the global gene expression pattern and that of neuronal cell markers in the BJ cells was found to resemble that of normal astrocytes, neurons and peripheral tissue (Figs. 1 a and 1 b, Supporting Information Fig. S3).
We detected increased expression of the reprogramming factors and the activation of stem cell genetic programs in four of GBM cell lines when we compared them to BJ cells. The upregulation of individual factors varied in different GBM cell lines. SOX2 and OCT4 were expressed in all cell lines. NANOG, KLF4 and c‐MYC expression was more variable. Similar results were obtained in the analyses of tumor tissues.28 We suggest that GBM cells are most likely partially de‐differentiated through the endogenous expression of a subset of the reprogramming factors. The antibodies specific for SOX2 and c‐MYC detected single bands, as expected. The antibodies for NANOG and OCT4 also detected smaller, nonspecific bands. The upper bands correspond to the expected sizes of NANOG and OCT4.
The transcription factor STAT3 can assume the function of an oncogene, when its activation is deregulated in extent and duration.29 It regulates glioblastoma stem cell proliferation and self‐renewal.30 In somatic cell reprogramming, STAT3 enhances and promotes the reprogramming process.31 Similarly, PI3K/AKT signaling pathway deregulation can have oncogenic effects. U87MG cells exhibit PTEN loss‐of‐function mutations resulting in the activation of AKT signaling and the maintenance of stem cell pluripotency.32 We find that STAT3 and PI3K/AKT are activated in most GBM cell lines, except UW28 and SF767 cells (Fig. 1 c).
We also investigated the expression of stem cell markers in the glioblastoma cell lines.33 The CPM modules, consisting of the Core (Core pluripotency factors), the PrC (Polycomb repressive complex factors) and the Myc (Myc‐related factors) genes, are regulators of pluripotency, stem cell self‐renewal and gene repression (Fig. 1 e). mRNAs of these Core, PrC and Myc module members were highly expressed in the indicated glioblastoma cell lines when compared to BJ cells, except the transcription factor 3 (TCF3). The expression of these modules is also strongly associated with the dedifferentiated phenotypes of tumors.33
The miR‐302/367 cluster strongly affects the global protein expression profile of U87MG cells.
The miR‐302/367 cluster is preferentially expressed in human ES cells.34 Ectopic expression can induce reprogramming of somatic cells14 and yields non‐tumorigenic iPS cells.23, 35 We studied the possibility to alter the transformed phenotype of U87MG glioblastoma cells through the expression of the miR‐302/367 cluster. For this purpose, we cloned a part of LARP7 gene, including the microRNA 302/367 cluster. The gene was ligated into the pLVET‐tTR‐KRAB vector, a doxycycline inducible “tet‐on” vector (Supporting Information Fig. S1a) and U87/MG cells were infected with miR‐302/367 encoding lentiviral particles. The cells were induced with doxycycline and strong expression of the miR‐302/367 cluster was detected (Supporting Information Fig. S1b). A GFP gene is also encoded by the lentiviral gene transfer vector and miR‐302/367 cluster expressing cell lines were obtained by FACS sorting.
We investigated the global effects of the miR‐302/367 cluster on the protein expression pattern of U87MG cells. SILAC (stable isotope labeling by amino acids in cell culture) and mass spectrometry allowed us to compare the patterns of cellular protein expression in the parental U87MG cells with those in U87MG‐miR 302/367 cells (Supporting Information Fig. S2a). The analyses identified 4,450 individual proteins. The relative expression levels in the two cell populations showed that 26 proteins were significantly suppressed and 35 proteins were significantly enhanced in their expression in U87MG‐miR 302/367 cells (Supporting Information Fig. S2c) when compared to U87MG cells. Supporting Information Table S1 lists these proteins.
Several of the suppressed proteins were associated with PI3K/AKT signaling (Table 1). This is interpretable, since the mRNA of the PI3 kinase catalytic domain, the PI3 kinase regulatory domain and of AKT1 comprise target sequences for the miR‐302/367 cluster (Table 1 and Supporting Information Table S3). The suppression of these PI3K/AKT signaling components was confirmed by Western blotting analyses (Fig. 2 b). The protein profiling also shows that the miR‐302/367 cluster enhanced the expression of tumor suppressor genes, cytoskeleton organization genes and metabolism related genes, and the migration inhibitory factor CD9 (Supporting Information Table S1).
Table 1.
List of suppressed proteins upon over‐expression of the miR‐302/367 cluster in U87MG cells (p values < 0.005)
| Predicted target genes | ||||
|---|---|---|---|---|
| Gene | Log2 ratio H/L | miR 302s | miR 367 | KEGG pathway |
| ACADL | −1.7 | Lipid metabolism, PPAR signaling pathway | ||
| CDKN2C | −1.6 | Cell cycle | ||
| PLA2G4A | −2.1 | Fc gamma R‐mediated phagocytosis, | ||
| PAK1 | −1.3 | MAPK signaling pathway | ||
| AKT1 | −1.8 | Yes | PI3K/AKT signaling pathway | |
| FN1 | −2.1 | PI3K/AKT signaling pathway | ||
| NEDD4 | −2.0 | Yes | PI3K/AKT signaling pathway | |
| PIK3C3 | −0.8 | PI3K/AKT signaling pathway | ||
| PIK3CB | −0.9 | PI3K/AKT signaling pathway | ||
| PIK3R1 | −1.4 | Yes | PI3K/AKT signaling pathway | |
| PIK3R2 | −1.6 | PI3K/AKT signaling pathway | ||
| PIK3R4 | −1.2 | PI3K/AKT signaling pathway | ||
| XDH | −1.8 | Purine metabolism | ||
| HSD17B8 | −2.0 | Steroid hormone biosynthesis | ||
| ANKH | −1.3 | Not detected on the KEGG pathway database | ||
| APBB2 | −1.7 | Yes | Not detected on the KEGG pathway database | |
| CHM | −2.9 | Not detected on the KEGG pathway database | ||
| CRABP1 | −2.1 | Not detected on the KEGG pathway database | ||
| CSRP2 | −2.0 | Not detected on the KEGG pathway database | ||
| CYP51A1 | −1.6 | Not detected on the KEGG pathway database | ||
| EPS8L2 | −2.4 | Not detected on the KEGG pathway database | ||
| FHL3 | −1.6 | Not detected on the KEGG pathway database | ||
| GSTA4 | −3.4 | Not detected on the KEGG pathway database | ||
| MYO1D | −1.3 | Yes | Not detected on the KEGG pathway database | |
| NCAM1 | −2.1 | Not detected on the KEGG pathway database | ||
| PDLIM5 | −1.3 | Yes | Not detected on the KEGG pathway database | |
H/L: log ratio heavy isotope/light isotope.
Figure 2.
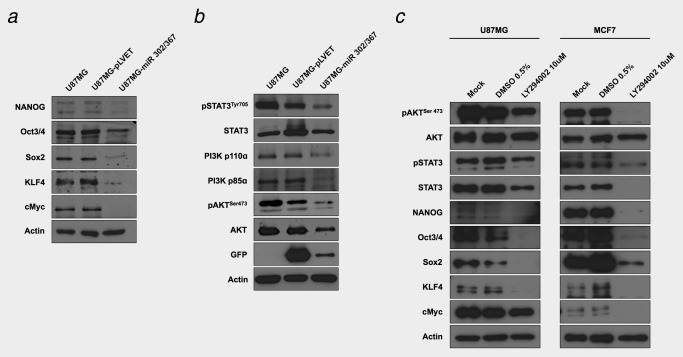
Expression of the reprogramming factors NANOG, OCT4, SOX2, KLF4, c‐MYC, and activated STAT3, PI3K and AKT in U87MG cells expressing the miR‐302/367 cluster and in U87MG cells treated with the LY294002 kinase inhibitor. (a and b) Western blot analyses were carried out with protein lysates obtained from U87MG, U87MG‐pLVET and doxocyclin induced U87MG‐miR 302/367 cells. The indicated proteins were visualized with specific antibodies described in the materials section. Actin was used as the loading control for the gels. (c) Western blot of protein lysates obtained from U87MG and MCF7 cells treated with 10 μM of the PI3K kinase inhibitor LY294002. The indicated proteins were visualized with specific antibodies described in the materials section. Actin was used as the loading control for the gels. Comparison of the control lysates (mock and DMSO 0.5%) with the lysates obtained from the LY294002 treated cells shows the inhibition of reprogramming factor expression, PI3K/AKT and STAT3 signaling by the drug.
Bioinformatic analyses were carried out and the global protein expression profiles of U87MG and U87MG‐miR 302/367 cells were compared with iPS cells, GSC, DGC, normal astrocytes and normal neurons. The heatmaps and the hierarchical clustering indicate that the miR‐302/367 cluster induces a gene expression pattern in U87MG cells which more closely resembles that found in iPS cells and in normal neuronal cells (Figs. 6 a and 6 b).
Figure 6.
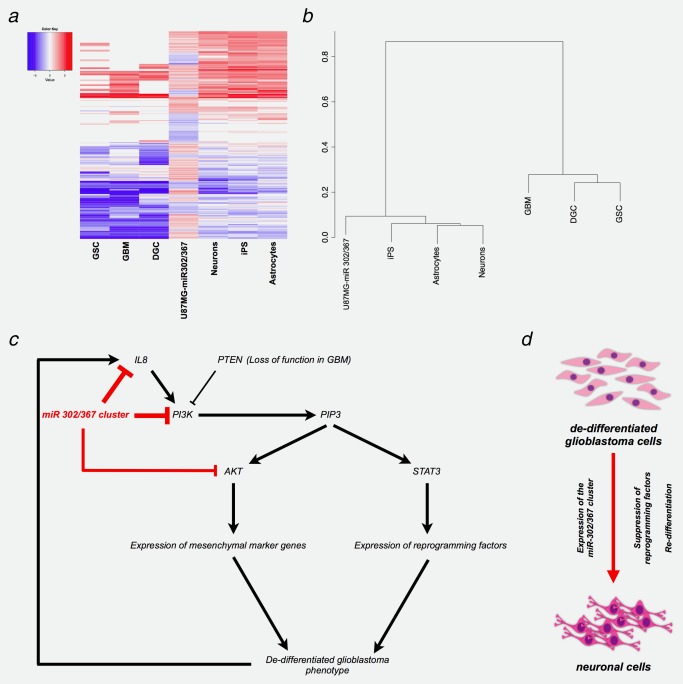
A model for the “deprogramming of glioblastoma cells” by the miR‐302/367 cluster. (a) Heatmaps of significantly regulated genes (p < 0.05) were derived from the protein profiling data. The RNA‐seq of the samples were normalized and compared by Cufflinks. The normalized FPKM values of the all samples were log‐transformed using loge with the FPKM values of U87MG cells, then the loge values were compared with the U87MG‐miR 302/367 protein profiling data. Significantly regulated genes identified in the protein profiling analyses of U87MG‐miR 302/367 cells (p < 0.05) were regarded as a gene set to derive the FPKM values of all RNA‐seq samples by cummeRbund. A list of all RNA‐seq data sets are provided in the Supporting Information Table S7. (b) Hierarchical clustering was performed with the loge‐transformed RNA‐seq data and loge‐transformed protein profiling data. The dendrogram was depicted using the binary data clustering method. (c) Signaling events associated with the functions of the miR‐302/367 cluster. The PI3K/AKT pathway plays a crucial role in the de‐programming process. PI3K activation, strong in U87MG cells, increases AKT and STAT3 activity through induction of phosphatidylinositol (3,4,5)‐triphosphate (PIP3). AKT and STA3 in turn, enhance the expression of mesenchymal marker genes and of reprogramming factors. This contributes to the de‐differentiated glioblastoma phenotype. Expression and secretion of IL‐8 enhances the invasive phenotype by autocrine and paracrine mechanisms and the further activation of PI3K. Expression of the miR‐302/367 cluster in the glioblastoma cells strongly suppresses the de‐differentiated glioblastoma phenotype through reversion of the EMT process and suppression of stem cell genetic programs via the inhibition of the PI3K/AKT and STAT3 signaling pathways. (d) Glioblastoma cells are partially de‐differentiated through expression of stem cell genetic programs, for example, reprogramming factors and gliblastoma initiating marker genes. Expression of the miR‐302/367 cluster induces redifferentiation of the glioblastoma cells through the suppression of the stem cell genetic programs, accompanied by the induction of neuronal differentiation markers, for example, MAP2 and NeuN.
The expression of the miR‐302/367 cluster in U87MG cells also suppresses pluripotency associated genes, neurodevelopmental transcription factors required for stem‐like tumor propagating cells, and Akt and Stat3 signaling.
We compared the consequences of the miR‐302/367 cluster functions on the expression of the reprogramming factors and stem cell genetic programs in normal mouse embryonic fibroblast (MEF) cells and in U87MG tumor cells. We found that in accordance with previous observations,14 the expression of the reprogramming factors was increased in MEF cells upon expression the miR‐302/367 cluster. However, the expression levels of the reprogramming factors were downregulated in the GBM cell lines (Fig. 2 a and Supporting Information Fig. S4a). We also investigated the effects of the miR‐302/367 cluster on stem cell genetic programs, the CPM modules. The miR‐302/367 cluster strongly inhibited the expression of stem cell genetic program related genes, the Core, PrC and Myc modules in U87MG cells (Fig. 3 a). The suppression of these genes might allow for a more differentiated state of the cells.
Figure 3.
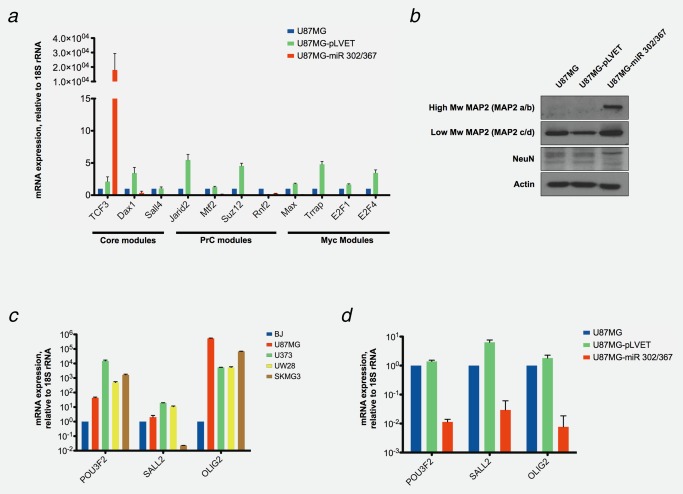
Expression of pluripotency associated genes, neurodevelopmental transcription factors, conferring stem‐like tumor‐propagating properties, and neuronal marker genes in miR‐302/367 cluster expressing U87MG cells. (a) The mRNA expression levels of the indicated pluripotency associated genes, CPM (Core, PrC and Myc) module genes, were determined by RT‐qPCR in RNA extracts of U87MG cells (blue bars), U87‐pLVET, vector infected U87MG control cells (green bars) and U87‐miR 302/367, miR‐302/367 cluster expressing U87MG cells (red bars). The data were standardized by comparison with 18S rRNA and normalized to non‐infected U87MG cells, n = 3. (b) Expression of neuronal differentiation markers MAP2 A/B and NeuN in U87MG, U87MG‐pLVET and U87MG‐miR 302/367 cells. Protein lysates of the cells were obtained and expression levels of MAP2 and NeuN were visualized by Western blotting with specific antibodies. Actin was used as the loading control for the gels. (c). mRNA expression levels of gliblastoma initiating markers, conferring stem‐like tumor‐propagating properties, POU3F2, SALL2 and OLIG2 to GBM cells were measured by RT‐qPCR in BJ (blue bars), U87MG (red bars), U373 (green bars), UW28 (yellow bars) and SKMG3 (brown bars) cells. The RT‐qPCR data were standardized to 18S rRNA, and normalized to BJ cells. n = 3. (d) mRNA expression levels of gliblastoma initiating marker genes, POU3F2, SALL2 and OLIG2, were measured by RT‐qPCR in U87MG (blue bars), U87MG‐pLVET (green bars) and U87MG‐miR 302/367 (red bars) cells. The RT‐qPCR data were standardized to 18S rRNA, and normalized to BJ cells. n = 3. The miR‐302/367 cluster reduces the expression of CPM modules and glioblastoma initiating marker genes and induces neuronal differentiation markers.
The downregulation of PI3K/AKT signaling through the miR‐302/367 cluster most likely causes the reduced expression of the endogenous reprogramming factors. To investigate this hypothesis, U87MG cells and MCF7 cells were treated with the PI3K/AKT signaling inhibitor LY294002. The inhibitor caused a similar reduction in the levels of the reprogramming factors as the expression of the miR‐302/367 cluster in U87MG and in MCF7 cells (Figs. 2 a and 2 c). In addition, STAT3 activation was downregulated in U87MG‐miR 302/367 cells (Fig. 2 b) and in U87MG or MCF7 cells upon exposure to the PI3K/AKT inhibitor LY294002 (Fig. 2 c). We suggest that the downregulation of PI3K/AKT signaling, by the miR‐302/367 cluster or by a low molecular weight drug, similarly cause the suppression of the reprogramming factors in the cancer cells through inhibition of STAT3 activity.
Four transcription factors, POU3F2, SALL2, SOX2 and OLIG2, have been identified which are able to convert differentiated GBM cells into stem‐like tumor‐propagating cells, TPC.36 This is accompanied by stable epigenetic reprogramming to a stem‐like state. We investigated the expression of POU3F2, SALL2 and OLIG2 in glioblastoma cell lines (Fig. 3 c) and found high expression of these transcription factors. Introduction of miR‐302/367 into U87MG cells caused a strong reduction in POU3F2, SALL2 and OLIG2 expression, consistent with the notion of reduced tumorigenicity. We also found that the expression of microtubule‐associated protein‐2 (MAP2), a brain specific A‐kinase anchoring protein crucial for neuronal growth,37 is being restored in U87MG‐miR 302/367 cells (Fig. 3 b). The expression of transformation promoting genes is reduced and the expression of differentiation specific genes is enhanced by the miR‐302/367 cluster in U87MG cells.
U87MG‐miR302/367 cells lose mesenchymal and assume epithelial cell characteristics.
The activation of PI3K/AKT and STAT3 signaling are important contributors to cellular transformation. They regulate proliferation, apoptosis, glucose metabolism and mRNA translation. Because the miR‐302/367 cluster inhibits these signaling pathways in U87MG cells (Fig. 2 b and Table 1) and suppresses the expression of the reprogramming and stem‐like tumor propagating factors (Figs. 2 a and 3 d), we also investigated transformation related phenotypes of these tumor cells. We compared the growth rates and the morphologies of the parental U87MG cells and cells expressing the miR‐302/367 cluster. Both cell populations showed similar rates of proliferation in cell culture. However, U87MG cells grew in an unordered mesenchymal like pattern, whereas miR‐302/367 cluster expressing U87MG cells assumed an more epithelial like cell morphology under regular cell culture conditions (Supporting Information Fig. S5a). Although the origin of U87MG cells is a glioblastoma, these changes in the cellular morphology are reminiscent of a reversal of epithelial to mesenchymal transition. Interestingly, we found a strong reduction of the mesenchymal markers N‐cadherin, Snail, Slug, beta‐catenin and vimentin, and a strong induction of the epithelial marker E‐cadherin in U87MG‐miR 302/367 cells (Fig. 4C, Supporting Information Figs. S5b and S5c); indicative of a mesenchymal to epithelial transition.
Figure 4.
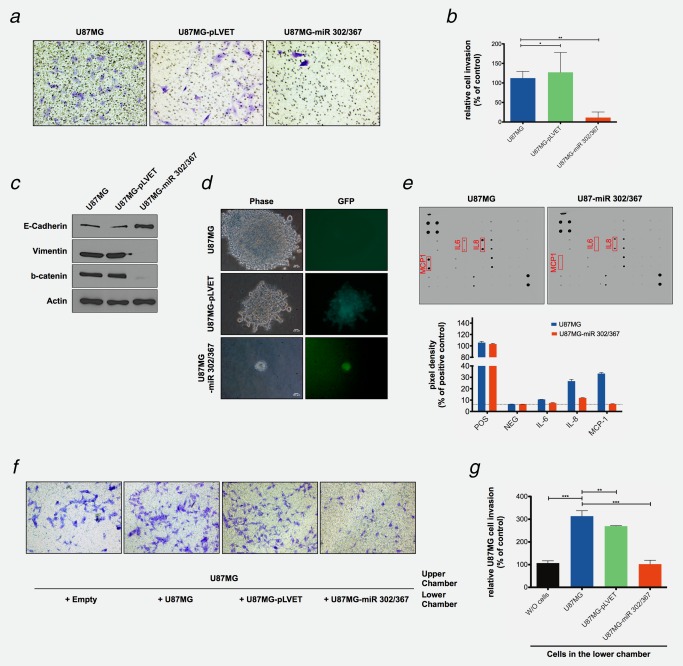
The effects of miR‐302/367 cluster expression on U87MG cell invasiveness and cytokine secretion, colony formation and epithelial and mesenchymal marker gene expression. (a and b) The ability of U87MG, U87MG‐pLVET and U87MG‐miR 302/367 expressing cells to invade an extracellular matrix (ECM) layer was determined and compared. Cells able to penetrate the ECM layer were stained with crystal violet and quantified. Numbers of invasive cells in each cell line were determined in three different areas of one insert. The Percentage of the invasive cells was normalized to noninfected U87MG cells. n = 3, *p < 0.1, **p < 0.01. (c) Expression of epithelial and mesenchymal marker genes in U87MG, U87MG‐pLVET and U87MG‐miR 302/367 expressing cells. Protein lysates were obtained from the three cell lines and E‐cadherin, vimentin and b‐catenin expression was visualized by Western blotting with specific antibodies. Actin was used as loading control for the gels. (d) The ability of U87MG, U87MG‐pLVET and U87MG‐miR 302/367 expressing cells to form soft agar colonies. Cells were incubated in soft agar for 30 days, supplied daily with fresh 10% FCS DMEM medium containing 2 μg/mL Dox. The visible colonies (over 500 μm size) were counted under the microscope (Supporting Information Fig. S7a). Image J software determined the size of each colony, and was used for quantitation (Supporting Information Fig. S7b). (e) The secretion of cytokines by U87MG cells and by U87MG‐miR 302/367 cells were visualized with cytokine array kits and quantitated with a Odyssey infrared imaging system. mRNA expression levels of the cytokines IL‐6, IL‐8 and MCP‐1 in U87MG, U87MG‐pLVET and U87MG‐miR 302/367 cells were measured by RT‐qPCR. The data were standardized by 18S rRNA and normalized to non‐infected U87MG cells. n = 3. (f) Measurements of paracrine effects on U87MG cell invasiveness. U87MG cells, present in the upper chamber, were co‐cultured with U87MG, U87MG‐pLVET and U87MG‐miR 302/367 cells, present in the lower chamber (Supporting Information Fig. S6f). The experiment measures the influence of the medium, conditioned by the cells in the lower chamber, on the invasiveness of the cells in the upper chamber. (g) The cells were co‐cultered as described in Supporting Information Figure S6f and invasive cells were stained with crystal violet (f) and quantified in five independent areas of one insert (g). n = 3. **p < 0.01, ***p < 0.001. The miR‐302/367 cluster blocks expression and secretion of pro‐inflammatory cytokines that induce U87MG cell invasiveness in a paracrine fashion.
Anchorage independent growth and the formation of colonies in soft agar is a widely used assay to identify transformed cells. In our experiments about 0.2% of the U87MG and 0.1% of U87‐pLVET cells formed tumor spheres with diameters over 500 μm within 2 weeks of culture in DMEM medium, 10% FCS and 0.3% agarose. U87MG‐miR 302/367 cells had lost this capacity altogether and only very small cell aggregates could be detected (Fig. 4 d, Supporting Information Figs. S7a and S7b). Similar results were obtained with SKMG3 and U373 glioblastoma cells (Supporting Information Fig. S7c). The loss of anchorage independent growth is also closely associated with the downregulation of PI3K/AKT signaling.
Although gliomas are not of epithelial origin, we evaluated features of epithelial to mesenchymal transition (EMT), frequently observed at the invading edge of primary tumor tissues. The transcription factors Twist, Snail, Slug and ZEB1 are crucial regulators of this process38 determining enhanced cell motility and invasiveness, reduced cell polarity and loss of cell–cell adhesion. Since the miR‐302/367 cluster suppressed Snail and Slug expression in U87MG cells (Supporting Information Fig. S5b), we evaluated the effects of the cluster on cell invasiveness, based on the ability of cells to penetrate a layer of extra cellular matrix components (ECM). U87MG and U87MG‐pLVET cells are well able to penetrate the ECM layer, whereas U87MG‐miR 302/367 cells have nearly lost this capacity (Figs. 4 a and 4 b). The miRNA‐302/367 cluster expression suppresses the U87MG cell invasiveness, accompanied by the downregulation of mesenchymal marker and upregulation of epithelial marker gene expression.
Mesenchymal epithelial transition, MET, has been correlated with the drug sensitivity of tumor cells. We evaluated if miR‐302/367 cluster expression in U87MG cells affects their response to inhibitors of JAK/STAT signaling. U87MG and U87MG‐miR 302/367 cells were exposed to increasing concentrations of the JAK inhibitor AG490 or to the STAT3 inhibitor S3I‐201 for 72 hrs. The JAK inhibitor AG490 had no effects on cell viability of U87MG and U87‐pLVET cells, but the miR‐302/367 cluster expressing U87MG cells exhibit a markedly decreased cellular viability (Supporting Information Fig. S7d). The miR‐302/367 cluster expressing U87MG cells also were more sensitive to low doses of S3I‐201 than the parental U87MG cells (Supporting Information Fig. S7d). The miR‐302/367 cluster induced changes in the U87MG cell morphology, anchorage independent growth and invasion capacities, and their drug sensitivity, most likely a consequence of the inhibition of PI3K/AKT and STAT3 signaling.
Changes in the cytokine secretion patterns modulate the microenvironmental interactions of U87MG‐miR 302/367 cells.
Cytokines, soluble growth factors or hormones present in inflammatory microenvironments, for example, IL‐6, IL‐8 and TGF‐β, play important roles in the regulation of tumor cell phenotypes.39 We investigated the effects of the miR‐302/367 cluster on the expression and secretion of inflammatory cytokines from U87MG cells. Cytokine array analyses and RT‐qPCR showed that the secretion and expression of IL‐6, IL‐8 and MCP‐1 was strongly suppressed in the miR‐302/367 cluster expressing GMB cells when compared to the parental control cells (Fig. 4 e, Supporting Information Fig. S6a, S6c, S6d and S6e). A direct interaction between the 3'UTR of the IL‐8 mRNA and the recognition sequence of the miR‐ 302/367 cluster (Supporting Information Fig. S6b, Supporting Information Table S3) was identified.
The secretion of inflammatory cytokines or soluble growth factors in the tumor microenvironment affects EMT and tumor metastasis through a paracrine mode of action.40 We evaluated if paracrine effects account for the extent of invasiveness of U87MG cells. For this purpose, we exposed U87MG cells to a medium conditioned by miR‐302/367 cluster expressing cells (Fig. 4 f). U87MG cells were co‐cultured in an upper chamber with U87MG cells, U87‐pLVET cells, U87‐miR 302/367 cells or no cells, present in a lower chamber, as depicted in Supporting Information Figure S6f. Strong EMC invasion of the U87MG cells from the upper chamber was observed when U87MG cells or U87‐pLVET cells were present in the lower chamber. The invasiveness of the cells was much reduced when U87‐miR 302/367 cells were plated in the lower chamber (Figs. 4 f and 4 g). Our data suggest that U87MG cells secret soluble factors which are able to enhance the invasiveness of homologous cells in their vicinity. The miR‐302/367 cluster downregulates the secretion of such factors and affects cell invasiveness by autocrine and paracrine mechanisms.
U87MG‐miR 302/367 cells are unable to form tumors or metastasize upon transplantation into mice.
The introduction of the miR‐302/367 cluster into U87MG cells resulted in a strong suppression of transformation related genes and transformation phenotypes in vitro. We also investigated and compared the characteristics of U87MG, U87‐pLVET and U87‐miR 302/367 cells in vivo and their potentials to form tumors and to establish liver metastasis, upon transplantation into immune compromised NSG mice (Fig. 5). After an initial lag phase, U87MG cells and U87MG‐pLVET control cells grew rapidly at the site of injection (Figs. 5 a and 5 b). U87‐miR 302/367 cells did not form tumors during the 30 day observation period (Fig. 5 b). 30 days after tumor cell inoculation, the mice were sacrificed, dissected and metastasis formation in distant organs was investigated. We found liver metastases in three out of seven mice inoculated with the parental U87MG cells. The same result was observed in mice injected with U87MG‐pLVET control cells. No metastases were found in the group of mice injected with U87‐miR 302/367 cells (Fig. 5 c). The effects of miR‐302/367 cluster expression abolish the tumorigenic characteristics of U87MG cells.
Discussion
Targeted tumor therapy, mainly through the inhibition of oncogene products, has improved the quality of life and prolonged the survival intervals of patients. However, redundant and interacting signal transduction pathways, in conjunction with the evolutionary pressure exerted by cancer drugs, frequently causes the emergence of resistant cell variants and the recurrence of cancer cell growth.5, 41 Alternative treatment strategies, based on the manipulation of entire gene expression programs, might allow to circumvent the emergence of drug resistance. The aim is to re‐establish a stable cellular state, determined by a particular epigenetic configurations, which suppresses transformation specific gene expression patterns and phenotypes. The identification of defined molecules, transcription factors or miRNAs able to reprogram differentiated somatic cells, indicate that the epigenetic state of cells can be manipulated in a targeted fashion.
Reprogramming U87MG cells with the miR‐302/367 cluster causes drastic changes in gene expression. Genes, associated with the transformed state of these cells, are suppressed, for example, the reprogramming factors, OCT4, SOX2, KLF4 and c‐MYC. These factors are endogenously expressed in U87MG cells and we assume that their expression contributes to the partially dedifferentiated state of these tumor cells.27 The expression of these factors is strongly suppressed as a consequence of the miR‐302/367 cluster functions. Interestingly, the effects of the miR‐302/367 cluster in this respect seems cell type and genetic background dependent. Induction of OCT4, SOX2, KLF4 and c‐MYC was observed upon expression of the cluster in MEF cells, compare Figure 2 a and Supporting Information Figure S4a. The same is true for the activation of STAT3.
A possible explanation for these differences could be sought in the genetic background and additional mutations present in the tumor cells. Constitutively active mutants of the PI3K catalytic subunit p110a induce tyrosine phosphorylation of STAT342 and the activation of STAT3 results in the induction of the reprogramming factors.43 PI3K p110α, PI3K p85α and AKT, components of the PI3K/AKT signaling pathway, are strongly downregulated by the miR‐302/367 cluster. We assume that the downregulation of PI3K/AKT signaling subsequently causes a decrease in STAT3 activity and thus the reduction of the endogenous expression of the reprogramming factors. The glioblastoma cells are distinguished by a loss of PTEN, and STAT3 activation can be regulated through the PTEN/AKT/LIFRβ/STAT3 axis. We suggest that the activation of STAT3, regulated by the PI3K/AKT signaling pathway, contributes to the dedifferentiated state of these cells through the induction of the expression of the endogenous reprogramming factors, a process reversed by the miR‐302/367 cluster. The observations of our studies and a model for the underlying molecular signaling mechanisms are shown in Figures 6 c and 6 d.
The inhibition of PI3K/AKT/STAT3 signaling, in conjunction with the observed suppression of tumor stem cell genetic programs, could be the cause for additional phenotypic consequences for the glioblastoma cells. PI3K/AKT signaling plays pivotal role in the EMT process and regulates, for example, mesenchymal marker gene expression and E‐cadherin expression. The miR‐302/367 cluster suppressed similarities to the mesenchymal phenotype in U87MG cells, reduced their invasiveness and increased their drug sensitivity.
Pro‐inflammatory cytokines, TNF‐α, IL‐1, IL‐6, IL‐8 and MCP‐1, produced in the tumor microenvironment, enhance tumor development and metastasis.40 These factors are themselves activators of intracellular signal cascades. IL‐8, for example, regulates PI3K/AKT signaling in cancer cells through autocrine and paracrine modes. The miR‐302/367 cluster therefore not only changed the cell intrinsic mobility of the U87MG cells, but modified their cytokine microenvironment and thus contributed to a further decrease of U87MG cell invasiveness.
The miR‐302/367 cluster not only suppressed transforming proteins, but also enhanced the expression of tumor suppressor genes. These genes include MYBBP1A, PEA15 and UCHL1 (Supporting Information Table S1). POU3F2, SALL2, SOX2 and OLIG2 are a group of transcription factors, involved in the establishment of the identity of stem‐like tumor propagating cells (TPC) and possibly responsible for some of the aggressive characteristics of glioblastoma cells.36 These factors can convert DGC into spherogenic and tumor initiating stem‐like tumor propagating cells. The downregulation of these factors in miR‐302/367 cluster expressing U87MG cells most likely causes their loss of tumor formation capacity and the establishment of liver metastasis upon transplantation into NSG mice.
The miR‐302/367 cluster is able to change the gene expression program of U87MG cells in a stable fashion. The consistent downregulation of many genes associated with transformation phenotypes, and the upregulation of tumor suppressor genes, suggests a coordinated mode of action. The restoration of neuronal differentiation marker expression indicates at least a partial reversion into the cells of origin. For this reason we would like to describe this process as “de‐programming of cancer cells,” rather than reprogramming, a term associated primarily with the derivation of induced pluripotent cells.
The effects of the miR‐302/367 cluster are most likely cell type specific and might even differ in tumor cells of different indications. Ectopic expression of the miR‐302/367 cluster, for example, induces the expression of reprogramming factors in breast cancer cells, but suppresses their expression in U87MG cells (Fig. 2 a and Supporting Information Fig. S4a). This could be associated with cooperating mutations present in these cells. A majority of breast cancer cells are characterized by gain‐of‐function mutations in the PI3K gene and GBM cells often exhibit a loss of PTEN gene function. To understand the underlying mechanisms, additional insights into the miR‐302/367 cluster target genes and their functional properties in tumor cells of different origins will be required. This will also yield information in which tumor cells the miR‐302/367 cluster might be able to revert the transformed phenotype.
The functional effects of the miR‐302/367 cluster can favorably influence the malignant features of the genetically highly aberrant U87MG glioblastoma cells. If the proper means of delivery can be found, the miR‐302/367 cluster can be tested in experimental therapeutic conditions in mice. Alternatively, small molecular weight analogues, able to affect the cellular differentiation state in an analogous fashion as the miR‐302/367 cluster, might become useful.44
Supporting information
Supporting Information
Supporting Information
Supporting Information
Supporting Information
Supporting Information Figure 10
Supporting Information Figure 11
Supporting Information Figure 12
Supporting Information Figure 13
Supporting Information Figure 14
Supporting Information Table S1
Supporting Information Table S2
Supporting Information Table S3
Supporting Information Table S4
Supporting Information Table S5
Supporting Information Table S6
Supporting Information Table S7
Acknowledgements
The human GBM cancer cell line SKMG3 was a gift from Sabrina Genssler (Georg‐Speyer‐Haus, Frankfurt). A mouse embryonic fibroblast cell line was obtained from Dr. Uta Rabenhorst (Georg‐Speyer‐Haus, Frankfurt). Antibodies specific for MAP2 and NeuN were provided by Donat Kögel (University of Frankfurt). Tefik Merovci assisted with FACS experiments.
References
- 1. Vogelstein B, Papadopoulos N, Velculescu VE, et al. Cancer genome landscapes. Science 2013;339:1546–58. [DOI] [PMC free article] [PubMed] [Google Scholar]
- 2. Sellers WR. A blueprint for advancing Genetics‐based cancer therapy. Cell 2011;147:26–31. [DOI] [PubMed] [Google Scholar]
- 3. Vanneman M, Dranoff G. Combining immunotherapy and targeted therapies in cancer treatment. Nat Rev Cancer 2012;12:237–51. [DOI] [PMC free article] [PubMed] [Google Scholar]
- 4. Lackner MR, Wilson TR, Settleman J. Mechanisms of acquired resistance to targeted cancer therapies. Future Oncol 2012;8:999–1014. [DOI] [PubMed] [Google Scholar]
- 5. Manstein von V, Yang CM, Richter D, et al. Resistance of cancer cells to targeted therapies through the activation of compensating signaling loops. Curr Signal Transduct Ther 2013;8:193–202. [DOI] [PMC free article] [PubMed] [Google Scholar]
- 6. Lang J‐Y, Shi Y, Chin YE. Reprogramming cancer cells: back to the future. Oncogene 2013;32:2247–8. [DOI] [PubMed] [Google Scholar]
- 7. Suvà ML, Riggi N, Bernstein BE. Epigenetic reprogramming in cancer. Science 2013;339:1567–70. [DOI] [PMC free article] [PubMed] [Google Scholar]
- 8. Li G, Reinberg D. Chromatin higher‐order structures and gene regulation. Curr Opin Genet Dev 2011;21:175–86. [DOI] [PMC free article] [PubMed] [Google Scholar]
- 9. Zhu J, Adli M, Zou JY, et al. Genome‐wide chromatin state transitions associated with developmental and environmental cues. Cell 2013;152:642–54. [DOI] [PMC free article] [PubMed] [Google Scholar]
- 10. Vicente‐Dueñas C, Romero‐Camarero I, Cobaleda C, et al. Function of oncogenes in cancer development: a changing paradigm. EMBO J 2013;32:1502–13. [DOI] [PMC free article] [PubMed] [Google Scholar]
- 11. Apostolou E, Hochedlinger K. Chromatin dynamics during cellular reprogramming. Nature 2013;502:462–71. [DOI] [PMC free article] [PubMed] [Google Scholar]
- 12. Ohnishi K, Semi K, Yamamoto T, et al. Premature termination of reprogramming in vivo leads to cancer development through altered epigenetic regulation. Cell 2014;156:663–77. [DOI] [PubMed] [Google Scholar]
- 13. Abad M, Mosteiro L, Pantoja C, et al. Reprogramming in vivo produces teratomas and iPS cells with totipotency features. Nature 2013;502:340–5. [DOI] [PubMed] [Google Scholar]
- 14. Anokye‐Danso F, Trivedi CM, Juhr D, et al. Highly efficient miRNA‐mediated reprogramming of mouse and human somatic cells to pluripotency. Cell Stem Cell 2011;8:376–88. [DOI] [PMC free article] [PubMed] [Google Scholar]
- 15. Krishnakumar R, Blelloch RH. Epigenetics of cellular reprogramming. Curr Opin Genet Dev 2013;23:548–55. [DOI] [PMC free article] [PubMed] [Google Scholar]
- 16. Anderson MJ, Stanbridge EJ. Tumor suppressor genes studied by cell hybridization and chromosome transfer. FASEB J 1993;7:826–33. [DOI] [PubMed] [Google Scholar]
- 17. Pitha‐Rowe I, Petty WJ, Kitareewan S, et al. Retinoid target genes in acute promyelocytic leukemia. Leukemia 2003;17:1723–30. [DOI] [PubMed] [Google Scholar]
- 18. Højfeldt JW, Agger K, Helin K. Histone lysine demethylases as targets for anticancer therapy. Nat Rev Drug Discov 2013;12:917–30. [DOI] [PubMed] [Google Scholar]
- 19. Cruz FD, Matushansky I. Solid tumor differentiation therapy—is it possible?. Oncotarget 2012;3:559–67. [DOI] [PMC free article] [PubMed] [Google Scholar]
- 20. Nagata S, Hirano K, Kanemori M, et al. Self‐renewal and pluripotency acquired through somatic reprogramming to human cancer stem cells. PLoS ONE 2012;7:e48699. [DOI] [PMC free article] [PubMed] [Google Scholar]
- 21. Zhang X, Cruz FD, Terry M, et al. Terminal differentiation and loss of tumorigenicity of human cancers via pluripotency‐based reprogramming. Oncogene 2013;32:2249–60. [DOI] [PMC free article] [PubMed] [Google Scholar]
- 22. Melton C, Judson RL, Blelloch R. Opposing microRNA families regulate self‐renewal in mouse embryonic stem cells. Nature 2010;463:621–6. [DOI] [PMC free article] [PubMed] [Google Scholar]
- 23. Lin SL, Chang DC, Ying SY, et al. MicroRNA miR‐302 inhibits the tumorigenecity of human pluripotent stem cells by coordinate suppression of the cdk2 and cdk4/6 cell cycle pathways. Cancer Res 2010;70:9473–82. [DOI] [PubMed] [Google Scholar]
- 24. Pontén J, Macintyre EH. Long term culture of normal and neoplastic human glia. Acta Pathol Microbiol Scand 1968;74:465–86. [DOI] [PubMed] [Google Scholar]
- 25. Ohka F, Natsume A, Wakabayashi T. Current trends in targeted therapies for glioblastoma multiforme. Neurol Res Int 2012;2012:878425. [DOI] [PMC free article] [PubMed] [Google Scholar]
- 26. Clark MJ, Homer N, O'Connor BD, et al. U87MG decoded: the genomic sequence of a cytogenetically aberrant human cancer cell line. PLoS Genet 2010;6:e1000832 [DOI] [PMC free article] [PubMed] [Google Scholar]
- 27. Ben‐Porath I, Thomson MW, Carey VJ, et al. An embryonic stem cell‐like gene expression signature in poorly differentiated aggressive human tumors. Nat Genet 2008;40:499–507. [DOI] [PMC free article] [PubMed] [Google Scholar]
- 28. Schoenhals M, Kassambara A, Vos JD, et al. Embryonic stem cell markers expression in cancers. Biochem Biophys Res Commun 2009;383:157–62. [DOI] [PubMed] [Google Scholar]
- 29. Groner B. Determinants of the extent and duration of stat3 signaling. JAKSTAT 2012;1:211–5. [DOI] [PMC free article] [PubMed] [Google Scholar]
- 30. Sherry MM, Reeves A, Wu JK, et al. Stat3 is required for proliferation and maintenance of multipotency in glioblastoma stem cells. Stem Cells 2009;27:2383–92. [DOI] [PMC free article] [PubMed] [Google Scholar]
- 31. Tang Y, Luo Y, Jiang Z, et al. Jak/stat3 signaling promotes somatic cell reprogramming by epigenetic regulation. Stem Cells 2012;30:2645–56. [DOI] [PubMed] [Google Scholar]
- 32. Watanabe S, Umehara H, Murayama K, et al. Activation of akt signaling is sufficient to maintain pluripotency in mouse and primate embryonic stem cells. Oncogene 2006;25:2697–707. [DOI] [PubMed] [Google Scholar]
- 33. Kim J, Orkin SH. Embryonic stem cell‐specific signatures in cancer: insights into genomic regulatory networks and implications for medicine. Genome Med 2011;3:75. [DOI] [PMC free article] [PubMed] [Google Scholar]
- 34. Barroso‐delJesus A, Romero‐López C, Lucena‐Aguilar G, et al. Embryonic stem cell‐specific miR302‐367 cluster: human gene structure and functional characterization of its core promoter. Mol Cellular Biol 2008;28:6609–19. [DOI] [PMC free article] [PubMed] [Google Scholar]
- 35. Kuo C‐H, Deng JH, Deng Q, et al. A novel role of miR‐302/367 in reprogramming. Biochem Biophys Res Commun 2012;417:11–6. [DOI] [PubMed] [Google Scholar]
- 36. Suvà ML, Rheinbay E, Gillespie SM, et al. Reconstructing and reprogramming the Tumor‐propagating potential of glioblastoma Stem‐like cells. Cell 2014;157:580–94. [DOI] [PMC free article] [PubMed] [Google Scholar]
- 37. Khuchua Z, Wozniak DF, Bardgett ME, et al. Deletion of the N‐terminus of murine map2 by gene targeting disrupts hippocampal ca1 neuron architecture and alters contextual memory. Neuroscience 2003;119:101–11. [DOI] [PubMed] [Google Scholar]
- 38. Scheel C, Weinberg RA. Cancer stem cells and epithelial‐mesenchymal transition: concepts and molecular links. Sem Cancer Biol 2012;22:396–403. [DOI] [PMC free article] [PubMed] [Google Scholar]
- 39. Xiang M, Birkbak NJ, Vafaizadeh V, et al. Stat3 induction of miR‐146b forms a feedback loop to inhibit the NF‐κB to IL‐6 signaling axis and STAT3‐driven cancer phenotypes. Sci Signal 2014;7:ra11. [DOI] [PMC free article] [PubMed] [Google Scholar]
- 40. Grivennikov SI, Greten FR, Karin M. Immunity, inflammation, and cancer. Cell 2010;140:883–99. [DOI] [PMC free article] [PubMed] [Google Scholar]
- 41. Lee H‐J, Zhuang G, Cao Y, et al. Drug resistance via feedback activation of stat3 in oncogene‐addicted cancer cells. Cancer Cell 2014;26:207–21. [DOI] [PubMed] [Google Scholar]
- 42. Hart JR, Liao L, Yates JR, et al. Essential role of stat3 in PI3K‐induced oncogenic transformation. Proc Natl Acad Sci USA 2011;108:13247–52. [DOI] [PMC free article] [PubMed] [Google Scholar]
- 43. Kidder BL, Yang J, Palmer S. Stat3 and c‐myc Genome‐wide promoter occupancy in embryonic stem cells. PLoS ONE 2008;3:e3932. [DOI] [PMC free article] [PubMed] [Google Scholar]
- 44. Federation AJ, Bradner JE, Meissner A. The use of small molecules in somatic‐cell reprogramming. Trends Cell Biol 2014;24:179–87. [DOI] [PMC free article] [PubMed] [Google Scholar]
Associated Data
This section collects any data citations, data availability statements, or supplementary materials included in this article.
Supplementary Materials
Supporting Information
Supporting Information
Supporting Information
Supporting Information
Supporting Information Figure 10
Supporting Information Figure 11
Supporting Information Figure 12
Supporting Information Figure 13
Supporting Information Figure 14
Supporting Information Table S1
Supporting Information Table S2
Supporting Information Table S3
Supporting Information Table S4
Supporting Information Table S5
Supporting Information Table S6
Supporting Information Table S7