Abstract
Gastrointestinal graft‐versus‐host disease (GI‐GVHD) is a major and life‐threatening complication of hematopoietic stem cell transplantation (HSCT). This study evaluated the efficacy of ultrasonography (US) for assessing and monitoring GI‐GVHD. GI tract was evaluated by US in 81 patients. US findings were positive in 43 patients, including 11 false positive, and negative in 38 patients. Sensitivity, specificity, positive predictive value, negative predictive value, and accuracy of US for the diagnosis of GI‐GVHD were 100%, 78%, 74%, 100%, and 86%, respectively. Diffuse wall thickening of the ileum was the most frequent finding in patients with GI‐GVHD. Severity of GI‐GVHD was correlated with the thickness of internal low echoic layer of the wall, the echogenicity of mesenteric fat tissue, and the intensity of Doppler signaling. We classified US findings of GI‐GVHD into four US grades. There was a significant correlation between clinical stage of GI‐GVHD and the US grade. These ultrasonographic abnormalities were improved with clinical improvement of GI‐GVHD upon treatment. Thus, US is an effective and efficient non‐invasive means of identifying the extent and severity of GI‐GVHD and monitoring response to treatment.
Keywords: color Doppler, gastrointestinal tract, graft‐versus‐host disease, hematopoietic stem cell transplantation, methylprednisolone, ultrasonography
Allogeneic hematopoietic stem cell transplantation (HSCT) has been increasingly performed for the treatment of various hematological malignancies and immunohematological disorders. One of the major complications of HSCT is graft‐versus‐host disease (GVHD), which is mediated by donor T cells. Incidence of acute GVHD is nearly 70%, with 10% incidence of stage 2 or greater gastrointestinal acute GVHD (GI‐GVHD) 1. As severe GVHD poses high risk of mortality, prompt diagnosis and treatment is essential to improve clinical outcome. While diagnosis of GI‐GVHD is primarily based on classical constellation of symptoms, including abdominal pain, nausea, vomiting, and diarrhea, it often requires endoscopic examination and biopsy to exclude differential diagnosis, such as cytomegalovirus (CMV) enterocolitis 2, 3.
Non‐invasive tests for assessment of GI‐GVHD have been developed, including computed tomography (CT) 4, positron emission tomography (PET) 5, and ultrasonography (US) 6, 7. Among these methods, US is the easiest to perform, most readily available, and least invasive and costly. This study aimed to evaluate the efficacy of US in the assessment and monitoring of patients with GI‐GVHD.
Patients and methods
Patients
Two hundred and fourteen patients received a total of 234 HSCT at our institution between May 2007 and December 2013. During the study period, US was performed in 81 patients. The stage of GI‐GVHD was graded according to the standard criteria 8. Upper and lower GI endoscopic examination and biopsy were performed for histological assessment when it was necessary 9, 10. This study was approved by the institutional review board.
Ultrasonography
US was performed using a PVT‐674 BT (center frequency, 6 MHz) and 704AT/BT (center frequency, 7.5 MHz) equipped with Aplio™ XV/XG/500 (Toshiba Medical Systems Corp., Otawara, Japan). Seven segments of the GI tract were sequentially and individually assessed, including the stomach, duodenum, jejunum, ileum, right‐sided colon, left‐sided colon, and rectum. In this study, five registered medical sonographers in gastroenterology who had more than five‐yr experience performed US examinations. All sonographic findings and measurements were double‐checked by a registered senior sonographer. Methods of measurement are shown in Fig. 1. The thickest and widest parts in each segment were measured to determine the thickness and dilatation, respectively. Abnormal thickening of the GI tract wall was defined as a thickness >5 mm in the stomach and rectum, and >3.5 mm in the small intestine and colon 11, 12, 13. The thickness of internal low echoic layer reflecting inflammation of the mucosa, muscularis mucosa, and submucosa was measured as a representative of inflamed layer in the GI wall. Dilatation of the intestine was defined as a diameter >18 mm when filled with fluid 14. Echogenicity of the surrounding mesenteric fat tissue and presence of ascites were also evaluated.
Figure 1.
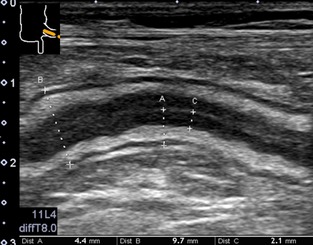
Measurements of the gastrointestinal (GI) tract wall. The thin echoic line in the middle of the internal echo poor layer reflects an interface layer between mucosa of the ventral and dorsal part of the GI tract. The thickest part is measured for the thickening of the GI tract wall (A), the largest part for the diameter of the GI tract (B), and the thickest part for the thickening of the internal low echoic layer (C).
Color Doppler imaging was concomitantly performed, with color gain adjusted until disappearance of noise for maximization of the sensitivity. Color Doppler frequency was set from 3.3 to 7.2 MHz, pulse repetition frequency from 4.7 to 10.1 cm/s, which was adjusted according to the type of probes and the depth of the lesion. Wall filter was set from 3 to 4. Increased Doppler signaling was defined as spotty to linear color Doppler signaling in mucosa and submucosa. It took about 5–20 min to assess entire GI tract by US, depending on the findings.
US detects five layers of the normal GI tract wall 10, 15, 16, 17, 18 (Fig. 2). We classified GI‐GVHD into four grades according to the US findings of the five layers.
Figure 2.
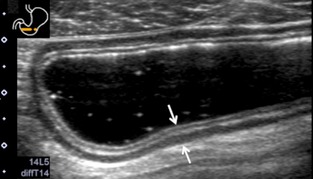
Ultrasonography (US) images of the normal gastrointestinal (GI) tract wall. Five layers are visible in the normal stomach (arrow). The first layer corresponds to the border echo and a part of mucosa, the second layer is the rest of mucosa, the third layer is muscularis mucosa, submucosa, and a part of muscularis propria, the fourth layer is the rest of muscularis propria, and the fifth layer is serosa and border echo.
Statistical analysis
A true‐positive (TP) US corresponded to positive US findings in patients with GI‐GVHD. A true‐negative (TN) US was defined by the absence of GI tract findings in patients without GI‐GVHD. A false‐negative (FN) US corresponded to the absence of US abnormalities in patients with GI‐GVHD. A false‐positive (FP) US corresponded to the findings of more than US grade 1 in patients without GI‐GVHD. US findings and reference diagnosis methods of acute GI‐GVHD were compared using sensitivity, specificity, positive predictive value (PPV), and negative predictive value (NPV). US data were analyzed by Tukey's honestly significant difference test. The correlation between the stage of GI‐GVHD and each US finding was evaluated by Spearman's rank correlation coefficient analysis. Statistical analyses were performed using standard statistical software (IBM SPSS Statistics Version 20.0 for Mac OS, Chicago, IL, USA). A p‐value of <0.05 was considered statistically significant.
Results
US was performed in 81 patients at a median of 28 (range 3–842) d after allogenic HSCT (Table 1). Thirty‐two patients developed GI‐GVHD. GI‐GVHD was histologically confirmed by endoscopic examination in 23 patients, while it was clinically diagnosed in the remaining nine patients. Numbers of patients with stage 1, 2, 3, and 4 GI‐GVHD were 14, 5, 3, and 10, respectively. Forty‐nine patients did not have GI‐GVHD; 26 patients had enteritis not caused by GI‐GVHD; and 23 patients did not have any GI symptoms.
Table 1.
Patient characteristics
| Characteristics | |
|---|---|
| Study population | |
| Number of patient | 81 |
| Age, median (range) | 39 (0–66) |
| Male/female | 46/35 |
| Diagnosis | |
| Leukemia/MDS | 51 |
| Lymphoma/myeloma | 22 |
| Solid tumors | 3 |
| Non‐malignant conditions | 5 |
| Stem cell source | |
| BMT | 38 |
| PBSCT | 13 |
| CBT | 30 |
| Conditioning regimen | |
| Reduced intensity | 40 |
| Myeloablative | 41 |
| GVHD prophylaxis | |
| Tacrolimus based | 66 |
| Cyclosporine based | 15 |
| Diagnosis | |
| GI‐GVHD (GI stage 1, 2, 3, 4) | 32 (14, 5, 3, 10) |
| Non GI‐GVHD | 49 |
| Non GI‐GVHD enteritis | 26 |
| No intestinal symptoms | 23 |
BMT, bone marrow transplantation; PBSCT, peripheral blood stem cell transplantation; CBT, cord blood transplantation; GI‐GVHD, gastrointestinal graft‐versus‐host disease.
Thickening of the ileum wall was observed in 23 (74%) patients with GI‐GVHD and was the most common US finding of GI‐GVHD (Table 2). The second most common finding was the thickening of the colon wall in 57% patients, followed by thickening of the stomach wall, jejunum wall and rectum wall, and duodenum wall in 56%, 40%, and 29% patients, respectively. The average number of affected segments was 3, ranging from 1 to 7 segments. Dilatation of the right‐sided colon, left‐sided colon, jejunum, and ileum was observed in 36%, 29%, 18%, and 16%, respectively. Dilatation of the other intestinal segments was not detected. Increased echogenicity of the fat tissue surrounding the thickened bowel wall was observed in 17 (61%) of 28 patients evaluated. Increased Doppler signaling in the mucosa and submucosa of the GI tract wall was demonstrated in 14 (56%) of 25 patients with GI‐GVHD evaluated. Ascites was detected in 23 patients (72%). In most severe cases, absence of peristalsis was observed in two (6%) patients, and mucosal peeling in the internal lumen of the intestine was observed as double‐lined inner layer in one (3%) patient.
Table 2.
Comparison of ultrasonography (US) findings between gastrointestinal graft‐versus‐host disease (GI‐GVHD) patients and non GI‐GVHD patients
| US findings | GI‐GVHD (n = 32) | Non GI‐GVHD | |
|---|---|---|---|
| Non‐GVHD enteritis (n = 26) | No gastrointestinal symptoms (n = 23) | ||
| Wall thickening (%) | |||
| Stomach | 18 (56) | 6 (23)a | 4 (17)a |
| Duodenum | 8 (29) | 2 (8) | 1 (4) |
| Jejunum | 12 (40) | 4 (15) | 2 (9)a |
| Ileum | 23 (74) | 7 (27)a | 5 (22)a |
| Right‐sided colon | 17 (57) | 8 (31) | 3 (13)a |
| Left‐sided colon | 17 (57) | 3 (12)a | 1 (4)a |
| Rectum | 12 (40) | 2 (8)a | 2 (9)a |
| Internal low echoic layer (mm) | 2.0 ± 0.7 | 0.9 ± 0.5a | 0.8 ± 0.4a |
| No. of affected segments | 3.3 ± 1.9 | 1.2 ± 1.2a | 0.8 ± 0.7a |
| Dilatation (%) | |||
| Jejunum | 6 (18) | 5 (19) | 1 (4) |
| Ileum | 5 (16) | 2 (8) | 1 (4) |
| Right‐sided colon | 11 (36) | 3 (12)a | 2 (9)a |
| Left‐sided colon | 9 (29) | 3 (12) | 1 (4) |
| Hyperechoic meseteric fat (%) | 17 (61) | 1 (4)a | 1 (4)a |
| Increased Doppler signal (%) | 14 (56) | 1 (4)a | 1 (4)a |
| Ascites (%) | 23 (72) | 17 (65) | 18 (78) |
p < 0.05, GI‐GVHD patients were compared to non‐GVHD enteritis and no GI‐GVHD symptoms (Tukey's honestly significant difference test).
Typical US images are shown in Fig. 3. The intestinal wall is thickened, and internal layer is markedly low in the jejunum (Fig. 3A) and ascending colon (Fig. 3B). Endoscopic examination showed swollen and erythrogenic mucosa in the ascending colon (Fig. 3C). Thickening of the colon wall is present in the sigmoid colon (Fig. 3D).
Figure 3.
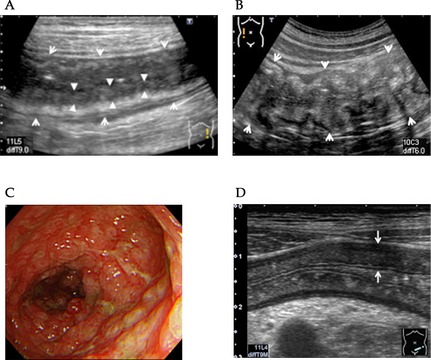
Typical ultrasonography (US) findings in patients with gastrointestinal graft‐versus‐host disease (GI‐GVHD). (A) The jejunum wall is thickened (arrow) and internal low echoic layer is markedly low (arrow head). (B) The ascending colon is severely thickened (arrow). (C) Colonoscopy of the ascending colon reveals severe edema and erosion. (D) The sigmoid colon wall is thickened (arrow).
Degree of the wall thickening and dilatation of the GI tract, number of affected segments, and presence of ascites were not correlated with the clinical stage of GI‐GVHD (Table 3). On the other hand, the thickness of the internal low echoic layer, the echogenicity of mesenteric fat tissue, and the intensity of Doppler signaling were significantly correlated with clinical stage of GI‐GVHD (Table 3). An association between the thickness of the internal low echoic layer and clinical stage of GI‐GVHD is shown in Fig. 4.
Table 3.
Correlations between ultrasonography (US) findings and clinical gastrointestinal graft‐versus‐host disease (GI‐GVHD) stage
| Parameter | Clinical GI‐GVHD stage | r | p | |||
|---|---|---|---|---|---|---|
| 1 | 2 | 3 | 4 | |||
| Wall thickening, mean (mm) | ||||||
| Stomach | 8.4 | 11.6 | 8.6 | 7.2 | −0.24 | 0.34 |
| Duodenum | 4.7 | 6 | – | 5.7 | 0.24 | 0.53 |
| Jejunum | 7.2 | 5.7 | 4.7 | 4.7 | −0.30 | 0.23 |
| Ileum | 5.2 | 5.4 | 4.9 | 4.9 | −0.08 | 0.72 |
| Right‐sided colon | 4.8 | 6.5 | 7.3 | 6.3 | 0.35 | 0.12 |
| Left‐sided colon | 5.2 | 6.1 | 7.2 | 5.7 | 0.11 | 0.62 |
| Rrectum | 6.5 | 11.7 | 6.5 | 5.5 | −0.46 | 0.12 |
| No. of affected segments | 3 | 4 | 3 | 4 | 0.30 | 0.10 |
| Dilatation, mean (mm) | ||||||
| Jejunum | 22 | 20 | – | 19 | −0.95 | 0.14 |
| Ileum | – | 20 | 19 | 23 | −0.79 | 0.11 |
| Right‐sided colon | 34 | – | 31 | 28 | −0.55 | 0.08 |
| Left‐sided colon | 28 | – | – | 25 | −0.35 | 0.36 |
| Thickness of internal low echoic layer | 1.5 | 1.8 | 2.7 | 2.5 | 0.76 | <0.001 |
| Hyperechoic mesenchymal fat | ||||||
| No | 7 | 3 | 1 | 0 | 0.42 | 0.03 |
| Yes | 5 | 2 | 1 | 9 | ||
| Ascites | ||||||
| No | 6 | 0 | 2 | 1 | 0.27 | 0.13 |
| Yes | 8 | 5 | 1 | 9 | ||
| Increased Doppler signaling | ||||||
| No | 9 | 4 | 0 | 1 | 0.65 | <0.001 |
| Yes | 2 | 1 | 2 | 9 | ||
| US grade | ||||||
| 1 | 12 | 2 | 0 | 0 | 0.86 | <0.001 |
| 2 | 2 | 3 | 0 | 1 | ||
| 3 | 0 | 0 | 2 | 7 | ||
| 4 | 0 | 0 | 1 | 2 | ||
Figure 4.
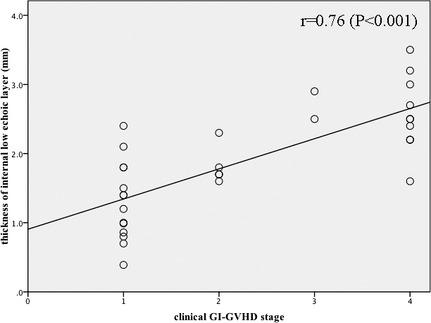
Correlations between the thickness of internal low echoic layer and clinical gastrointestinal graft‐versus‐host disease (GI‐GVHD) stage. A significant correlation is found between the thickness of internal low echoic layer and clinical GI‐GVHD stage.
Among five layers in the GI wall, both mucosa and submucosa were preferentially involved in GI‐GVHD, and their echo level became lower than normal as the severity of GI‐GVHD increases. Therefore, we classified US findings of GI‐GVHD into four grades according to the US findings (Fig. 5). US grade 1 was defined as slight wall thickening with preserved boundary between internal low echoic layer (mucosa) and submucosa (Fig. 5A). US grade 2 shows wall thickening with the obscure boundary (Fig. 5B). US grade 3 shows wall thickening with low echoic internal layer, involving mucosa and submucosa with an increased Doppler signaling (Fig. 5C). US grade 4 shows mucosal epithelium pealing in the internal lumen or dilatation of intestine filled with fluid or absence of peristalsis (Fig. 5D). There was a significant correlation between the clinical stage of GI‐GVHD and the US grade (Table 3).
Figure 5.
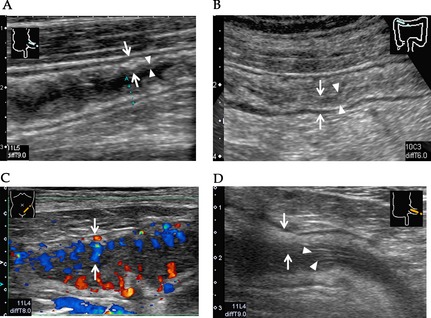
Ultrasonography (US) grading of gastrointestinal graft‐versus‐host disease (GI‐GVHD). (A) US grade 1: Mucosa and submucosal layers are slightly thickened in the wall layer (arrow) and the boundary between internal low echoic layer (mucosa) and the third layer is clear (arrow head). (B) US grade 2: Diffuse wall thickness (arrow) and the boundary of internal low echoic layer and submucosa is obscure (arrow head). (C) US grade 3: Internal low echoic layer is markedly low, and increased Doppler signaling is seen in the layer (arrow). (D) US grade 4: Desquamated mucosal epithelium (arrow head) is seen in the internal lumen with wall thickening (arrow).
Follow‐up US studies in 22 patients with GI‐GVHD showed improvement of the abnormalities in patients successfully treated with methylprednisolone (mPSL), but in none of the non‐responding patients. Representative US findings of a patient successfully treated are shown in Fig. 6. At the onset of GI‐GVHD, CT scanning showed wall thickening and dilatation of the colon and small intestine with air–fluid levels, suggesting paralytic ileus (Fig. 6A). Sigmoidoscopic evaluation showed diffuse and edematous mucosa (Fig. 6B). US showed thickening of the transverse colon wall (Fig. 6C). These abnormalities disappeared after treatment (Fig. 6D–F).
Figure 6.
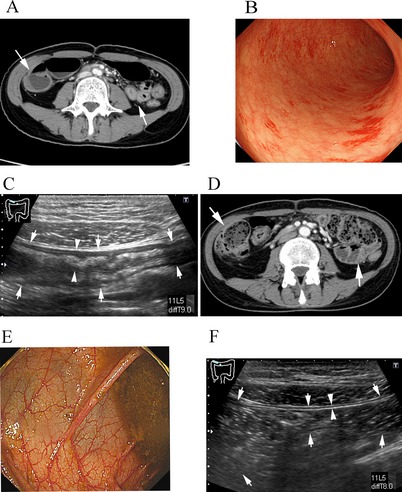
Effects of graft‐versus‐host disease (GVHD) treatment on ultrasonography (US) findings. (A–C) Images before treatment. (A) Computed tomography (CT) scan shows thickening of the wall of the small intestine and colon. (B) Sigmoidoscopy shows edematous mucosa. (C) US shows thickening of the transverse colon wall. (D–F) Images after mPSL treatment. (D) CT shows decreased thickening of the gastrointestinal (GI) wall. (E) Colonoscopy shows improvement in edematous and swollen mucosa. (F) US shows decreased thickening of the transverse colon wall.
In 26 patients with non‐GVHD enterocolitis, abnormal US findings such as wall thickening and luminal dilatation were limited to narrow lesions (Table 2). In patients not having intestinal symptoms, these US abnormalities were rarely detected. Increased Doppler signaling and echogenicity of mesenteric fat tissue were exclusively observed in patients with GI‐GVHD.
Overall, US findings were positive in 43 patients and negative in 38 patients. TP, FP, FN, and TN were 32, 11, 0, and 38, respectively (Table 4). Sensitivity, specificity, PPV, and NPV of US for the diagnosis of GI‐GVHD were 100%, 78%, 74%, and 100%, respectively. Diagnostic accuracy of US was 86%.
Table 4.
Performance of ultrasonography for the diagnosis of gastrointestinal graft‐versus‐host disease (GI‐GVHD)
| True positive | True negative | False negative | False positive | |
|---|---|---|---|---|
| N | 32 | 38 | 0 | 11 |
| PPV | NPV | Sensitivity | Specificity | |
|---|---|---|---|---|
| % | 74 | 100 | 100 | 78 |
PPV, positive predictive value; NPV, negative predictive value.
In FP cases, one patient had CMV colitis and showed diffuse wall thickening from the stomach to the ileum. One patient had Epstein–Barr virus infection and showed slight thickness of the terminal ileum. The remaining nine patients had other causes of infection, and US findings were modest. In these FP cases, there was only one case showing an increase in Doppler signaling or echogenicity of mesenteric fat tissue.
Discussion
Our study demonstrated that diffuse wall thickness of the GI tract involving multiple segments was the most common finding in the patients with GI‐GVHD and this finding help us to distinguish GI‐GVHD from other causes of enteritis. This is probably due to more diffuse involvement of GI tract in GI‐GVHD than other cases of enteritis. There were 11 FP cases that had viral and bacterial enterocolitis. US abnormalities in these FP cases were milder and less extensive than those in patients with GI‐GVHD, although diffuse and extensive wall thickening and dilatation of the colon were also reported in severe cases of CMV enterocolitis 19, 20. The strength of our study is high sensitivity (100%) and NPV (100%) of US performance, suggesting that US is a useful tool for helping diagnosis of GI‐GVHD non‐invasively.
US findings also correlated with clinical severity of GI‐GVHD. Particularly, thickness of the internal low echoic layer suggesting inflammation in the mucosa and submucosa, degrees of the increased Doppler signaling, echogenicity of mesenteric fat tissue, and US grades reflect clinical severity of GI‐GVHD. On the other hand, GI tract wall thickness and luminal dilatation were not correlated with severity of GI‐GVHD.
Diagnosis of GI‐GVHD is based on the observation of a spectrum of clinical symptoms and is often assisted by endoscopic examination and biopsy when the diagnosis is unclear. GI endoscopy is also utilized to map GI‐GVHD lesions, but often difficult to perform in the presence of severe GI symptoms and assessment of the small intestine is difficult. In contrast, CT, US, and PET enable evaluation of entire GI tract non‐invasively. Typical CT and US findings of patients with GI‐GVHD include luminal dilatation, thickening of the GI tract wall, air–fluid levels suggestive of paralytic ileus, and inflammatory thickening of fat tissue surrounding the involved GI tract 12, 19, 21, 22. PET is also useful for disease activity mapping 5, 18. Among these modalities, US allows evaluation of the entire GI tract except for the esophagus, and B mode US and Doppler study could detect inflammatory legions limited within certain wall layers that cannot be detected by CT, MRI, and PET. Therefore, US is useful to map GI‐GVHD lesions and to monitor the course of GI‐GVHD after treatment.
There are several limitations that should be taken into account when interpreting the findings, including the use of a retrospective design and small numbers of patients. Prospective studies investigating a larger number of patients will be required to confirm our findings. While some difficulty would be concerned in delineating the GI tract of severely obese patients which we did not face in our study, it is anticipated that recent improvements in US technology that allow for greater penetration will overcome this limitation in future investigations. Despite these limitations and while acknowledging the need for further research, the study provides evidence that US is an effective and efficient non‐invasive means of identifying the sites and severity of the GI tract involved in GI‐GVHD and monitoring response to treatment in patients with GI‐GVHD.
Authors’ contributions
MN and TT designed the study and wrote the manuscript. AS and TE submitted the data and reviewed and completed the data as well as reviewed the results. MS, YK, SO, TH, TI, TE, AI, and KH submitted the data. HS and CS reviewed the results.
Acknowledgements
This study was partly supported by JSPS KAKENHI (25293217 to T.T.) and a Health and Labor Science Research Grant (T.T.).
Nishida M, Shigematsu A, Sato M, Kudo Y, Omotehara S, Horie T, Iwai T, Endo T, Iguchi A, Shibuya H, Hatanaka K, Shimizu C, Teshima T. Ultrasonographic evaluation of gastrointestinal graft‐versus‐host disease after hematopoietic stem cell transplantation.
Conflict of interests: All authors declare no conflict of interest.
References
- 1. Gooley TA, Chien JW, Pergam SA et al. Reduced mortality after allogeneic hematopoietic‐cell transplantation. N Engl J Med 2010: 363: 2091. [DOI] [PMC free article] [PubMed] [Google Scholar]
- 2. Glucksberg H, Storb R, Fefer A et al. Clinical manifestations of graft‐versus‐host disease in human recipients of marrow from HL‐A‐matched sibling donors. Transplantation 1974: 18: 295. [DOI] [PubMed] [Google Scholar]
- 3. Dignan FL, Clark A, Amrolia P et al. Diagnosis and management of acute graft‐versus‐host disease. Br J Haematol 2012: 158: 30. [DOI] [PubMed] [Google Scholar]
- 4. Shimoni A, Rimon U, Hertz M et al. CT in the clinical and prognostic evaluation of acute graft‐vs‐host disease of the gastrointestinal tract. Br J Radiol 2012: 85: e416. [DOI] [PMC free article] [PubMed] [Google Scholar]
- 5. Stelljes M, Hermann S, Albring J et al. Clinical molecular imaging in intestinal graft‐versus‐host disease: mapping of disease activity, prediction, and monitoring of treatment efficiency by positron emission tomography. Blood 2008: 111: 2909. [DOI] [PubMed] [Google Scholar]
- 6. Schreyer AG, Landfried K, Zorger N et al. Transmural penetration of intravenously applied microbubbles during contrast‐enhanced ultrasound as a new diagnostic feature in patients with GVHD of the bowel. Bone Marrow Transplant 2011: 46: 1006. [DOI] [PubMed] [Google Scholar]
- 7. Benedetti E, Bruno B, McDonald GB et al. Prospective qualitative and quantitative non‐invasive evaluation of intestinal acute GVHD by contrast‐enhanced ultrasound sonography. Bone Marrow Transplant 2013: 48: 1421. [DOI] [PubMed] [Google Scholar]
- 8. Przepiorka D, Weisdorf D, Martin P et al. 1994 Consensus conference on acute GVHD grading. Bone Marrow Transplant 1995: 15: 825. [PubMed] [Google Scholar]
- 9. Sale GE, Shulman HM, McDonald GB, Thomas ED. Gastrointestinal graft‐versus‐host disease in man. A clinicopathologic study of the rectal biopsy. Am J Surg Pathol 1979: 3: 291. [DOI] [PubMed] [Google Scholar]
- 10. Epstein RJ, McDonald GB, Sale GE, Shulman HM, Thomas ED. The diagnostic accuracy of the rectal biopsy in acute graft‐versus‐host disease: a prospective study of thirteen patients. Gastroenterology 1980: 78: 764. [PubMed] [Google Scholar]
- 11. Klein SA, Martin H, Schreiber‐Dietrich D et al. A new approach to evaluating intestinal acute graft‐versus‐host disease by transabdominal sonography and colour Doppler imaging. Br J Haematol 2001: 115: 929. [DOI] [PubMed] [Google Scholar]
- 12. Haber HP, Schlegel PG, Dette S, Ruck P, Klingebiel T, Niethammer D. Intestinal acute graft‐versus‐host disease: findings on sonography. AJR Am J Roentgenol 2000: 174: 118. [DOI] [PubMed] [Google Scholar]
- 13. Sey MS, Gregor J, Chande N et al. Transcutaneous bowel sonography for inflammatory bowel disease is sensitive and specific when performed in a nonexpert low‐volume North American center. J Ultrasound Med 2013: 32: 1413. [DOI] [PubMed] [Google Scholar]
- 14. Nishida M, Kimura M, Sawaguchi T, Numahata I, Ishidawa S, Imai K. Usefulness of measuring the diameter of the large intestine by transabdominal ultrasound in patients with acute colitis. J Med Ultrason 2002: 29: 153. [Google Scholar]
- 15. Kimmey MB, Martin RW, Haggitt RC, Wang KY, Franklin DW, Silverstein FE. Histologic correlates of gastrointestinal ultrasound images. Gastroenterology 1989: 96(2 Pt 1): 433. [DOI] [PubMed] [Google Scholar]
- 16. Yoshida S, Tanaka S, Kunihiro K et al. Diagnostic ability of high‐frequency ultrasound probe sonography in staging early gastric cancer, especially for submucosal invasion. Abdom Imaging 2005: 30: 518. [DOI] [PubMed] [Google Scholar]
- 17. Yamanaka T. JGES consensus meeting report in DDW – Japan 2000, Kobe: interpretation of the layered structure of gastrointestinal wall with endoscopic ultrasonography. Dig Endosc 2002: 14: 39. [Google Scholar]
- 18. Aibe T, Fuji T, Okita K, Takemoto T. A fundamental study of normal layer structure of the gastrointestinal wall visualized by endoscopic ultrasonography. Scand J Gastroenterol Suppl 1986: 123: 6. [DOI] [PubMed] [Google Scholar]
- 19. Dohmen K, Harada M, Ishibashi H et al. Ultrasonographic studies on abdominal complications in patients receiving marrow‐ablative chemotherapy and bone marrow or blood stem cell transplantation. J Clin Ultrasound JCU 1991: 19: 321. [DOI] [PubMed] [Google Scholar]
- 20. Kirkpatrick ID, Greenberg HM. Gastrointestinal complications in the neutropenic patient: characterization and differentiation with abdominal CT. Radiology 2003: 226: 668. [DOI] [PubMed] [Google Scholar]
- 21. Jones B, Fishman EK, Kramer SS et al. Computed tomography of gastrointestinal inflammation after bone marrow transplantation. AJR Am J Roentgenol 1986: 146: 691. [DOI] [PubMed] [Google Scholar]
- 22. Horton KM, Corl FM, Fishman EK. CT evaluation of the colon: inflammatory disease. Radiographics 2000: 20: 399. [DOI] [PubMed] [Google Scholar]


