

Abstract
Vertical divergence in marine organisms is being increasingly documented, yet much remains to be carried out to understand the role of depth in the context of phylogeographic reconstruction and the identification of management units. An ideal study system to address this issue is the beaked redfish, Sebastes mentella – one of four species of ‘redfish’ occurring in the North Atlantic – which is known for a widely distributed ‘shallow‐pelagic’ oceanic type inhabiting waters between 250 and 550 m, and a more localized ‘deep‐pelagic’ population dwelling between 550 and 800 m, in the oceanic habitat of the Irminger Sea. Here, we investigate the extent of population structure in relation to both depth and geographic spread of oceanic beaked redfish throughout most of its distribution range. By sequencing the mitochondrial control region of 261 redfish collected over a decadal interval, and combining 160 rhodopsin coding nuclear sequences and previously genotyped microsatellite data, we map the existence of two strongly divergent evolutionary lineages with significantly different distribution patterns and historical demography, and whose genetic variance is mostly explained by depth. Combined genetic data, analysed via independent approaches, are consistent with a Late Pleistocene lineage split, where segregation by depth probably resulted from the interplay of climatic and oceanographic processes with life history and behavioural traits. The ongoing process of diversification in North Atlantic S. mentella may serve as an ‘hourglass’ to understand speciation and adaptive radiation in Sebastes and in other marine taxa distributed across a depth gradient.
Keywords: approximate Bayesian computation, depth, population divergence, redfish, Sebastes, speciation
Introduction
While recent studies continue to amass evidence for notable patterns of population structure in the oceans (Sala‐Bozano et al. 2009; Therkildsen et al. 2013; Silva et al. 2014), the long‐standing paradigm of limited geographic barriers, high dispersal potential and large effective population size continues to hold when comparing oceanic with continental environments (Hauser & Carvalho 2008). Despite interpretive frameworks that help explain marine population structure based on geographical distance (Palumbi 1994; Weersing & Toonen 2009), oceanographic features (Gaither et al. 2010; Galindo et al. 2010; Selkoe & Toonen 2011) and life histories (Hare et al. 2005; Riginos et al. 2014), the reconstruction of connectivity patterns and recent evolutionary processes in oceanic species remains a mighty task, due to the aforementioned ‘marine paradigm’ (see Waples 1998; Avise 2004; Hauser & Carvalho 2008) and the inherent difficulty – compared to terrestrial and freshwater habitats – of even locating populations and collecting representative samples over vast areas.
All of the above is further compounded by a conspicuous, yet seldom investigated, factor: depth. Depth physically multiplies the expanses across which individuals can disperse and populations can spread, over both ecological and evolutionary timescales. Depth is also associated with a wide variety of environmental factors, including temperature, salinity, hydrostatic pressure, food resources and light, which, independently or in combination, influence physiology, behaviour and adaptations (Somero 1992; Hyde et al. 2008; Vonlanthen et al. 2008; Irwin 2012; Roy et al. 2012; Yancey et al. 2014). As more studies document the emergence of depth‐related patterns, it becomes apparent that this factor plays a role in the formation of distinct biological units, even in large, near‐continuously distributed populations (Doebeli & Dieckmann 2003; Vonlanthen et al. 2008; Knutsen et al. 2009; Stefánsson et al. 2009a; Ingram 2010; Roy et al. 2012; Jennings et al. 2013). Sea level fluctuations during the last glacial cycle have been shown to have a role in shaping aquatic environments (Blanchon & Shaw 1995) and are thought to have contributed to the isolation and divergence of marine organisms (Ludt & Rocha 2015). Furthermore, the distribution of oceanic species over vast geographical areas is impacted by complex, large‐scale ocean circulation processes, interplaying with bathymetric features along continental margins and mid‐ocean ridges (Hemmer‐Hansen et al. 2007; Knutsen et al. 2009). The full understanding of the role of depth in the context of physical oceanography, complex life histories and the historical backdrop appears as one main topical challenge in marine population biology, which may also have significant consequences for conservation and management.
One taxonomical group that has played a pivotal role in shaping our understanding of adaptive divergence along depth gradients in marine environments is the genus Sebastes (Alesandrini & Bernardi 1999; Hyde & Vetter 2007; Sivasundar & Palumbi 2010). While most species of Sebastes are limited to the North Pacific (n > 100), with two occurring in the Southern Hemisphere, the four ‘young’ North Atlantic (NA) species are thought to have descended from an ancestor of the North Pacific Sebastes alutus lineage that invaded the NA under 3 my ago, when the Bering Strait opened as a result of warming Arctic waters (Raymo et al. 1990; Love et al. 2002; Hyde & Vetter 2007). Sebastes spp. are ovoviviparous (i.e. internal fertilization), long‐lived, slow‐growing and late‐maturing species with low natural mortality; such unique life history characteristics influence complex population structuring (Cadrin et al. 2010). The beaked redfish, S. mentella, widely distributed throughout the boreal waters of the North Atlantic and Arctic Oceans, exhibits complex depth‐associated patterns of substructure (Stefánsson et al. 2009a; Cadrin et al. 2010; Shum et al. 2014). While a demersal unit is recognized along the Icelandic continental shelf and slopes (Cadrin et al. 2010), S. mentella exhibits a primarily pelagic, open‐ocean behaviour, occurring in assemblages at different depth layers, with a widely distributed shallow‐pelagic group inhabiting depths between 200 and 550 m, and a deep‐pelagic group between 550 and 800 m, mostly circumscribed to the northeast Irminger Sea (Stefánsson et al. 2009a, b; Cadrin et al. 2010; Planque et al. 2013; Shum et al. 2014).
Almost three decades of research investigating the geographic patterns and genetic structuring of S. mentella have resulted in intense debates (Cadrin et al. 2011; Makhrov et al. 2011) regarding the number of genetically distinct populations, how they are spatially structured and connected, and how and when they have achieved their current distribution. All efforts so far had been based on traditional sampling campaigns mostly focused on geographical/fishery coverage (Cadrin et al. 2010; Shum et al. 2014), with a lack of adequate standardized sampling and replication across depth layers where different beaked redfish assemblages occur (Bergstad 2013; Planque et al. 2013). Furthermore, previous studies lacked either the appropriate molecular and analytical toolkit (Stefánsson et al. 2009b) or the sampling coverage (Shum et al. 2014) to robustly test specific phylogeographic hypotheses.
Here, we present the first extensive sampling and phylogeographic investigation of pelagic S. mentella in the North Atlantic using mitochondrial and nuclear genetic markers to resolve the interplay between longitudinal, latitudinal and vertical gradients in shaping the structure of this oceanic species. Specifically, we aim to (i) examine the phylogeographic history of oceanic S. mentella across the northeast Atlantic, with special attention to the main two clades identified in Shum et al. (2014), (ii) assess the degree to which mitochondrial lineage distribution fits with the currently perceived S. mentella stock structure and (iii) reconstruct the most realistic scenario for the evolution of this species in the North Atlantic.
Materials and methods
Sample collection
Samples were collected as part of the Icelandic Marine Research Institute 2013 survey, conducted from 11th June to the 6th July 2013 throughout the Irminger Sea. Trawling for redfish involved collecting replicated samples along a survey transect from three geographical zones at seven sites including shallow (above 500 m) and deep (below 500 m) habitats (Fig. 1, Table 1). A MultiSampler unit with three separate cod‐ends was attached to the end of the pelagic trawl enabling the collection of several independent discrete samples at three different depth strata in one trawl haul (Engås et al. 1997). The opening and closing of the nets were programmed to specific depths using a timing system with approximate sampling depths ranging between 200 and 350 m, 350 and 550 m, and 550 and 900 m. These replicated sampling sites were targeted to explore the genetic variance associated with geography (latitude, longitude) and depth for Sebastes mentella.
Figure 1.
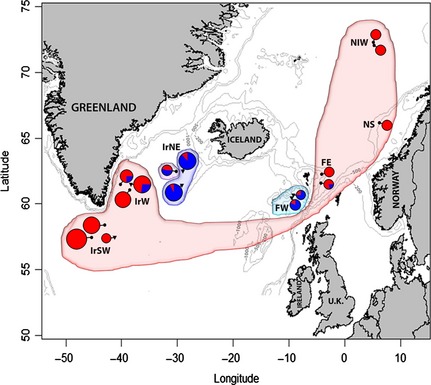
Sample collection locations and distribution of mtDNA haplotypes. Shading shows the samova group structure and circles show distribution of clade A (red) and B (blue) haplogroups (see Fig. 2). Point circles and inverted triangles indicate redfish caught above and below 500 m, respectively. Grey lines indicate 200, 500 and 1000 m isobaths. See Table 1 for location codes.
Table 1.
Location, group code, year of capture, trawl depth range, position, number of individuals (N), and nucleotide (π) and haplotype (h) diversities of Sebastes mentella investigated for 2013 and 2006/2007 data from the North Atlantic
| Location | Group code | Year | Gear | Trawl depth range | Latitude (N) | Longitude | N | π + SD | h + SD |
|---|---|---|---|---|---|---|---|---|---|
| Irminger Sea | |||||||||
| Northeast deep | IrNEDP13 | 2013 | MS | 550–650 | 62.44 | −29.08 | 26 | 0.003 ± 0.0006 | 0.754 ± 0.090 |
| Northeast shallow | IrNESP13 | 2013 | MS | 250–300 | 62.45 | −30.21 | 11 | 0.006 ± 0.0019 | 0.927 ± 0.066 |
| West shallow | IrWSP13 | 2013 | MS | 200–275 | 61.00 | −38.53 | 23 | 0.004 ± 0.0007 | 0.893 ± 0.036 |
| West intermediate | IrWInt13 | 2013 | MS | 475 | 61.45 | −40.19 | 16 | 0.004 ± 0.0004 | 0.908 ± 0.040 |
| West deep | IrWDP13 | 2013 | MS | 600 | 61.44 | −29.11 | 26 | 0.005 ± 0.0006 | 0.898 ± 0.029 |
| Southwest shallow | IrSWSP13 | 2013 | MS | 300 | 57.44 | −45.40 | 33 | 0.004 ± 0.0005 | 0.883 ± 0.035 |
| Southwest deep | IrSWDP13 | 2013 | MS | 550–850 | 57.45 | −41.04 | 8 | 0.004 ± 0.0007 | 0.857 ± 0.108 |
| Archived samples | |||||||||
| Irminger Sea | |||||||||
| Southwest shallow | IrSWSP06 | 2006 | Pe | 284 | 58.38 | −43 | 25 | 0.004 ± 0.0005 | 0.883 ± 0.035 |
| Northeast deep | IrNEDP06 | 2006 | Pe | 786 | 61.44 | −29.11 | 26 | 0.002 ± 0.0005 | 0.578 ± 0.114 |
| Faroe Islands west | |||||||||
| East | FW1DP07 | 2007 | Dm | 589–644 | 60.59 | −9.32 | 9 | 0.006 ± 0.0014 | 0.917 ± 0.092 |
| West | FW2DP07 | 2007 | Dm | 704–658 | 60.44 | −9.57 | 11 | 0.006 ± 0.0008 | 0.927 ± 0.066 |
| Faroe Islands east | |||||||||
| South | FE1SP07 | 2007 | Dm | 388–401 | 61.59 | −4.19 | 9 | 0.007 ± 0.0027 | 0.833 ± 0.127 |
| North | FE2SP07 | 2007 | Dm | 366–433 | 62.21 | −4.13 | 9 | 0.005 ± 0.0009 | 0.911 ± 0.077 |
| Norwegian shelf | NSSP07 | 2007 | Dm | 430 | 66.14 | 6.2 | 10 | 0.002 ± 0.0008 | 0.533 ± 0.180 |
| Norwegian international waters | |||||||||
| South | NIW1SP07 | 2006 | Pe | 440 | 72.01 | 5.3 | 10 | 0.003 ± 0.0010 | 0.800 ± 0.100 |
| North | NIW2SP07 | 2006 | Pe | 445 | 72.21 | 5.15 | 10 | 0.003 ± 0.0009 | 0.822 ± 0.097 |
MS, multisampler; Dm, demersal; Pe, pelagic trawls.
Between five and 30 specimens were collected and sampled from each haul section, for a total of 143 dorsal fin clip tissue samples of S. mentella collected at seven sites distributed throughout the Irminger Sea and stored in 100% ethanol. The data set was also complemented by the 50 mtDNA control region and 22 rhodopsin sequences that first revealed the existence of two depth‐associated S. mentella clades in the Irminger Sea (Shum et al. 2014; GenBank Accession nos: mtDNA, KM013849‐KM013898; rhodopsin, KM013899.1‐KM013920.1) and by 68 randomly selected archived tissue samples (previously genotyped at 12 microsatellite loci by Stefánsson et al. 2009a), to better cover the current biogeographical spread of the species: west Faroe (n = 20) and east Faroe (n = 18) collected off the Faroese shelf in 2007, Norwegian shelf (n = 10), and pelagic collections from Norwegian international waters (n = 20), also from 2006 to 2007 surveys (Fig. 1, Table 1). Additional archived tissue samples of eight Sebastes norvegicus and seven Sebastes viviparus were also analysed for downstream analysis as out‐groups, as well as 36 tissue samples of Sebastes fasciatus collected on board the Irish research vessel RV Celtic Explorer in May 2012 off Newfoundland, Canada. The sampling scheme and sample sizes per site are summarized in Table 1.
Generation of molecular data
DNA was extracted using a modified salt extraction protocol (Miller et al. 1988). An approximately 500‐base pair (bp) fragment of the non‐coding mitochondrial control region was amplified using primers developed by Hyde & Vetter (2007; D‐RF: 5′‐CCT GAA AAT AGG AAC CAA ATG CCA G‐3′ and Thr‐RF: 5′‐GAG GAY AAA GCA CTT GAA TGA GC‐3′). The intron‐free rhodopsin gene was used to amplify an approximately 800‐bp fragment in 138 S. mentella samples using primers developed by Chen et al. (2003): Rh193, 5′‐CNT ATG AAT AYC CTC AGT ACT ACC‐3′ and Rh1039r, 5′‐TGC TTG TTC ATG CAG ATG TAG A‐3′. PCRs and temperature profiles followed Shum et al. (2014). PCR products were purified and sequenced by Source BioScience LifeSciences (http://www.lifesciences.sourcebioscience.com/). Resulting sequences were manually checked for quality, edited and trimmed using chromas lite 2.1.1 (http://technelysium.com.au/?page_id=13) and aligned using muscle v3.7 (Edgar 2004).
Data analysis
Mitochondrial DNA variation and structure
Molecular diversity indices, including nucleotide (π) (Nei 1987) and haplotype (h) (Nei & Tajima 1981) diversities, were estimated using dnasp v5.10 (Librado & Rozas 2009). Haplotype genealogies were constructed in the program HapView, following a method described by Salzburger et al. (2011), based on a maximum‐likelihood tree implemented in phylip v3.695 (Felsenstein 1989) for mtDNA. To gauge the level of population differentiation among collections, arlequin v.3.5.1.2 (Excoffier & Licher 2010) was used to calculate pairwise population Φ ST and F ST, with significance of pairwise differences at the level of 0.05 assessed with 10 000 permutations. As a correction for multiple tests, P‐values were adjusted according to the modified false discovery rate method (Narum 2006). The relationship among all sample collections was visualized by multidimensional scaling (MDS) of pairwise Φ ST and F ST using the MASS (Venables & Ripley 2002) package in the r programming environment (Team RDC, 2005). Spatial analysis of molecular variance (samova 1.0) (Dupanloup et al. 2002) was used to identify distinct groups of populations within which (F SC) genetic variance is minimal and among which (F CT) it is greatest. This method partitions the populations into a specified number of groups, and the partition scheme (k) that maximizes differences between F SC and F CT is selected. The optimum number of groups was determined by running samova with two to eight groups with 100 annealing steps for each run.
Distribution of geographically restricted alleles SAShA – We tested the extent to which haplotypes are randomly distributed in the NA, as implemented in the program SAShA (Kelly et al. 2010). Assuming haplotypes are identical by descent, nonrandom distribution of haplotypes can indicate departures from panmixia and occurrences of the same haplotypes in different locations can be considered evidence of gene flow. SAShA generates observed distribution (OM) of geographic distances among instances of each haplotype which is compared to the null distribution (EM; i.e. allele distribution under panmixia) generated from the same data. An OM significantly less than EM indicates that haplotypes are underdistributed and that gene flow is somewhat restricted. For mtDNA, we tested for significant deviation of the arithmetic mean of OM from EM (Dg) using 1000 nonparametric permutations of the haplotype‐by‐location and haplotype‐by‐depth data set.
Demographic changes
First, Tajima's D T (Tajima 1983) and Fu's Fs (Fu 1997), calculated in DnaSP, were tested to examine deviations of the mitochondrial site frequency spectrum expected under the neutral expansion model for major clades (see Results). Significant and negative D T and Fs values indicate population size changes or directional selection (i.e. selective sweep; Aris‐Brosou & Excoffier 1996). Mismatch distribution analysis was also carried out, as implemented in arlequin, whereby a unimodal frequency distribution of pairwise haplotype differences is expected for populations that have experienced recent demographic expansion, and a multimodal frequency distribution is expected for populations at equilibrium. To estimate the divergence time, we used the formula T = Da/2μ, where 2μ represents a general mtDNA evolutionary rate, commonly assumed to be around 11% per million years for fish mtDNA control region (Patarnello et al. 2007).
To further assess the demographic changes in effective population size since the time of most recent common ancestor (TMRCA) of the identified lineages, Bayesian skyline plots (BSPs) were generated using the software package beast v. 1.8 (Drummond et al. 2012). Analysis was performed using the best fit model of nucleotide substitution (GTR+Γ) implemented using modeltest3.7 (Hasegawa et al. 1985; Posada & Crandall 1998), and a fixed clock was set using 11%/million years (Myr) (Patarnello et al. 2007). For each analysis, the Monte Carlo Markov chain (MCMC) was set at 150 million steps, which yielded effective sample sizes (ESS) of at least 200. Once the appropriate mixing and convergence was met, the first 10% of the posterior was discarded and the remainder combined for parameter inferences. BSPs were estimated in Tracer v. 1.6 (Rambaut et al. 2014) and plotted using the upper 95% highest posterior density.
Marker comparison and approximate Bayesian computation
To gain an exhaustive picture of genetic variation, we also investigated the nuclear intron‐free, gene coding for the rhodopsin pigment, which Shum et al. (2014) reported to also exhibit alternative genotypes associated with depth. Haplotype genealogies for 160 S. mentella rhodopsin sequences were constructed in HapView using a maximum‐likelihood tree generated using PHYLIP. MtDNA haplogroup distributions and rhodopsin genotypic frequencies for the shallow‐ and deep‐caught S. mentella groups were compared using χ2 tests (2 × 2 contingency tables). Furthermore, we re‐examined microsatellite data at 12 loci, previously genotyped by Stefánsson et al. (2009a), for the 118 historical samples from 2006 to 2007 (Stefánsson et al. 2009a), and reanalysed them in combination with the newly generated mtDNA sequences. Population structure was assessed by calculating pairwise genetic differentiation through Slatkin's R ST and Weir & Cockerham's F ST, with 9999 permutations carried out to obtain significance levels, using genaiex 6.501 (Peakall & Smouse 2006). F ST measures genetic differentiation based on allele identity, whereas its analogue R ST is an allele size measure of differentiation that assumes a strictly stepwise‐mutation process. R ST is expected to be larger than F ST if populations have diverged for a sufficiently long time in the case of ancient isolation (Hardy et al. 2003). To visualize the relationship among samples, MDS analysis based on F ST and R ST values was carried out in the r environment, and population structure of individual genotypes was visualized by correspondence analysis (CA) using genetix 4.05 (Belkhir et al. 1996).
We tested concordance of pairwise genetic distances using a simple Mantel test among redfish collections from available areas, based on mtDNA Φ ST/F ST vs. microsatellite F ST. To further illustrate the distribution pattern of horizontal and vertical genetic variation, partial Mantel tests were calculated between matrices of genetic distances (using mtDNA and microsatellite markers) and depth (m) while removing the influence of geographic distance (km), and vice versa, using the vegan (Oksanen et al. 2011) package in r, with statistical significance evaluated with 9999 permutations.
We then used approximate Bayesian computation (ABC), implemented in diyabc v2.0 (Cornuet et al. 2008, 2014), to assess the evolutionary relationships among S. mentella lineages in the North Atlantic. We compared six simple scenarios (see Results), to identify the most likely evolutionary events, and the effective population sizes and times of divergence implicated. The ABC approach is used to provide inference about the posterior distribution of the model parameters in order to establish how the summary statistics compare between simulated and observed data sets (Cornuet et al. 2008). We used default priors and generated simulated data sets combining both mtDNA and microsatellite information, with a total of 28 summary statistics, the calculation of which is implemented in diyabc; for microsatellites: mean number of alleles, genic diversity, size variance and Garza & Williamson's M‐ratio per population and F ST pairwise divergence; for mtDNA: F ST pairwise divergence only. Additional summary statistics generated for mtDNA failed to provide satisfactory statistical fit between the observed and simulated data sets (data not shown). Runs consisted of six million simulated data sets (1 000 000 million for each scenario) and were evaluated by principal components analysis (PCA), based on the obtained summary statistics of a subset of simulations, to check the threshold distance of parameter estimates between simulated and observed data. The relative posterior probability was then estimated over each scenario via a logistic regression on 1% of simulated data sets closest to the observed data set. The posterior distribution of parameters for the summary statistics associated with the retained data set was then estimated through locally weighted linear regression.
Results
Mitochondrial DNA lineages
MtDNA sequence data of 261 Sebastes mentella individuals from 16 collections stretching across the North Atlantic produced a 444‐bp fragment alignment with a total of 44 polymorphic sites, 25 of which were parsimony informative (Accession nos: KP988027–KP988288). These polymorphisms defined 56 haplotypes with overall haplotype diversity and mean nucleotide diversity of h = 0.897 ± 0.009 and π = 0.005 ± 0.0002, respectively (Table 1). The haplotypes were organized into two main divergent haplogroups differentiated by a mean net sequence divergence percentage (D a) of 2.45 ± 0.47 (Fig. 2a). These haplogroups ‘clade A’ and ‘clade B’ correspond to the ‘shallow’ and ‘deep’ groups previously described by Shum et al. (2014; and Fig. S1, Supporting information).
Figure 2.
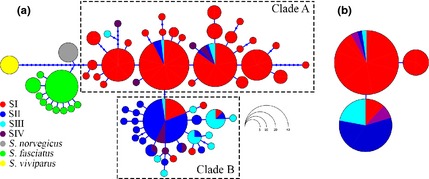
Haplotype genealogy of North Atlantic Sebastes sequences yielded using HaplotypeViewer, using maximum likelihood. (a) 68 mitochondrial control region Sebastes mentella haplotypes are ordered into clade A and clade B (See Table 3); (b) three rhodopsin haplotypes ordered as shallow and deep groups. Haplotypes are coloured according to samova groupings, and the size of each circle is proportional to the frequency of haplotypes. The lengths of the connecting lines reflect the number of mutations between them.
Among all samples, 91.7% of redfish caught above 500 m (59.5%) were classified as clade A and 8.3% as clade B haplotypes, whereas among redfish caught below 500 m (40.5%), 34% belonged to clade A and 66% to clade B haplotypes. Clade A included 68.3% of the total haplotypes found in 16 collections with 12 shared haplotypes (43%) and 16 singletons (57%). Clade B haplotypes (31.7%) formed a far more circumscribed starburst pattern, with haplotypes all found in eight of the 16 locations with six shared haplotypes (21.1%) and 22 singletons (79%), suggestive of a recent expansion. The clades generally show an association with both location (χ2 = 180.75, P < 0.0001, df = 15) and depth (χ2 = 61.76, P < 0.0001, df = 1), with only a few examples of shared haplotypes between adjacent groups (Fig. 2a). Within the Irminger Sea, clade A haplotypes dominated waters above 500 m (75%) in the northeast, west and southwest, while clade B was prevalent at depths below 500 m (90%) in the northeast and west (Fig. 1).
Overall, estimates of genetic differentiation for all comparisons involving the northeast Irminger Sea, west Faroe and Norwegian Sea samples were significant (Φ ST = 0.055–0.423 and F ST = 0.100–0.635), while the remaining samples show no significant genetic structure and low heterogeneity (Table 2). The MDS plot (Fig. 3a, b) based on mtDNA (Φ ST & F ST) pairwise genetic distances shows consistent subdivision of the shallow‐pelagic clade A from the deep‐pelagic clade B groups along axis 1. Axis 2 shows a separation between the deep‐pelagic west Faroe from the NE Irminger Sea groups (>500 m).
Table 2.
mtDNA estimates of pairwise genetic differentiation among 16 Sebastes mentella collections
| Irminger Sea | Faroe west | Faroe east | NS | NIW | ||||||||||||
|---|---|---|---|---|---|---|---|---|---|---|---|---|---|---|---|---|
| SWDP13 | SWSP13 | SWSP06 | WSP13 | WDP13 | WINT13 | NEDP13 | NESP13 | NEDP06 | FW1DP07 | FW2DP07 | FE1SP07 | FE2SP07 | NSSP07 | NIW1SP06 | NIW2SP06 | |
| SWDP13 | — | 0.033 | −0.040 | −0.033 | 0.025 | 0.029 | 0.530 *** | 0.178 | 0.615 *** | 0.333 ** | 0.362 *** | 0.001 | 0.038 | 0.080 | 0.013 | −0.077 |
| SWSP13 | 0.033 | — | −0.003 | −0.011 | 0.052 | 0.043 | 0.517 *** | 0.219 *** | 0.560 *** | 0.406 *** | 0.408 *** | 0.055 | 0.027 | 0.139 | −0.030 | 0.008 |
| SWSP06 | −0.007 | −0.020 | — | −0.030 | 0.040 | 0.027 | 0.515 *** | 0.213 *** | 0.566 *** | 0.383 *** | 0.394 *** | 0.037 | 0.017 | 0.116 | −0.014 | −0.032 |
| WSP13 | −0.008 | −0.024 | −0.029 | — | 0.022 | 0.011 | 0.474 *** | 0.173 ** | 0.524 *** | 0.329 *** | 0.340 *** | 0.013 | 0.015 | 0.097 | −0.024 | −0.033 |
| WDP13 | −0.010 | 0.019 | 0.001 | −0.001 | — | −0.039 | 0.302 *** | 0.035 | 0.345 *** | 0.179 ** | 0.187 ** | 0.011 | 0.039 | 0.092 | 0.022 | 0.015 |
| WINT13 | 0.006 | 0.005 | −0.011 | −0.010 | −0.035 | — | 0.354 *** | 0.049 | 0.409 *** | 0.202 ** | 0.210 ** | −0.012 | 0.057 | 0.134 | 0.006 | 0.007 |
| NEDP13 | 0.179 ** | 0.159 *** | 0.161 *** | 0.156 *** | 0.066 | 0.069 | — | 0.111 | 0.001 | 0.160 ** | 0.146 ** | 0.429 *** | 0.538 *** | 0.529 *** | 0.529 *** | 0.517 *** |
| NESP13 | 0.106 | 0.049 | 0.055 | 0.053 | 0.015 | −0.003 | 0.025 | — | 0.134 | 0.064 | 0.076 | 0.096 | 0.167 | 0.198 | 0.157 | 0.172 |
| NEDP06 | 0.304 *** | 0.250 *** | 0.257 *** | 0.254 *** | 0.143 ** | 0.152 ** | 0.003 | 0.082 | — | 0.203 ** | 0.192 *** | 0.494 *** | 0.635 *** | 0.628 *** | 0.608 *** | 0.599 *** |
| FW1DP07 | 0.112 | 0.074 | 0.077 | 0.073 | 0.061 | 0.048 | 0.118 | 0.028 | 0.209 ** | — | −0.080 | 0.214 ** | 0.437 *** | 0.456 *** | 0.371 *** | 0.346 *** |
| FW2DP07 | 0.074 | 0.058 | 0.058 | 0.053 | 0.062 | 0.055 | 0.154 ** | 0.057 | 0.260 *** | −0.049 | — | 0.230 ** | 0.445 *** | 0.464 *** | 0.379 *** | 0.363 *** |
| FE1SP07 | −0.049 | 0.024 | 0.012 | −0.001 | 0.018 | 0.032 | 0.181 ** | 0.100 | 0.302 *** | 0.079 | 0.041 | — | 0.073 | 0.133 | −0.020 | −0.020 |
| FE2SP07 | 0.004 | 0.032 | 0.020 | 0.016 | 0.056 | 0.075 | 0.243 *** | 0.164 ** | 0.369 *** | 0.188 ** | 0.137 | −0.029 | — | −0.014 | 0.005 | 0.004 |
| NSSP07 | 0.048 | 0.145 ** | 0.136 ** | 0.123 | 0.136 ** | 0.182 ** | 0.298 *** | 0.265 *** | 0.423 *** | 0.279 ** | 0.216 ** | 0.010 | −0.017 | — | 0.128 | 0.071 |
| NIW1SP06 | 0.054 | −0.023 | −0.019 | −0.017 | 0.035 | 0.021 | 0.195 *** | 0.067 | 0.313 *** | 0.102 | 0.076 | 0.007 | −0.016 | 0.145 | — | −0.034 |
| NIW2SP06 | −0.083 | 0.010 | −0.017 | −0.024 | −0.005 | 0.002 | 0.188 *** | 0.108 ** | 0.309 *** | 0.121 ** | 0.082 | −0.049 | −0.047 | 0.031 | 0.010 | — |
Φ ST below diagonal and F ST above diagonal at 0.05 P‐value significance following false discovery rate (FDR) correction. <0.05 Bold; **<0.01; ***<0.001.
Figure 3.
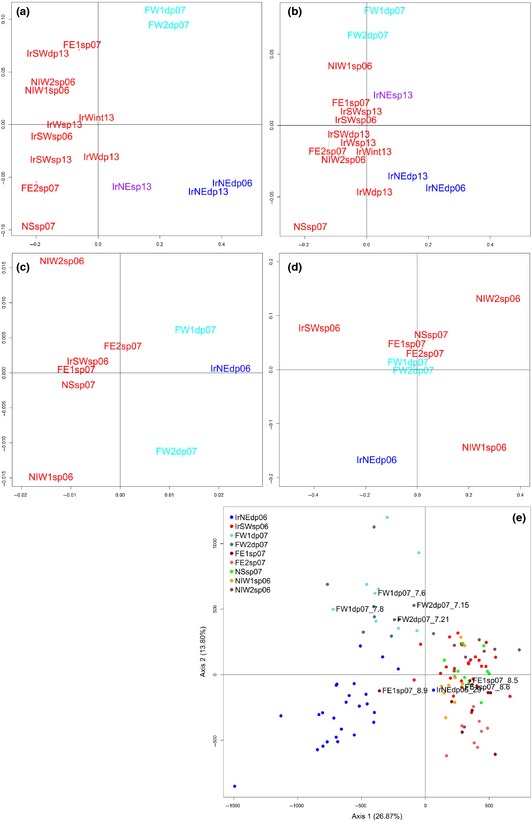
Multidimensional scaling plot (MDS) of Sebastes mtDNA variation from 16 collections (a) FST, (b) Φ ST; microsatellite variation from nine collections (c) FST and (d) RST pairwise genetic distances across the North Atlantic (Location codes (see Table 1) coloured according to samova groupings); (e) correspondence analyses of Sebastes mentella individuals from nine locations, based on microsatellite genotypes. Labelled genotypes showed discordance with mtDNA lineage assignment (see Table S2, Supporting information for further details).
The results of samova indicated significant population genetic structure for each number of k groups assumed. F CT in the samova analysis showed increasing values of k up to 4 and began to progressively decline after that, while F SC drops significantly at k = 4, which resulted in the maximum variance between the two indices at this point. Further increases in the number of k led to a dissolution in group structure, where groups with the larger proportion of private haplotypes were singled out. Thus, we chose four subpopulations as the most parsimonious partition scheme (Fig. 4). At k = 2, samova recovered a deep mitochondrial split between the combined ‘deep‐pelagic’ groups from northeast Irminger Sea (>500 m) and west Faroe Island and everything else. At k = 3, the northeast Irminger Sea (>500 m) group and the west Faroe group became separated. At k = 4, redfish from the majority of clade A caught above 500 m depth formed subpopulation SI (see Table 3), the northeast Irminger Sea and west Faroe groups (deeper than 500 m), representing the core of clade B, formed subpopulation SII and SIII, respectively; finally, some redfish from the northeast Irminger Sea (<500 m; n = 11, clade A: 45%, clade B: 55%) formed subpopulation SIV. A hierarchical amova showed the molecular variance attributed to variance among groups to account for 37.54% (F CT = 0.375, P < 0.001), while differentiation between collections within the same group (F SC) was found not to be significant (F SC = 0.013, P = 0.123).
Figure 4.
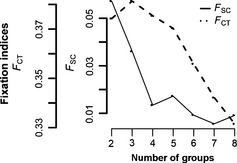
Spatial analysis of molecular variance. Fixation indices obtained for eight different aggregations of samples tested using samova. Y‐axis shows FCT and FSC fixation indices, and x‐axis shows number of groups (k). FCT: variation among groups of populations and FSC, variation among populations within groups.
Table 3.
Analysis of molecular variance for samova groupings for Sebastes mentella from 16 localities in the North Atlantic
| Groups | Group names | Group index | ||||
|---|---|---|---|---|---|---|
| Tajima's D | Fu's Fs | Source of variation | Percentage of variation | Fixation indices | ||
| IrWInt13 + IrWDP13 + IrWSP13 + IrSWDP13 + IrSWSP13 + IrSWSP06 + FE1SP07 + FE2SP07 + NSSP07NIW1SP06 + NIW2SP06 | SI | −1.82 ** | −22.62 *** | Among groups | 37.54 | F CT = 0.375 *** |
| IrNEDP06 + IrNEDP13 | SII | −2.02 ** | −16.45 *** | Among populations within groups | 0.84 | F SC = 0.013 *** |
| FW1DP07 + FW2DP07 | SIII | −0.47 | −5.17 ** | Within populations | 61.62 | F ST = 0.383 *** |
| IrNESP13 | SIV | 1.43 | 2.47 | |||
<0.05 Bold; **<0.01; ***<0.001
The analysis using SAShA revealed the average distance between co‐occurring haplotypes was 951.9 km (geographic distance) and 178.3 m (depth), with evidence that haplotypes were geographically restricted as the observed distribution (OM) was significantly different from the expected (EM) under the assumption of panmixia for geographic distance (Dg = 80, P = 0.018) and depth (Dg = 11.6, P = 0.039).
Demographic analysis on a significantly expanded data set showed similar results to Shum et al. (2014): unimodal distributions with negative and significant Tajima's D and Fu's F values for clade A (D = −1.67, P < 0.01; F = −20.57, P < 0.001) and clade B (D = −2.14, P < 0.001; F = −27.09, P < 0.001), providing support for recent population expansion (Fig. S2, Supporting information). We find that the ‘deep’ and ‘shallow’ lineages split around 22 000 years ago. The coalescent‐based Bayesian skyline plot (BSP) provided details on how mtDNA diversity changed through time, indicating a rapid population growth for clade A in the past 10–12 kyr before present (BP), with a very recent stall/reduction in effective population size (Fig. 5a). Clade B haplotypes demonstrate a signal of a sustained period of population increase dating back over 15–25 kry BP (Fig. 5b).
Figure 5.
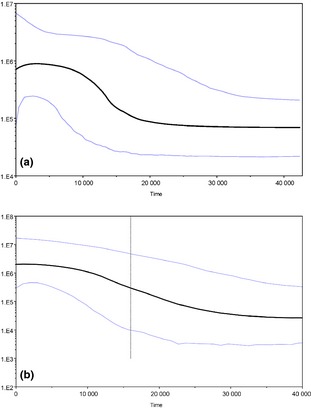
Bayesian skyline plots (BSPs) showing the temporal changes in mtDNA diversity. The x‐axis is in years and y‐axis shows the genetic diversity expressed as the product of effective female population size. (a) Clade A, (b) clade B.
Comparative nuclear and mitochondrial data
Rhodopsin sequence data from 160 S. mentella individuals (Accession nos: KR818563–KR818700) produced a 722‐bp fragment alignment with a total of two polymorphic sites at positions 208 and 228. These polymorphic sites defined three haplotypes structured into well‐defined shallow and deep rhodopsin clades (Fig. 2b). The single nucleotide polymorphism (SNP) T228 was only variable among the ‘shallow’ group; however, one SNP found at position 208 was fixed for alternative alleles between shallow (G) and deep (A) fish, corroborating Shum et al.'s (2014) initial findings. The distribution of the SNP genotypes at position 208 shows a strong association with mtDNA clade A and clade B haplogroups for the shallow (χ2 = 675.17, P < 0.0001) and deep (χ2 = 37.28, P < 0.0001) collections, respectively, with 91% of shallow ‘G’ rhodopsin variants also belonging to mtDNA clade A, and 64% of deep ‘A’ rhodopsin genotypes being assigned to mtDNA clade B.
Microsatellite pairwise F ST values between the nine geographically defined regions ranged from −0.003 to 0.040 (Table S1, Supporting information) and were significant for most combinations that included the Irminger Sea (>500 m) and Norwegian international water collections, after FDR adjustments. Overall, 13 of the 36 pairwise comparisons among historical samples resulted in a significant phylogeographic signal (R ST significantly larger than F ST, see Table S1, Supporting information, Fig. 3c, d).
The correspondence analysis clearly segregated redfish into three main groups. Axis 1 separated the ‘deep‐pelagic’ clade B groups (IrNEDP06 & FW1DP07/FW2DP07) from ‘shallow‐pelagic’ clade A groups (IrSWSP06, FE1SP07/FE2SP07, NSSP07 & NIW1SP06/NIW2SP06), and Axis 2 separated the west Faroe (FW1DP07/FW2DP07) from the east Faroe (FE2SP07) and northeast Irminger Sea (>500 m: IrNEDP06) groups (Fig. 3e).
North Atlantic structuring of redfish based on microsatellite markers and results from mtDNA (samova) consistently divided the ‘deep‐pelagic’ groups [Irminger Sea (>500 m) & west Faroe] into two subgroups. We found concordance between pairwise genetic distances among redfish in nine localities based on mitochondrial Φ ST/F ST vs. microsatellite F ST, showing a significant positive correlation of the measures of genetic differentiation (Fig. S3, Supporting information, tested with 9999 permutations). We found no significant signal of isolation by distance (r = 0.12, P = 0.24) or depth (r = 0.12, P = 0.25) based on microsatellite F ST, using a partial Mantel test where the depth/geographic distance matrix was held constant. For mtDNA, partial Mantel tests showed a significant correlation between genetic distance (F ST) and depth (r = 0.329, P = 0.019), but not for geographic distance (r = 0.009, P = 0.407).
Given the detection of geographically disjunct ‘deep’ populations in both the Irminger and Faroese seas, we tested six simple historical demographic scenarios involving pairs of ‘shallow’ and ‘deep’ populations from these areas (bearing in mind the relatively consistent homogeneity on the ‘shallow’ populations all across the NA, Figs 3 and 6). The first scenario involved an original split between the ‘deep’ and ‘shallow’ lineages followed by subsequent split between the Irminger and Faroe seas within both deep and shallow lineages, leading to the current geographical disjunction. The second scenario involved a parallel, independent origin of deep sea groups from their shallow ancestors, respectively, in the Irminger and Faroese seas. The third differed from the second scenario with an independent origin of the shallow groups from their deep sea ancestors. The fourth, fifth and sixth scenarios involved a simplistic treelike bifurcations occurring from time ta to t1 in the past. Estimations of the posterior probability based on both direct and logistic regression for each scenario provided unambiguous support for the scenario S1, with a probability of 91% and a 95% CI of 90–92, not overlapping with any other scenarios (Fig. 6). Given a generation time between 12 and 20 years (Stransky et al. 2005a,b), the scenario assumes that the ‘deep‐pelagic’ and ‘shallow‐pelagic’ redfish split ~4500–7500 years ago (ta median = 374 generations, 95% CI: 93.4–419). The subsequent split between the ‘deep‐pelagic’ Irminger Sea (IrNEDP06: N e = 8570, 95% CI: 5840–9900) and west Faroe (FWDP06: N e = 7040, 95% CI: 3160–9800) shares similar divergence times as the split between the ‘shallow‐pelagic’ Irminger Sea (IrSWSP06: N e = 6610, 95% CI: 3310–9640) and east Faroe (FESP06: N e = 5570, 95% CI: 2020–9510), estimated at approximately ~1200–2000 years ago (t1 median = 98.3 generations, 95% CI: 27.9–281).
Figure 6.
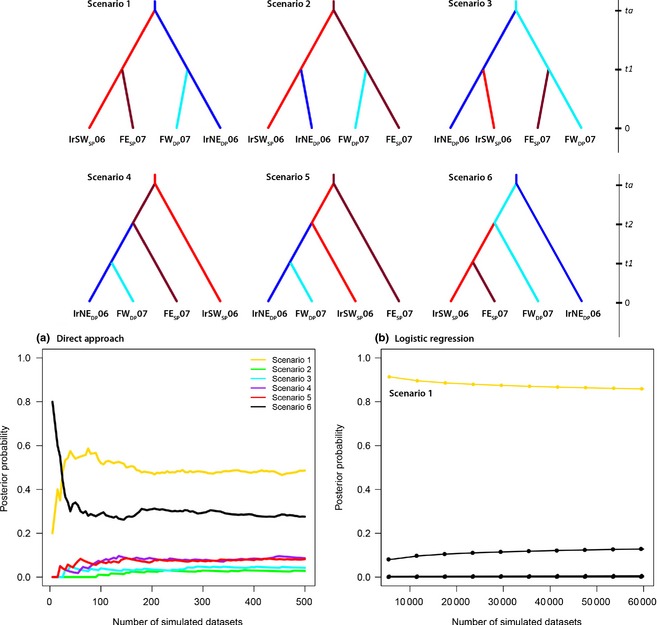
Alternative scenarios tested using an approximate Bayesian computation approach (DIYABC) based on combined microsatellite and mtDNA data for Sebastes mentella. The top section illustrates the six scenarios tested, while the bottom panels indicate the relative likelihoods of the six scenarios compared by (a) direct approach and (b) logistic regression on the 1% (60 000) and 0.008% (500) of the closest simulated data sets, respectively. On the y‐axis, the posterior probabilities, and on the x‐axis, the number of simulations used to calculate it (1% of total simulations). The DIYABC analysis illustrates scenario 1 as best‐supported. See Table 1 for corresponding location codes.
Discussion
Based on greatly expanded geographical screening, sample sizes and analytical toolkit, this study lends strong support to the existence of at least two highly distinct evolutionary units of oceanic Sebastes mentella in the North Atlantic (NA). Nuclear patterns are mirrored and strengthened by mitochondrial evidence, and, perhaps more strikingly, the pattern of divergence is strongly associated with habitat depth (more so than with geographical distance). Coalescent patterns suggest that the emergence of depth‐related structure may have originated in the Late Pleistocene, with the two lineages segregating after the recolonization of the Irminger Sea, as the ice sheets retreated at the end of the last glaciation.
Population structure and connectivity
Analyses of mtDNA sequences revealed substantial population structure among depth‐defined habitats between two distinct S. mentella mtDNA clades (A: above and B: below 500 m; Figs 1 and 2). Our results expand on recent findings, indicating that the ‘shallow’ and ‘deep’ groups in Shum et al. (2014) correspond to clades A and B identified in this study (Fig. S1, Supporting information). We found nonrandom association of haplotypes in the NA, with clade A commonly found above 500 m southwest and west of the Irminger Sea, east of the Faroes, and Norwegian waters, whereas clade B haplotypes are more localized to the central NA, below 500 m, northeast of the Irminger Sea and west of the Faroes (Fig. 1). The overall pattern of mtDNA variation is associated with isolation by depth, mirrored by rhodopsin SNP distribution, similarly detected using microsatellites (Stefánsson et al. 2009a) and to some degree also supported by subtle phenotypic variation (Magnússon & Magnússon 1995; Stransky 2005; Stefánsson et al. 2009a,b; Cadrin et al. 2010). MtDNA and nuclear data consistently identified the main genetic partitioning – shallow vs. deep – as well as detecting additional population subdivision, between the ‘deep‐pelagic’ Irminger Sea and west Faroe groups. According to the samova and MDS analysis, redfish was further divided into four genetically distinct subclades: (SI) southwest and west Irminger Sea/east Faroe/Norwegian shelf and Norwegian international waters; (SII) northeast Irminger Sea (>500 m); (SIII) west Faroe; and (SIV) northeast Irminger Sea (<500 m). However, it is worth mentioning the potential issue of small sample size for some collections as is the case of the final samova group (SIV), which probably represents an area of contact between haplogroups and may not reflect a ‘true’ distinct biological unit but a mere artefact due to low sample size. Support for this group structure is mirrored by close inspection at nuclear markers. The rhodopsin SNP shows a strong association with the mtDNA clade A and clade B haplotypes, suggesting that evolutionary independence between shallow and deep lineages is unambiguous. The two deep‐pelagic groups were not statistically distinguishable at microsatellite loci, even using greater sample sizes (Stefánsson et al. 2009a). Yet, analysed at mtDNA, they showed significant genetic structure (Figs 2a and 3). Strikingly, while the average mtDNA‐based F ST variance among ‘shallow’ aggregations is nonsignificant (F ST = 0.020, P = 0.074), suggesting significant large‐scale connectivity, the two ‘deep’ groups, in the Irminger Sea and western Faroes, appear significantly differentiated (F ST = 0.176, P > 0.001), with only three haplotypes shared, indicating that habitat segregation may have shaped diverging behaviours and life history adaptations in these two lineages. Such a segregation of the mitochondrial matrilineage, between deep Irminger and Faroese fish, alongside a more blurred boundary showed by microsatellites, raises the possibility that female S. mentella in the deeper sea layer may exhibit some degree of female philopatry/residency (Petit & Excoffier 2009). The combined use of mitochondrial and nuclear information on a few selected individuals can also shed some further light on the biology and behaviour of these organisms. For example, one fish caught above 500 m from east of the Faroes (FE1SP07_8.9) exhibits a clade B haplotype, typical of the ‘deep’ layer, and its microsatellite genotype falls within the ‘deep’ group. This highlights the ability of redfish to exhibit a degree of pelagic–demersal mixing between clades from shallow and deep environments (Planque et al. 2013). Most notably, four individuals from the 2013 Irminger Sea ‘deep’ sampling (I.D. 17, 30, 37 and 40) exhibited fully shallow mtDNA and rhodopsin types (Table S2, Supporting information), which suggests that ‘shallow‐to‐deep’ contemporary forays might be more common than those in the opposite direction. The inception of this behaviour may originate during the establishment of juvenile ‘site fidelity’ during the early stages of redfish development. In the Irminger and Norwegian seas, spawning female redfish are distributed along the larval extrusion areas of the Reykjanes Ridge and the Norwegian continental shelf between March and May (Magnússon & Magnússon 1995; Drevetnyak & Nedreaas 2009). The pelagic‐fry drift to nursery areas found along the coast of east/west of Greenland and the Barents Sea where juveniles settle to the bottom until they mature and migrate to distributed populations throughout the North Atlantic. Yet, the complex behaviour, areas of copulation and seasonal migration patterns of this species across shallow‐ and deep‐pelagic habitats remain poorly understood (Planque et al. 2013). Hence, this pattern suggests the occurrence of short‐time migration from deep‐pelagic individuals, supporting the notion of vagrants as individuals move to shallow and deeper waters during their life cycle (Shum et al. 2014).
Several examples from the east/west Faroe groups caught in both shallow and deep layers display discordant molecular markers: two samples (FE1sp07_8.5 & FE1sp07_8.6) caught approximately at 400 m display ‘deep’ haplotypes but a microsatellite genotype typical of the shallow layer. Similarly, five samples caught in deep waters (FW1dp07_7.6, FW1dp07_7.8, FW2dp07_7.15, FW2dp07_7.21 & IrNEdp06_29) exhibited clade A haplotypes but possess multilocus microsatellite genotypes falling within the ‘deep’ group. The nuclear‐coding rhodopsin gene is a powerful tool in the identification of closely related fish species (Rehbein 2013; Pampoulie et al. 2015), and here, we found that only seven of 160 specimens (4%) analysed at both mtDNA and rhodopsin yielded ambiguous assignment to their lineage of origin (Table S2, Supporting information). Interestingly, two of these individuals possessed double peaks, or heterozygous indels, in the rhodopsin chromatograms (Fig. S4, Supporting information; Sousa‐Santos et al. 2005), which, along with the observed mtDNA/microsatellite mismatches, is best explained by the occasional occurrence of introgressive hybridization between the two genetically distinguishable groups. Roques et al. (2002) indicated significant introgressive hybridization between S. mentella and Sebastes fasciatus in the Gulf of St. Lawrence and surrounding waters; Pampoulie and Daníelsdóttir (2008) also detected signatures of hybridization between S. mentella and Sebastes norvegicus. Thus, it is reasonable to expect that intraspecific mating between a deep‐pelagic clade B male and shallow‐pelagic clade A females (and vice versa) would have produced the genotypic ambiguities mentioned above. The shallow‐ and deep‐pelagic groups appear to occupy their preferential depth range in near sympatry. However, spatial overlap is more apparent to the west and northeast of the Irminger Sea and in the Faroese waters; thus, the opportunity for introgressive hybridization may derive from hybrid zones as a result of secondary contact where S. mentella are within their preferred geographic and vertical cruising limits. Pampoulie & Daníelsdóttir (2008) have reported significant levels of hybridization in the NA among redfish which may indicate that different S. mentella lineages were allopatric before secondarily coming into contact to form their current sympatric distribution (Cadrin et al. 2010). Despite the potential for interbreeding, however, the shallow and deep types maintain a striking overall integrity, which bears resemblance to some notable cases of parapatric speciation (Allender et al. 2003; Berner et al. 2009; Nosil 2012).
Historical reconstruction
The glaciation and interglacial periods of the Pleistocene have been known to considerably shape the current distribution and connectivity among contemporary populations (Bigg et al. 2008; Finnegan et al. 2013). Evidence from mtDNA haplotypes alone suggests that the shallow‐ and deep‐pelagic clades diverged over 22 000 years ago, in correspondence with the last glacial maximum (LGM). The Bayesian skyline plot (BSP) provides information on how mtDNA diversity changed through time, back to the most recent common ancestor. The BSP analysis indicate a gradual signature of expansion 15 000–25 000 years ago for the deep‐pelagic clade, and a greater, steady increase in population growth – compared to the shallow‐pelagic clade – which shows a much sharper rapid expansion around 10 000–15 000 years ago. The BSPs show contrasting signatures of population growth suggestive of postglacial influence. The expanding sea ice may have driven S. mentella to southerly latitudes as far as the Grand Banks to deeper waters during the LGM, as global sea level fell by 120–135 m and intense calving in the northern hemisphere ice sheets 18–15 kyr BP resulted in massive icebergs advancing into the North Atlantic 40°N (Grousset et al. 1993). As the sea ice retreated, characterized by intense warming and rising sea levels 14 600–13 800 years BP, S. mentella had the opportunity to advance in a northerly direction to glacial refugia south of Iceland before sea ice readvanced during the Younger Dryas (YD, 13–11kyrBP) which forced the Northern Hemisphere into near‐glacial conditions (Crucifix & Berger 2002). The onset of the YD may have favoured allopatric conditions between the two clades as the deep‐pelagic group occupied deeper refuges, while the shallow‐pelagic rapidly spread with the retreating sea ice and rising sea level following the YD into the Norwegian and Barents seas and the Irminger Sea (R ST > F ST; Table S1, Supporting information). The microsatellite R ST values provide insights on the relative divergence of S. mentella. The eastern NA collections (FESP07, NSSP06 & NIWSP06) present a significant phylogeographic signal with respect to the Irminger Sea collections (IrSWSP06 & IrNEDP06), suggesting that post‐glacial range shifts and secondary contact events have played a significant role in shaping S. mentella spatial structure.
Overall, samova, MDS and CA analyses revealed the shallow‐pelagic group shows strong homogeneity across the NA, whereas the deep‐pelagic groups form rather distinct ‘pockets’, suggesting their evolutionary distinction also involves different life histories, as shallow‐pelagic redfish appear more prone to connectivity, whereas the deep‐pelagic redfish appear to be more strictly associated with their local habitats, probably migrating less. We tested which demographic scenario could best explain the genetic patterns among pelagic pairs of shallow and deep populations in the Irminger Sea and west of the Faroes, using an ABC approach. Estimates for the posterior probability for each scenario provided robust support for scenario 1 (Fig. 6). This indicates that the shallow‐ and deep‐pelagic gene pools split approximately 5–7 kyr BP, after the postglacial recolonization of the Irminger Sea. Furthermore, a subsequent split between the deep‐pelagic groups emerged approximately 2 kyr BP. Their distributions are found within close proximity of bathymetric features (see Fig. 1) along the west of the Reykjanes Ridge and the Faroe‐Shetland Ridge known for complex oceanic conditions at depth (Pedchenko 2005; Olsen et al. 2008). This may act as bathymetric forcing of ocean currents as reported for North Atlantic tusk (Knutsen et al. 2009). The combination of these physical obstacles and the presumably complex and largely unexplored reproductive behaviour of S. mentella may have acted in concert initiating the retention and establishment of reproductive isolation by depth (Shum et al. 2014).
Conclusions
Our study provided the first extensive depth‐associated sampling and phylogeographic reconstruction of the North Atlantic oceanic beaked redfish, Sebastes mentella. This species shows a consistent and significant distinction of at least two evolutionary lineages: one widely distributed ‘shallow’ type, which partially overlaps with local populations of a more sedentary ‘deep’ type. While evidence exists for localized interbreeding between these two lineages, the rate does not appear notably greater than similar introgressive processes still occurring among the four Sebastes species in the North Atlantic. We find that mtDNA reflects redfish evolutionary history throughout the Late Pleistocene, whereas the integration with microsatellite data serves to better reflect postglacial divergence and the patterns of contemporary gene flow among populations, including the potential detection of sex‐biased dispersal. The shallow‐pelagic clade shows strong homogeneity across the NA, while the deep‐pelagic clade is restricted to the central North Atlantic, segregated by complex oceanic conditions shaped by bathymetric features. Population independence was largely upheld by both nuclear and mitochondrial markers, and it is likely that depth‐associated adaptive processes are at play (Shum et al. 2014) to counteract the homogenizing effects of gene flow. Given the paucity of well‐characterized marine biological systems undergoing diversification processes consistent with speciation, North Atlantic S. mentella should now represent a valuable subject to investigate genomic correlates and mechanisms for the maintenance of bathymetry‐associated lineage sorting and, potentially, speciation.
From a practical standpoint, the present results will have cascading impacts on the assessment and management of these commercially valuable fish stocks, which remain hotly debated. Our results are consistent with two genetically distinguishable putative groups separated by depth and following different evolutionary trajectories: this should form the basis to recognize them as distinct evolutionarily significant units. Given the circumscribed local distribution of the ‘deep’ populations in the Irminger and western Faroese seas, tailored management appears required, if we are to avert the permanent loss of a unique biodiversity component.
S.M. and C.P. conceived the study, with contribution from P.S.; C.P. and K.K. organized the sampling, which was carried out by P.S. and K.K.; P.S. conducted all laboratory work and statistical analyses and drafted the manuscript. S.M. contributed to writing and advised on statistics, with feedback from C.P. and K.K. All authors share interests in the mechanisms of population divergence in open marine habitats and their implications for biodiversity conservation and resource management.
Data accessibility
Sequence data for this study are available via GenBank (Accession nos mtDNA: KP988027–KP988288; rhodopsin KR818563–KR818700). Microsatellite genotypes, mitochondrial DNA and rhodopsin sequences are also available via Dryad (http://dx.doi.org/10.5061/dryad.v80q9).
Supporting information
Table S1 Microsatellite estimates of pairwise genetic differentiation among nine S. mentella collections.
Table S2 Genetic marker discordance among S. mentella samples for mitochondrial control region (mtDNA clades), rhodopsin SNPs and microsatellite genotype.
Table S3 Pairwise F ST genetic differentiation among nine S. mentella collections. mtDNA (below diagonal) and microsatellite (above diagonal) based on 10 000 permutations.
Fig. S1 Haplotype genealogies indicating shallow‐ (red) and deep‐pelagic (blue) samples from Shum et al. (2014) within the larger mtDNA dataset generated in the present study (See Fig. 2, main article).
Fig. S2 Mismatch distributions for oceanic S. mentella clade A (above) and clade B (below).
Fig. S3 Correlation plots between pairwise genetic distances for S. mentella collections from (a) 16 sampling regions based on mtDNA (Φ ST vs. F ST) and (b) nine sampling regions based on microsatellite and mtDNA F ST. Sampling information is provided in Table 1 (main article).
Fig. S4 Chromatograms showing heterozygous SNP at position 208 of the Rhodopsin gene for (a) IrWInt13_12 and (b) IrWDP13_35.
Acknowledgements
We would like to acknowledge the following who contributed in the collection of biological samples: the crew and scientists on board the Icelandic r/s Árni Friðriksson for the collection of S. mentella during the redfish stock assessment survey in 2013; Kiley Best for S. fasciatus samples collected on board the RV Celtic Explorer by the staff and students of CFER (Center for Fisheries Ecosystems Research) during the offshore research survey in May 2012; Kjell Nedreaas, Þorsteinn Sigurðsson and Jákup Reinert for the collection of S. mentella samples from Norway and the Faroe Islands. We are indebted to Valérie Chosson for her skilled technical and logistic support throughout the 2013 sampling campaign. We also thank Andrew Griffiths, Sara Vandamme, Christoph Stransky and three anonymous reviewers for their useful comments on this manuscript. This work was funded by the Marine Research Institute in Iceland and the University of Salford GTS/PtE programme.
References
- Alesandrini S, Bernardi G (1999) Ancient species flocks and recent speciation events: What can rockfish teach us about cichlids (and vice versa)? Journal of Molecular Evolution, 49, 814–818. [PubMed] [Google Scholar]
- Allender CJ, Seehausen O, Knight ME, Turner GF, Maclean N (2003) Divergent selection during speciation of Lake Malawi cichlid fishes inferred from parallel radiations in nuptial coloration. Proceedings of the National Academy of Sciences of the United States of America, 100, 14074–14079. [DOI] [PMC free article] [PubMed] [Google Scholar]
- Aris‐Brosou S, Excoffier L (1996) The impact of population expansion and mutation rate heterogeneity on DNA sequence polymorphism. Molecular Biology & Evolution, 13, 494–504. [DOI] [PubMed] [Google Scholar]
- Avise JC (2004) Molecular Markers, Natural History, and Evolution, 2nd edn Sinauer Associates, Sunderland, Massachusetts. [Google Scholar]
- Belkhir K, Borsa P, Chikhi L, Raufaste N, Bonhomme F (1996) GENETIX 4.05, Logiciel Sous Windows TM Pour la Génétique des Populations. Laboratoire Génome, Populations, Interactions, CNRS UMR 5171. Université de Montpellier II, Montpellier, France. [Google Scholar]
- Bergstad OA (2013) North Atlantic demersal deep‐water fish distribution and biology: present knowledge and challenges for the future. Journal of fish Biology, 83, 1489–1507. [DOI] [PubMed] [Google Scholar]
- Berner D, Grandchamp A‐C, Hendry AP (2009) Variable progress toward ecological speciation in parapatry: stickleback across eight lake‐stream transitions. Evolution, 63, 1740–1753. [DOI] [PubMed] [Google Scholar]
- Bigg GR, Cunningham CW, Ottersen G, Pogson GH, Wadley MR, Williamson P (2008) Ice‐age survival of Atlantic cod: agreement between palaeoecology models and genetics. Proceedings of the Royal Society B, 275, 163–172. [DOI] [PMC free article] [PubMed] [Google Scholar]
- Blanchon P, Shaw J (1995) Reef drowning during the last deglaciation: Evidence for catastrophic sea‐level rise and ice‐sheet collapse. Geology, 23, 4–8. [Google Scholar]
- Cadrin SX, Bernreuther M, Daníelsdóttir AK et al (2010) Population structure of beaked redfish, Sebastes mentella: evidence of divergence associated with different habitats. ICES Journal of Marine Science, 68, 1617–1630. [Google Scholar]
- Cadrin SX, Mariani S, Pampoulie C et al (2011) Counter‐comment on Cadrin et al. (2010) “Population structure of beaked redfish, Sebastes mentella: evidence of divergence associated with different habitats. ICES Journal of Marine Science, 67:1617–1630. ICES Journal of Marine Science, 68, 2016–2018. [Google Scholar]
- Chen W‐J, Bonillo C, Lecointre G (2003) Repeatability of clades as a criterion of reliability: a case study for molecular phylogeny of Acanthomorpha (Teleostei) with larger number of taxa. Molecular Phylogenetics and Evolution, 26, 262–288. [DOI] [PubMed] [Google Scholar]
- Cornuet J‐M, Santos F, Beaumont M (2008) Inferring population history with DIYABC: a user‐friendly approach to approximate Bayesian computations. Bioinformatics, 24, 2713–2719. [DOI] [PMC free article] [PubMed] [Google Scholar]
- Cornuet J‐M, Pudlo P, Veyssier J et al (2014) DIYABC v2.0: a software to make approximate Bayesian computation inferences about population history using single nucleotide polymorphism. DNA sequence and microsatellite data. Bioinformatics, 30, 1187–1189. [DOI] [PubMed] [Google Scholar]
- Crucifix M, Berger A (2002) Simulation of ocean‐ice sheet interactions during the last deglaciation. Paleoceanography, 17, 1054. [Google Scholar]
- Doebeli M, Dieckmann U (2003) Speciation along environmental gradients. Nature, 421, 259–264. [DOI] [PubMed] [Google Scholar]
- Drevetnyak K, Nedreaas KH (2009) Historical movement pattern of juvenile beaked redfish (Sebastes mentella Travin) in the Barents Sea as inferred from long‐term research survey series. Marine Biology Research, 5, 86–100. [Google Scholar]
- Drummond AJ, Suchard MA, Xie D, Rambaut A (2012) Bayesian phylogenetics with BEAUti and BEAST 1.7. Molecular Biology and Evolution, 29, 1969–1973. [DOI] [PMC free article] [PubMed] [Google Scholar]
- Dupanloup I, Schneider S, Excoffier L (2002) A simulated annealing approach to define the genetic structure of populations. Molecular Ecology, 11, 2571–2581. [DOI] [PubMed] [Google Scholar]
- Edgar RC (2004) MUSCLE: multiple sequence alignment with high accuracy and high throughput. Nucleic Acids Research, 32, 1792–1797. [DOI] [PMC free article] [PubMed] [Google Scholar]
- Engås A, Skeide R, West W (1997) The “MultiSampler”: a system for remotely opening and closing multiple codends on a sampling trawl. Fisheries Research, 29, 285–298. [Google Scholar]
- Excoffier L, Licher HE (2010) Arlequin suite ver3.5: a new series of programs to perform population genetics analyses under Linux and Windows. Molecular Ecology Resources, 10, 564–567. [DOI] [PubMed] [Google Scholar]
- Felsenstein J (1989) PHYLIP – phylogeny inference package (Version 3.2). Cladistics, 5, 164–166. [Google Scholar]
- Finnegan AK, Griffiths AM, King RA et al (2013) Use of multiple markers demonstrate a cryptic western refuge and postglacial colonisation routes of Atlantic salmon (Salmo salar L.) in northwest Europe. Heredity, 111, 1365–2540. [DOI] [PMC free article] [PubMed] [Google Scholar]
- Fu YX (1997) Statistical tests of neutrality of mutations against population growth, hitchhiking and background selection. Genetics, 147, 915–925. [DOI] [PMC free article] [PubMed] [Google Scholar]
- Gaither MR, Toonen RJ, Robertson RR, Planes S, Bowen BW (2010) Genetic evaluation of marine biogeographical barriers: perspectives from two widespread Indo‐Pacific snappers (Lutjanus kasmira and Lutanus fulvus). Journal of Biogeography, 37, 133–147. [Google Scholar]
- Galindo HM, Pfeiffer‐Herbert AS, McManus MA, Chao Y, Chai F, Palumbi SR (2010) Seascape genetics along a steep cline: using genetic patterns to test predictions of marine larval dispersal. Molecular Ecology, 19, 3692–3707. [DOI] [PubMed] [Google Scholar]
- Grousset FE, Labeyrie L, Sinko JA et al (1993) Patterns of ice‐rafted detritus in the glacial north Atlantic (40–55°N). Paleoceanography, 8, 175–192. [Google Scholar]
- Hardy O, Charbonnel N, Freville H, Heuertz M (2003) Microsatellites allele sizes: a simple test to assess their significance on genetic differentiation. Genetics, 163, 1467–1482. [DOI] [PMC free article] [PubMed] [Google Scholar]
- Hare MP, Guenther C, Fagan W (2005) Nonrandom larval dispersal can steepen marine clines. Evolution, 59, 2509–2517. [PubMed] [Google Scholar]
- Hasegawa M, Kishino K, Yano T (1985) Dating the human‐ape splitting by a molecular clock of mitochondrial DNA. Journal of Molecular Evolution, 22, 160–174. [DOI] [PubMed] [Google Scholar]
- Hauser L, Carvalho GR (2008) Paradigm shifts in marine fisheries genetics: ugly hypothesis slain by beautiful facts. Fish and Fisheries, 9, 333–362. [Google Scholar]
- Hemmer‐Hansen J, Nielsen EE, Gronkjaer P, Loeschcke V (2007) Evolutionary mechanisms shaping the genetic population structure of marine fishes; lessons from the European flounder (Platichthys flesus L.). Molecular Ecology, 16, 3104–3118. [DOI] [PubMed] [Google Scholar]
- Hyde J, Vetter RD (2007) The origin, evolution, and diversification of rockfishes of the genus Sebastes (Curvier). Molecular Phylogenetics and Evolution, 44, 790–811. [DOI] [PubMed] [Google Scholar]
- Hyde J, Kimbrell C, Budrick J, Lynn E, Vetter R (2008) Cryptic speciation in the vermilion rockfish (Sebastes miniatus) and the role of bathymetry in the speciation process. Molecular Ecology, 17, 1122–1136. [DOI] [PubMed] [Google Scholar]
- Ingram T (2010) Speciation along a depth gradient in a marine adaptive radiation. Proceedings of the Royal Society B, 278, 613–618. [DOI] [PMC free article] [PubMed] [Google Scholar]
- Irwin DE (2012) Local adaptation along smooth ecological gradients causes phylogeographic breaks and phenotypic clustering. The American Naturalist, 180, 35–49. [DOI] [PubMed] [Google Scholar]
- Jennings R, Etter R, Ficarra L (2013) Population differentiation and species formation in the deep sea: the potential role of environmental gradients and depth. PLoS ONE, 8, e77594. [DOI] [PMC free article] [PubMed] [Google Scholar]
- Kelly RP, Oliver TA, Sivasundar A, Palumbi SR (2010) A method for detecting population genetic structure in diverse, high gene‐flow species. Journal of Heredity, 101, 423–436. [DOI] [PubMed] [Google Scholar]
- Knutsen H, Jorde PE, Sannæs H et al (2009) Bathymetric barriers promoting genetic structure in the deepwater demersal fish tusk (Brosme brosme). Molecular Ecology, 18, 3151–3162. [DOI] [PubMed] [Google Scholar]
- Librado P, Rozas J (2009) DnaSP: a software for comprehensive analysis of DNA polymorphism data. Bioinformatics, 25, 1451–1452. [DOI] [PubMed] [Google Scholar]
- Love MS, Yaklovich M, Thorsteinson L (2002) The Rockfish of the Northeast Pacific. UC Press, Berkeley. [Google Scholar]
- Ludt WB, Rocha LA (2015) Shifting seas: the impacts of Pleistocene sea‐level fluctuations on the evolution of tropical marine taxa. Journal of Biogeography, 42, 25–38. [Google Scholar]
- Magnússon J, Magnússon JV (1995) Oceanic redfish (Sebastes mentella) in the Irminger Sea and adjacent waters. Scientia Marina, 59, 241–254. [Google Scholar]
- Makhrov AA, Artamonova VS, Popov VI, Rolskiy AY, Bakay YI (2011) Comment on: Cadrin et al. (2010) “Population structure of beaked redfish, Sebastes mentella: evidence of divergence associated with different habitats. ICES Journal of Marine Science, 67: 1617–1630”. ICES Journal of Marine Science, 68, 2013–2015. [Google Scholar]
- Miller SA, Dykes DD, Polesky HF (1988) A simple salting out procedure for extracting DNA from human nucleated cells. Nucleic Acids Research, 16, 1215. [DOI] [PMC free article] [PubMed] [Google Scholar]
- Narum SR (2006) Beyond Bonferroni: less conservative analyses for conservation genetics. Conservation Genetics, 7, 783–787. [Google Scholar]
- Nei M (1987) Molecular Evolutionary Genetics. Columbia University Press, New York. [Google Scholar]
- Nei M, Tajima F (1981) DNA polymorphism detectable by restriction endonucleases. Genetics, 97, 145–163. [DOI] [PMC free article] [PubMed] [Google Scholar]
- Nosil P (2012) Ecological Speciation, 1st edn Oxfor University Press, New York. [Google Scholar]
- Oksanen J, Blanchet FG, Kindt R et al (2011) vegan: Community ecology package. R package version 2.0‐2.
- Olsen SM, Hansen B, Quadfasel D, Osterhus S (2008) Observed and modelled stability of overflow across the Greenland‐Scotland ridge. Nature, 455, 519–522. [DOI] [PubMed] [Google Scholar]
- Palumbi S (1994) Genetic divergence, reproductive isolation, and marine speciation. Annual Reviews of Ecology and Systematics, 25, 547–572. [Google Scholar]
- Pampoulie C, Daníelsdóttir AK (2008) Resolving species identification problems in the genus Sebastes using nuclear genetic markers. Fisheries Research, 93, 54–63. [Google Scholar]
- Pampoulie C, Slotte A, Óskarsson GJ et al (2015) Stock structure of Atlantic herring Clupea harengus in the Norwegian Sea and adjacent waters. Marine Ecology Progress Series, 522, 219–230. [Google Scholar]
- Patarnello T, Volckaert F, Castilho R (2007) Pillars of Hercules: is the Atlantic‐Mediterranean transition a phylogeographical break? Molecular Ecology, 16, 4426–4444. [DOI] [PubMed] [Google Scholar]
- Peakall R, Smouse PE (2006) Genalex 6: genetic analysis in Excel. Population genetic software for teaching and research. Molecular Ecology Notes, 6, 288–295. [DOI] [PMC free article] [PubMed] [Google Scholar]
- Pedchenko AP (2005) The role of interannual environmental variations in the geographic range of spawning and feeding concentrations of redfish Sebastes mentella in the Irminger Sea. ICES Journal of Marine Science, 62, 1501–1510. [Google Scholar]
- Petit R, Excoffier L (2009) Gene flow and species delimitation. Trends in Ecology and Evolution, 24, 386–393. [DOI] [PubMed] [Google Scholar]
- Planque B, Kristinsson K, Astakhov A et al (2013) Monitoring beaked redfish (Sebastes mentella) in the North Atlantic, current challenges and future prospects. Aquatic Living Resources, 26, 293–306. [Google Scholar]
- Posada D, Crandall KA (1998) MODELTEST: testing the model of DNA substitution. Bioinformatics, 14, 817–818. [DOI] [PubMed] [Google Scholar]
- Rambaut A, Suchard M, Xie D, Drummond A (2014) Traver v1.6, Available from http://beast.bio.ed.ac.uk/Tracer.
- Raymo ME, Ruddiman WF, Shackleton NJ, Oppo DW (1990) Evolution of Atlantic‐Pacific δ13C gradients over the last 2.5 m.y. Earth and Planetary Science Letters, 97, 353–368. [Google Scholar]
- Rehbein H (2013) Differentiation of fish species by PCR‐based DNA analysis of nuclear genes. European Food Research and Technology, 236, 979–990. [Google Scholar]
- Riginos C, Buckley Y, Blomberg S, Treml E (2014) Dispersal capacity predicts both population genetic structure and species richness in reef fishes. The American Naturalist, 184, 52–64. [DOI] [PubMed] [Google Scholar]
- Roques S, Sevigny J‐M, Bernatchez L (2002) Genetic structure of deep‐water, Sebastes mentella, populations across the North Atlantic. Marine Biology, 140, 297–307. [Google Scholar]
- Roy D, Hurlbut TR, Ruzzante DE (2012) Biocomplexity in a demersal exploited fish, white hake (Urophycis tenuis): depth‐related structure and inadequacy of current management approaches. Canadian Journal of Fisheries and Aquatic Sciences, 69, 415–429. [Google Scholar]
- Sala‐Bozano M, Ketmaier V, Mariani S (2009) Contrasting signals from multiple markers illuminate population connectivity in a marine fish. Molecular Ecology, 18, 4811–4826. [DOI] [PubMed] [Google Scholar]
- Salzburger W, Ewing GB, Haeseler A (2011) The performance of phylogenetic algorithms in estimating haplotype genealogies with migration. Molecular Ecology, 20, 1952–1963. [DOI] [PubMed] [Google Scholar]
- Selkoe KA, Toonen RJ (2011) Marine connectivity: a new look at pelagic larval duration and genetic metrics of dispersal. Marine Ecology Progress Series, 436, 291–305. [Google Scholar]
- Shum P, Pampoulie C, Sacchi C, Mariani S (2014) Divergence by depth in an oceanic fish. PeerJ, 2, e525. [DOI] [PMC free article] [PubMed] [Google Scholar]
- Silva G, Horne JB, Castilho R (2014) Anchovies go north and west without losing diversity: post‐glacial range expansions in a small pelagic fish. Journal of Biogeography, 41, 1171–1182. [Google Scholar]
- Sivasundar A, Palumbi S (2010) Parallel amino acid replacements in the rhodopsin of the rockfishes (Sebastes spp.) associated with shifts in habitat depth. Journal of Evolutionary Biology, 23, 1159–1169. [DOI] [PubMed] [Google Scholar]
- Somero GN (1992) Adaptations to high hydrostatic pressure. Annual Review of Physiology, 54, 557–577. [DOI] [PubMed] [Google Scholar]
- Sousa‐Santos C, Robalo JI, Collares‐Pereira M‐J, Almada VC (2005) Heterozygous indels as useful tools in the reconstruction of DNA sequences and in the assessment of ploidy level and genomic constitution of hybrid organisms. DNA Sequence, 16, 462–467. [DOI] [PubMed] [Google Scholar]
- Stefánsson MÖ, Reinert J, Sigurđsson T, Kristinsson K, Nedreaas K, Pampoulie C (2009a) Depth as a potential driver of genetic structure of Sebastes mentella across the North Atlantic Ocean. ICES Journal of Marine Science, 66, 680–690. [Google Scholar]
- Stefánsson MÖ, Sigurđsson T, Pampoulie C et al (2009b) Pleistocene genetic legacy suggests incipient species of Sebastes mentella in the Irminger Sea. Heredity, 102, 514–524. [DOI] [PubMed] [Google Scholar]
- Stransky C (2005) Geographic variation of golden redfish (Sebastes marinus) and deep‐sea redfish (S. mentella) in the North Atlantic based on otolith shape analysis. ICES Journal of Marine Science, 62, 1691–1698. [Google Scholar]
- Stransky C, Gudmundsdóttir S, Sigurðsson T, Lemvig S, Nedreaas K, Saborido‐Rey F (2005a) Age determination and growth of Atlantic redfish (Sebastes marinus and S. mentella): bias and precision of age readers and otolith preparation methods. ICES Journal of Marine Science, 62, 655–670. [Google Scholar]
- Stransky C, Kanisch G, Kruger A, Purkl S (2005b) Radiometric age validation of golden redfish (Sebastes marinus) and deep‐sea redfish (S. mentella) in the Northeast Atlantic. Fisheries Research, 74, 186–197. [Google Scholar]
- Tajima F (1983) Evolutionary relationship of DNA‐sequences in finite populations. Genetics, 105, 437–460. [DOI] [PMC free article] [PubMed] [Google Scholar]
- Team RDC (2005) R: A Language and Environment for Statistical Computing. R Foundation for Statistical Computing, Vienna. [Google Scholar]
- Therkildsen NO, Hemmer‐Hansen J, Hedeholm RB et al (2013) Spatiotemporal SNP analysis reveals pronounced biocomplexity at the northern range margin of Atlantic cod Gadus morhua . Evolutionary Applications, 6, 690–705. [DOI] [PMC free article] [PubMed] [Google Scholar]
- Venables WN, Ripley BD (2002) Modern Applied Statistics with S, 4th edn Springer, New York. [Google Scholar]
- Vonlanthen P, Roy D, Hudson AG, Largiader CR, Bittner D, Seehausen O (2008) Divergence along a steep ecological gradient in lake Whitefish (Coregonus sp.). Journal of Evolutionary Biology, Issue, 22, 498–514. [DOI] [PubMed] [Google Scholar]
- Waples RS (1998) Separating the wheat from the chaff: patterns of genetic differentiation in high gene flow species. Journal of Heredity, 89, 438–450. [Google Scholar]
- Weersing K, Toonen RJ (2009) Population genetics, larval dispersal, and connectivity in marine systems. Marine Ecology Progress Series, 393, 1–12. [Google Scholar]
- Yancey PH, Gerringer ME, Drazen JC, Rowden AA, Jamieson AJ (2014) Marine fish may be biochemically constrained from inhabiting the deepest ocean depths. Proceedings of the National Academy of Sciences, 111, 4461–4465. [DOI] [PMC free article] [PubMed] [Google Scholar]
Associated Data
This section collects any data citations, data availability statements, or supplementary materials included in this article.
Supplementary Materials
Table S1 Microsatellite estimates of pairwise genetic differentiation among nine S. mentella collections.
Table S2 Genetic marker discordance among S. mentella samples for mitochondrial control region (mtDNA clades), rhodopsin SNPs and microsatellite genotype.
Table S3 Pairwise F ST genetic differentiation among nine S. mentella collections. mtDNA (below diagonal) and microsatellite (above diagonal) based on 10 000 permutations.
Fig. S1 Haplotype genealogies indicating shallow‐ (red) and deep‐pelagic (blue) samples from Shum et al. (2014) within the larger mtDNA dataset generated in the present study (See Fig. 2, main article).
Fig. S2 Mismatch distributions for oceanic S. mentella clade A (above) and clade B (below).
Fig. S3 Correlation plots between pairwise genetic distances for S. mentella collections from (a) 16 sampling regions based on mtDNA (Φ ST vs. F ST) and (b) nine sampling regions based on microsatellite and mtDNA F ST. Sampling information is provided in Table 1 (main article).
Fig. S4 Chromatograms showing heterozygous SNP at position 208 of the Rhodopsin gene for (a) IrWInt13_12 and (b) IrWDP13_35.
Data Availability Statement
Sequence data for this study are available via GenBank (Accession nos mtDNA: KP988027–KP988288; rhodopsin KR818563–KR818700). Microsatellite genotypes, mitochondrial DNA and rhodopsin sequences are also available via Dryad (http://dx.doi.org/10.5061/dryad.v80q9).