

Abstract
Aims
We aimed to develop a putative predictive biomarker score for future hepatocyte growth factor receptor (MET)‐targeted therapy of gastric cancer (GC).
Methods and results
MET expression and MET amplification were analysed by immunohistochemistry (IHC) and chromogenic in‐situ hybridization (CISH) in 470 GC patients. Immunostaining was documented with the HistoScore. The percentage area of MET‐amplified tumour cell clones was assessed by virtual microscopy. The expression of MET was heterogeneous in primary and metastatic GC. Immunostaining intensity (MET‐IHC 2+/3+) correlated with MET amplification and a positive MET status was defined by a combination of MET‐IHC 2+ or 3+ with MET amplification, or MET‐IHC 3+ without MET amplification. The prognostic significance of the MET status was independent from the percentage area of positive tumour cells (e.g. <10 versus ≥10%). MET‐positive GCs were microsatellite stable and of KRAS/PIK3CA wild‐type. MET‐positive GCs had a very poor prognosis, with a median survival of 5.4 months and a hazard ratio of 2.126.
Conclusions
A combination of immunohistochemistry and CISH is suitable to assess MET status. If MET status is used as a predictive biomarker, prospective studies should pay specific attention to adequate tissue sampling, should ignore cutoff values for tumour areas, may consider the KRAS and PIK3CA genotype as negative predictive markers and should carry out the analysis expeditiously.
Keywords: gastric cancer, immunohistochemistry, in‐situ hybridization, MET, predictive biomarker, targeted therapy
Introduction
In recent decades we have witnessed major advancements in the understanding of the epidemiology, pathology and pathogenesis of gastric cancer (GC). Infection with Helicobacter pylori or Epstein–Barr virus (EBV), dietary and lifestyle factors contribute to the risk of developing GC. These advancements were accompanied by the introduction of chemotherapy for the treatment of GC, which is evolving continuously and improves patients’ survival.1, 2, 3 Evidence is increasing that patient prognosis and treatment response depends not only on tumour stage, but also on the expression and tumour‐specific alteration of signalling pathways. A target currently explored in GC is the tyrosine kinase receptor hepatocyte growth factor receptor (MET) and its single ligand hepatocyte growth factor/scatter factor (HGF/SF). Phases I/II and III studies either explore antibodies directed against HGF/SF (e.g. onartuzimab, rilotumumab) or tyrosine‐kinase inhibitors (e.g. crizotinib, foretinib, tivantinib).4, 5, 6, 7, 8, 9 However, previous studies targeting tyrosine kinase receptors in GC have shown that treatment response depends upon patient selection: trastuzumab is efficacious only in patients with a positive human epidermal growth factor receptor 2 (HER2)/neu status, i.e. strong HER2/neu protein expression or moderate HER2/neu protein expression in conjunction with HER2 amplification.10
In this retrospective observational study on a large GC patient cohort we tested the following hypotheses: (i) MET expression is heterogeneous in GC, (ii) immunostaining intensity of MET correlates with the MET amplification status and (iii) percentage area of MET amplification correlates with patient survival. Finally, we aimed to develop a putative predictive biomarker score, which could be tested and validated prospectively in clinical trials.
Materials and methods
Ethics Statement
This project was approved by the local ethics committee of the University Hospital in Kiel, Germany (reference number D 453/10). All patient data were pseudonymized prior to study inclusion.
Study Population
From the archive of the Institute of Pathology, University Hospital Kiel, we identified all Caucasian patients who had undergone either total or partial gastrectomy for adenocarcinomas of the stomach or oesophago–gastric junction between 1997 and 2009 (GC cohort). The following patient characteristics were retrieved: type of surgery, age at diagnosis, gender, tumour localization and tumour size, tumour type, tumour grade, depth of invasion, number of lymph nodes resected and number of lymph nodes with metastases (Table 1). Date of patient death was obtained from the Epidemiological Cancer Registry of the state of Schleswig‐Holstein, Germany. Follow‐up data of patients still alive were retrieved from hospital records and general practitioners.
Table 1.
Clinicopathological patient characteristics of the gastric cancer cohort
| Valid (n) | Missing (n) | Total (n) | MET negative [n (%)] | MET positive [n (%)] | P‐value | ||
|---|---|---|---|---|---|---|---|
| Gender | 470 | 0 | Men | 291 | 265 (91.1) | 26 (8.9) | 0.041a |
| Women | 179 | 172 (96.1) | 7 (3.9) | ||||
| Age | 470 | 0 | <68 years | 233 | 214 (91.8) | 19 (8.2) | 0.371a |
| ≥68 years | 237 | 223 (94.1) | 14 (5.9) | ||||
| Localization | 470 | 0 | Proximal stomach | 143 | 128 (89.5) | 15 (10.5) | 0.075a |
| Distal stomach | 327 | 309 (94.5) | 18 (5.5) | ||||
| Laurén phenotype | 470 | 0 | Intestinal | 241 | 228 (94.6) | 13 (5.4) | 0.060a |
| Diffuse | 147 | 137 (93.2) | 10 (6.8) | ||||
| Mixed | 31 | 25 (80.6) | 6 (19.4) | ||||
| Unclassified | 51 | 47 (92.2) | 4 (7.8) | ||||
| Mucin phenotype | 412 | 58 | Intestinal | 117 | 113 (96.6) | 4 (3.4) | 0.237a |
| Gastric | 62 | 57 (91.9) | 5 (8.1) | ||||
| Mixed | 169 | 153 (90.5) | 16 (9.5) | ||||
| Unclassified | 64 | 60 (93.8) | 4 (6.2) | ||||
| pT‐category | 470 | 0 | pT1a/b | 59 | 57 (96.6) | 2 (3.4) | 0.043b |
| pT2 | 56 | 55 (98.2) | 1 (1.8) | ||||
| pT3 | 184 | 170 (92.4) | 14 (7.6) | ||||
| pT4a/b | 171 | 155 (90.6) | 16 (9.4) | ||||
| pN‐category | 469 | 1 | pN0 | 134 | 131 (97.8) | 3 (2.2) | 0.004b |
| pN1 | 65 | 64 (98.5) | 1 (1.5) | ||||
| pN2 | 85 | 74 (87.1) | 11 (12.9) | ||||
| pN3 (a/b) | 185 | 167 (90.3) | 18 (9.7) | ||||
| Lymph node ratio | 468 | 2 | <0.189 | 229 | 221 (96.5) | 8 (3.5) | 0.004a |
| ≥0.189 | 239 | 214 (89.5) | 25 (10.5) | ||||
| Stage (UICC) | 470 | 0 | IA | 46 | 45 (97.8) | 1 (2.2) | <0.001b |
| IB | 36 | 36 (100.0) | 0 (0.0) | ||||
| IIA | 55 | 54 (98.2) | 1 (1.8) | ||||
| IIB | 46 | 43 (93.5) | 3 (6.5) | ||||
| IIIA | 55 | 51 (92.7) | 4 (7.3) | ||||
| IIIB | 80 | 73 (91.2) | 7 (8.8) | ||||
| IIIC | 64 | 58 (90.6) | 6 (9.4) | ||||
| IV | 88 | 77 (87.5) | 11 (12.5) | ||||
| Lymphatic invasion | 455 | 15 | pL0 | 221 | 214 (96.8) | 7 (3.2) | 0.003a |
| pL1 | 234 | 210 (89.7) | 24 (10.3) | ||||
| Venous invasion | 454 | 16 | pV0 | 403 | 379 (94.0) | 24 (6.0) | 0.068a |
| pV1 | 51 | 44 (86.3) | 7 (13.7) | ||||
| Tumour grade | 469 | 1 | G1/G2 | 112 | 110 (98.2) | 2 (1.8) | 0.010a |
| G3/G4 | 357 | 326 (91.3) | 31 (8.7) | ||||
| R‐status | 470 | 0 | pR0 | 410 | 387 (94.4) | 23 (5.6) | 0.005a |
| pR1 | 60 | 50 (83.3) | 10 (16.7) | ||||
| Survival | 455 | 15 | Total | 455 | 425 (93.4) | 30 (6.6) | |
| Dead | 354 | 325 (91.8) | 29 (8.2) | ||||
| Median (months ± SD; 95%CI) | 16.69 ± 1.42 (13.90–19.48) | 5.42 ± 0.97 (3.53–7.32) | <0.001c | ||||
| Helicobacter pylori | 402 | 68 | Positive | 60 | 56 (93.3) | 4 (6.7) | 0.769a |
| Negative | 342 | 322 (94.2) | 20 (5.8) | ||||
| EBV | 453 | 17 | Positive | 17 | 15 (88.2) | 2 (11.8) | 0.356a |
| Negative | 436 | 405 (92.9) | 31 (7.1) | ||||
| KRAS | 470 | 0 | Wild‐type | 453 | 420 (92.7) | 33 (7.3) | 0.622a |
| Mutant | 17 | 17 (100.0) | 0 | ||||
| PIK3CA | 470 | 0 | Wild‐type | 450 | 417 (92.7) | 33 (7.3) | 0.384a |
| Mutant | 20 | 20 (100.0) | 0 (0.0) | ||||
| MSI status | 441 | 29 | MSS | 407 | 376 (92.4) | 31 (7.6) | 0.155a |
| MSI high | 34 | 34 (100.0) | 0 | ||||
| HER2 | 443 | 27 | Positive | 36 | 35 (97.2) | 1 (2.8) | 0.497a |
| Negative | 407 | 377 (92.6) | 30 (7.4) | ||||
EBV, Epstein–Barr virus; MSI, Microsatellite instability; HER2, Human epidermal growth factor receptor 2; SD, Standard deviation; MET, Hepatocyte growth factor receptor; UICC, Union for International Cancer Control.
Fisher's exact test.
Kendall's tau test.
Log‐rank test.
Study Inclusion and Exclusion Criteria
Inclusion and exclusion criteria for the gastric cancer cohort were defined as follows: patients were included if (i) histology confirmed an adenocarcinoma of the stomach or oesophago–gastric junction and (ii) the date of death or survival data were available. Patients were excluded if (i) histology identified a tumour type other than adenocarcinoma, (ii) patients had previously undergone a resection of a Billroth‐II stomach with cancer in the gastric remnant and (iii) patients who had received perioperative chemotherapy.
Histology and Tumour–Node–Metastasis (TNM) Classification
Tissue specimens were fixed in 10% neutralized formalin for at least 24 h and embedded in paraffin. The formalin fixation was standardized during the study period. Sections taken from the tumour included luminal surface, tumour centre and invasion front. Deparaffinized sections were stained with haematoxylin and eosin. Tumours were classified according to the Laurén classification11 and the mucin phenotype.12 pTNM stage of all study patients was determined according to the 7th edition of the Union for International Cancer Control (UICC) guidelines,13 and was based solely on surgical pathological examination.
Immunohistochemistry
The hepatocyte growth factor receptor was detected by immunohistochemistry (IHC) using a rabbit monoclonal anti‐MET antibody (dilution 1:50; clone SP44; Spring Bioscience, Pleasanton, CA, USA) and the autostainer Bond™ Max System (Leica‐Menarini, Berlin, Germany). Antigen retrieval was carried out using the ER1 antigen retrieval solution for 20 min at pH 6.0 (Leica‐Menarini).
Immunostaining (MET‐IHC) was evaluated according to the HistoScore (Hscore), as described previously.14 The first parameter was based on the intensity of the stained cells. A score of 0 (no evidence of staining, MET‐IHC 0) to 3 (strong staining reaction, MET‐IHC 3+) was applied. The second parameter (P) estimated the distribution of the stained cells in percentage. The sum total of all staining intensities found in a single case always added to a total Hscore of 100, according to the following formula: P (MET‐IHC 0) + P (MET‐IHC 1+) + P (MET‐IHC 2+) + P (MET‐IHC 3+) = 100%. The entire series was screened and three representative cases were selected for the adjustment of MET‐IHC 1+, 2+ and 3+ staining intensity (Figure 1). These cases were used subsequently as reference standard for the in‐depth evaluation of the entire cohort. MET‐IHC 0 was characterized by the complete lack of any membranous immunostaining. MET‐IHC 1+ was characterized by faint, MET‐IHC 2+ by moderate and MET‐IHC 3+ by strong membranous staining. Membranous immunostaining was almost always associated with cytoplasmatic immunostaining (Figure 1). The localization of membranous immunostaining was variable, i.e. lateral, basolateral and circumferential, but was not used to classify immunostaining or MET status, as it was highly variable within a single tumour (intratumour heterogeneity).
Figure 1.
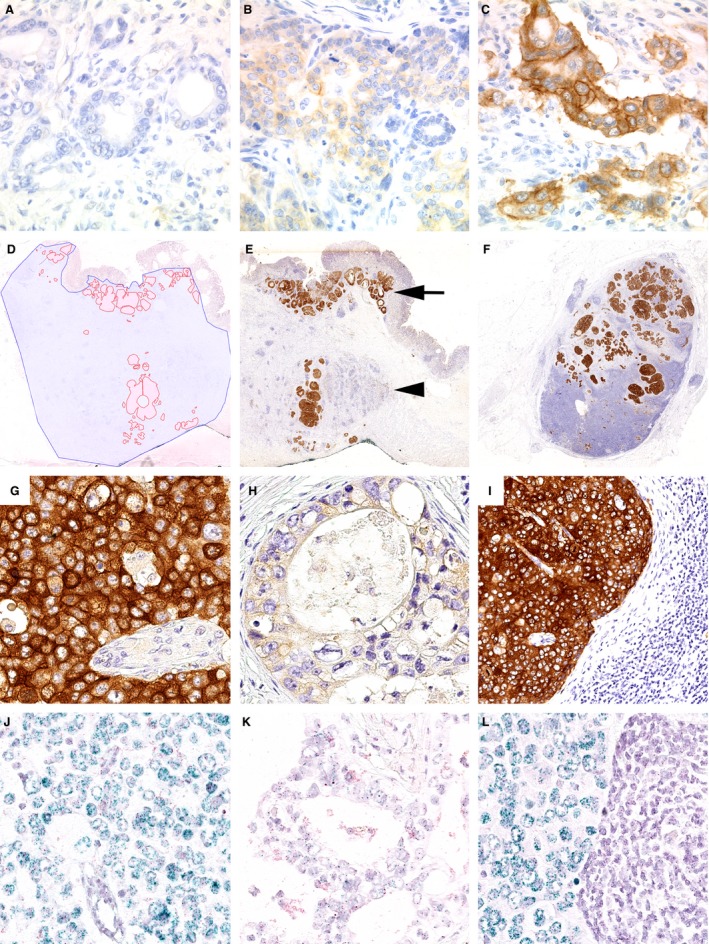
Hepatocyte growth factor receptor (MET) protein expression in gastric cancer. The expression of MET was studied by immunohistochemistry (IHC) (A–C, E–I) and chromogenic in‐situ hybridization (D, J–L). The entire gastric cancer cohort was screened and three representative cases were selected for MET IHC 0 (A), 1+ (B), 2+ (C) and 3+ (G). Using a viewer program with a polygon line drawing function we traced manually the outlines of the total tumour tissue area (blue) and the MET‐amplified tumour area (red; D). This illustrates the heterogeneity of MET expression and MET amplification. Less than 10% of the entire tumour area showed MET‐IHC 3+ (E, G), while other areas were MET‐IHC 0 or 1+ (H). MET was amplified (J) or not (K). A corresponding lymph node metastasis of the same patient showed MET‐IHC 3+ (F, I) and MET amplification of the metastatic tumour cells (L). The spatial distribution of MET status‐positive tumour cell clones is also illustrated in (E). Immunostaining was localized at the cell membrane as well as in the cytoplasm. MET‐positive tumour cell clones were found near the mucosal surface (arrow) and in the tumour centre (arrowhead; E).
Chromogenic In‐situ Hybridization (CISH)
Analysis of MET amplification was performed by CISH using the ZytoDot 2C SPEC MET/CEN7 Probe and the ZytoDot 2C CISH Implementation Kit (ZytoVision GmbH, Bremerhaven, Germany).
The results of CISH were evaluated by screening the entire tissue sections in order to find, where present, MET‐amplified invasive cancer areas. Subsequently, MET and centromer 7 signals were counted in at least 20 representative adjacent cancer cell nuclei within the invasive region. Forty nuclei were counted when the MET/centromer 7 ratio ranged from 1.8 to 2.2. The presence of CISH clusters was noted and the ratio of MET/centromer 7 signals was calculated. The gene count was calculated by dividing the number of MET gene signals by the number of cancer cell nuclei studied.
Assessment of Phenotype, Genotype and Infectious Status
The KRAS genotype, PIK3CA genotype, mucin phenotype and the Helicobacter pylori, Epstein–Barr virus, microsatellite and HER2/neu status were assessed as described in detail previously.15
Virtual Microscopy
Tissue sections were scanned using a Leica SCN400 microscopic whole‐slide scanner (Leica Biosystems, Nussloch, Germany) at its maximum, nominally ×40 magnification. In the scanned images, pixel‐to‐pixel distance represents 0.26 micrometres. Images were exported from the scanner system into files of Leica SCN format. For performing the computer‐assisted parts of the study, a viewer program was written to display images of the Leica SCN file format, as described in detail previously.16 This provided the flexibility to create the screen layout, user interaction, assistance tool and calculation routines we needed for our study.
Statistics
Statistical analyses were performed using SPSS version 20.0 (IBM Corporation, Armonk, NY, USA). For continuous variables, cases were divided into two groups by splitting at the median value. Median overall survival was determined using the Kaplan–Meier method, and the log‐rank test was used to determine significance. For comparison purposes, the median survival time, its standard deviation and 95% confidence interval (CI) were calculated. To investigate prognostic relevance, we included all variables having P < 0.10 into a Cox regression model and used the backward logistic regression (LR) method (P in = 0.05 and P out = 0.10) to reduce the model to the independent variables. The significance of correlation between clinicopathological parameters and biomarker expressions was tested using Fisher's exact test. For parameters of ordinal scale (T‐category, N‐category, tumour stage), we applied Kendall's tau test instead. P ≤ 0.05 was considered statistically significant. To account for the effects of multiple testing, we applied the explorative Simes (Benjamini–Hochberg) procedure. P‐values are given unadjusted, but are marked where they lose significance under the explorative Simes procedure.
Results
MET Expression in Gastric Cancer
First we examined the expression of MET in GC by immunohistochemistry (MET‐IHC). MET‐IHC was available from 470 GC cases. Weak immunostaining (MET‐IHC 1+) was found in 184 (39.1%) cases, moderate (MET‐IHC 2+) in 51 (10.9%) cases and strong (MET‐IHC 3+) in 27 (5.7%) cases. Immunonegative tumour cells (MET‐IHC 0) were found in 460 (97.9%) cases. The percentage area of the four immunostaining categories, i.e. MET‐IHC 0, 1+, 2+ and 3+, ranged from 0% to 100% (see Supporting information, Figure S1) and the combination of the staining categories in each individual case varied: 272 (57.9%) GCs were completely devoid of any MET expression. One case showed 100% MET‐IHC 3+; 197 cases showed a combination of two or three staining intensities, i.e. MET‐IHC 0/1+ [143 cases (30.4%)], 0/2+ [2 (0.4%)], 1+/2+ [2 (0.4%)], 0/3+ [1 (0.2%)], 2+/3+ [4 (0.9%)], 0/1+/2+ [24 (5.1%)], 0/1+/3+ [2 (0.4%)], 0/2+/3+ [6 (1.3%)], 1+/2+/3+ [3 (0.6)] or 0/1+/2+/3+ [10 (2.1)] (also see Figure 2). These data show that the expression (=combination of intensity of immunostaining and amount of immunopositive tumour areas) of MET is heterogeneous in GC, including ‘grey‐scale’ and ‘black‐and‐white’ immunostaining patterns (Figures 1 and 2).
Figure 2.
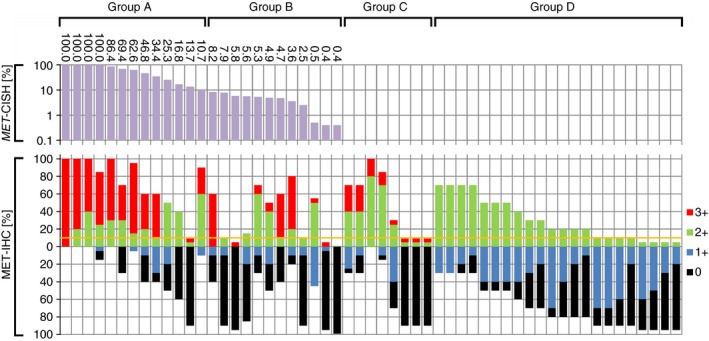
Waterfall‐plot illustrating the distribution of MET amplification and hepatocyte growth factor receptor (MET) immunostaining among 55 patients. The waterfall plot shows case‐by‐case the results of chromogenic in‐situ hybridization (MET‐ CISH; logarithmic data presentation), and immunohistochemistry (MET‐IHC; liner data presentation) for patients belonging to group A (≥10% MET amplification), group B (<10% MET amplification), group C (MET‐IHC 3+ without MET amplification) and group D (MET‐IHC 2+ without MET amplification). Note that the different colours at the bottom illustrate the different staining intensities: MET‐IHC 3+ (red), MET‐IHC 2+ (green), MET‐IHC 1+ (blue) and MET‐IHC 0 (black). The sum total of all staining intensities found in a single case always added to a total HistoScore (Hscore) of 100% according to the following formula: P (MET‐IHC 0) + P (MET‐IHC 1+) + P (MET‐IHC 2+) + P (MET‐IHC 3+) = 100%. The yellow line marks a 10% cutoff, which is used, for example, to classify HER2/neu as either positive (above) or negative (below).
Chromogenic In‐situ Hybridization
All cases (n = 55) with MET‐IHC 2+ and/or MET‐IHC 3+ tumour areas were forwarded to CISH. Overall, 25 of 55 (45.5%) were reported positive, i.e. 19 of 27 (70.4%) cases with MET‐IHC 3+ and six of 28 (21.4%) cases with MET‐IHC 2+ and without MET‐IHC 3+ staining showed MET amplification (Figure 2). The gene ratio ranged from 2.07 to 6.26 (median 3.82) and the gene count ranged from 4.55 to 14.10 (median 8.70). MET gene clusters were found in 24 cases. In summary, 5.3% of the entire GC cohort showed a MET amplification (25 of 470 cases).
Gene amplification was heterogeneous (see below), in that amplified and unamplified tumour areas were demarcated sharply on a cell‐by‐cell basis (Figure 1). Amplification correlated spatially with the MET‐IHC 3+ or MET‐IHC 2+ areas. MET amplification was not found in MET‐IHC 0 or MET‐IHC 1+ tumour areas (Figure 1).
Correlation of Patient Survival with MET‐Amplified Tumour Areas and MET Immunostaining
Next we tested the hypothesis that the percentage area of MET‐amplified tumour cells and intensity of MET immunostaining correlates with patient survival. For this purpose, we scanned CISH‐labelled tumour‐bearing tissue sections harbouring MET amplification (ratio ≥2.0) with a microscopic whole‐slide scanner. Using a viewer program with a polygon line‐drawing function we traced the outlines of the total tumour tissue area and the MET‐amplified tumour area, which was demarcated sharply (on a cell‐by‐cell basis) from unamplified tumour areas. The percentage of MET‐amplified tumour area was subsequently computed and ranged from 0.4% to 100.0% (Figure 2). Thereafter, GCs were categorized into five groups: ≥10% MET‐amplified tumour area (group A; Figure 2), <10% MET‐amplified tumour area (group B), MET‐IHC 3+ without MET amplification (group C), MET‐IHC 2+ without MET amplification (group D) and MET‐IHC 1+ or MET‐IHC 0 (group E; Table 2). Interestingly, the median survivals of groups A, B and C were not significantly different from each other (A versus B: P = 0.438; A versus C: P = 0.463; B versus C: P = 0.811). To the contrary, patients of group D had lived significantly longer compared with groups A (P = 0.001), B (P < 0.035) or C (P = 0.031). The median survival between groups D and E was not significantly different. Thus, independently from the MET‐amplified tumour area, any MET amplification and MET‐IHC 3+ without amplification is significantly prognostically unfavourable. The Kaplan–Meier plots further illustrate the survival of the different patient groups (Figure 3, Table 2) and the effect any percentage area of MET amplification has on patient survival.
Table 2.
Correlation of patient survival with hepatocyte growth factor receptor (MET)‐immunostaining and MET‐amplified tumour areas
| Final MET status | Group | Immunohistochemistry | Chromogenic in‐situ hybridization | Number of patients | Median survival ± SD (months) | 95% CI |
|---|---|---|---|---|---|---|
| Positive | A | MET‐IHC‐2+ and/or 3+ | MET amplified area ≥10% | 13 | 3.81 ± 1.71 | 0.47–7.16 |
| Positive | B | MET‐IHC‐2+ and/or 3+ | MET amplified area <10% | 12 | 4.27 ± 0.57 | 3.15–5.39 |
| Positive | C | MET‐IHC‐3+ | MET unamplified | 8 | 5.85 ± 6.27 | 5.43–6.27 |
| Negative | D | MET‐IHC‐2+ | MET unamplified | 22 | 18.76 ± 8.82 | 1.47–36.05 |
| Negative | E | MET‐IHC1+ or 0 | MET unamplified | 415 | 16.53 ± 1.45 | 13.69–19.37 |
MET, Hepatocyte growth factor receptor; IHC, Immunohistochemsitry; CISH, Chromogenic in‐situ hybridization; CI, Confidence interval; SD, Standard deviation.
Figure 3.
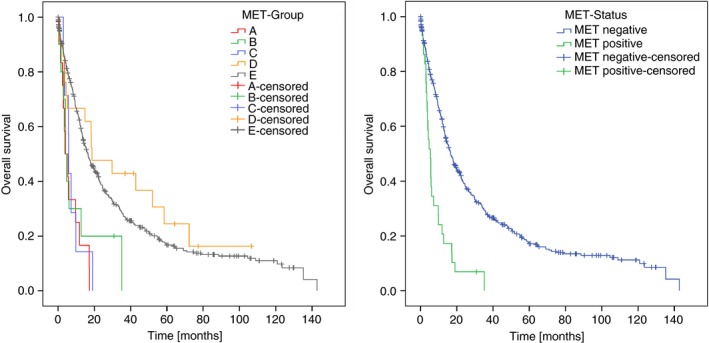
Kaplan–Meier curves depicting patients’ survival. Patients were categorized into five hepatocyte growth factor receptor (MET) groups (A): ≥10% MET‐amplified tumour area (group A), <10% MET‐amplified tumour area (group B), MET‐IHC 3+ and ‐unamplified (group C), MET‐IHC 2+ and unamplified (group D), and MET‐IHC 1+ or MET‐IHC 0 (group E). Subsequently, groups A–C were classified as MET‐positive and groups D–E as MET‐negative (B).
Correlation of MET Status with Clinicopathological Patient Characteristics
Next, we correlated the MET status with various clinicopathological patient characteristics. To this purpose, and based on the aforementioned results, we categorized all patients of groups A–C as MET‐positive, thereby discarding the 10% cutoff value used for HER2/neu‐scoring,10 and all GCs of groups D and E as MET‐negative (Table 2). The MET status correlated significantly with lymphatic invasion, N category, lymph node ratio, UICC tumour stage, tumour grade and R‐status (Table 1). MET‐positive GCs were insignificantly more prevalent in men, in mixed‐type GCs and locally more advanced tumours (8.2% pT3/4 versus 2.6% pT1/2; Table 1). GCs with venous invasion overexpressed MET more commonly compared with GCs without venous invasion. No correlation was found between MET status and infection with either H. pylori or EBV. Interestingly, all MET‐positive GCs were microsatellite stable, and of KRAS and PIK3CA wild‐type. MET and HER2 status were mutually exclusive, except for a single case, which showed both, MET and HER2 amplification in spatially distinct tumour areas (Figure 4).
Figure 4.
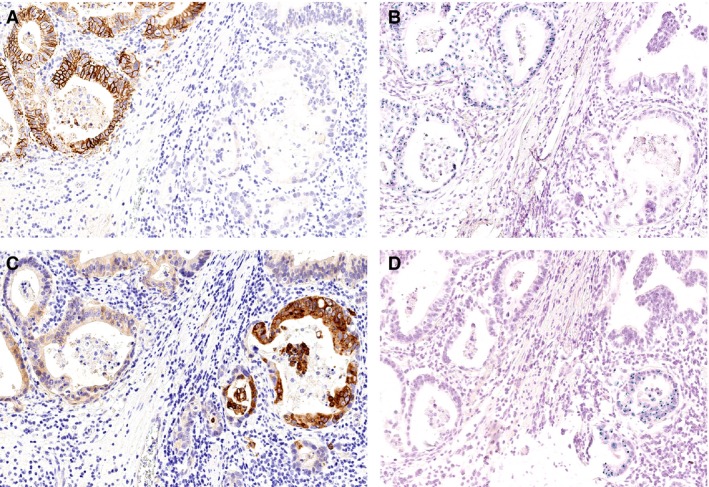
HER2/neu‐ and hepatocyte growth factor receptor (MET) overexpression in a single patient. A single patient showed overexpression of HER2/neu (A, B) and MET (C, D) in spatially distinct tumour areas. Four serial sections were stained immunohistochemically (A, C) and by chromogenic in‐situ hybridization (B, D). Note the distinct immunoreactions of HER2/neu and MET. HER2/neu showed a characteristic delicate basolateral staining of the cell membrane, while MET immunostaining was also strong within the cytoplasm.
Finally, we correlated MET status with patient survival. MET‐positive GCs had a highly significantly worse prognosis (Table 1, Figure 3). Patient prognosis also depended highly significantly upon patient age, Laurén phenotype, tumour grade, T‐category, N‐category, lymph node ratio, R‐status, as well as UICC stage (data not shown).
Multivariate Survival Analysis (Cox Regression)
A Cox regression was carried out on all parameters, which had a P < 0.10 in univariate survival analysis, i.e. Laurén phenotype, T‐category, N‐category, UICC‐stage, lymph node ratio, lymphatic and venous invasion, R‐status and MET status. Four parameters remain in the Cox model after running the backward LR method with P in = 0.05 and P out = 0.10. These were R‐status [hazard ratio (HR) = 2.208 (1.573–3.099); P < 0.001], MET status [HR = 2.126 (1.386–3.261); P = 0.001], lymph node ratio [HR = 1.633 (1.197–2.228); P = 0.002] and UICC stage [HR = 1.055 (95% CI: 1.034–1.077); P < 0.001].
MET Status in Lymph Node Metastases
We then explored the MET status in lymph node metastases of MET‐positive GCs, i.e. MET‐IHC 2+ and/or 3+ with MET amplification or MET‐IHC 3+ without MET amplification (groups A–C). Lymph node metastases were available from 26 (78.8%) MET‐positive cases. MET‐IHC and MET amplification of the lymph node metastases was also heterogeneous with MET‐IHC 0, 1+, 2+ and 3+ as well as MET‐amplified and MET‐unamplified tumour cell clones within the same lymph node. A comparison of the primary tumours with the corresponding lymph node metastases showed a concordant MET status in 15 (58%) cases (Figure 1E,F). In 11 (42%) cases, the lymph node metastases were MET‐negative. The overall survival between concordant (n = 15) and discordant (n = 11) cases was not significantly different (P = 0.280). In cases with MET‐positive lymph nodes metastases, the lymph node ratio, i.e. number of MET‐positive lymph node metastases divided by the total number of lymph node metastases, did not correlate with the overall survival (P = 0.079). Finally, we explored MET status in all lymph node metastases of MET‐negative GCs (group D). Lymph node metastases were available from 18 (81.8%) MET‐negative cases. None of these showed a MET‐positive lymph node metastasis.
Spatial Localization of MET‐Positive Tumour Cell Clones
In a palliative setting, only tumour biopsies may be available for testing of a predictive biomarker. Finally, we explored the spatial distribution of MET‐positive tumour cell clones in the primary tumour. The MET‐positive tumour cells were close to the mucosal surface in 26 (78%) cases (Figure 1D). In seven (21%) cases, MET‐positive tumour cell clones were localized only in the tumour centre or near the invasion front.
Discussion
Hepatocyte growth factor receptor is a tyrosine kinase receptor with pleiotropic effects. It is essential for embryonic development and regeneration, placenta and liver development, liver regeneration and wound repair. MET is activated in tumorigenesis, e.g. by HGF/SF overexpression, autocrine signalling, MET mutation or gene amplification. In a context‐dependent manner it induces proliferation, survival, motility, cell scattering, angiogenesis and tubulogenesis and drives epithelial–mesenchymal transition as well as invasion.4, 17 Deng et al.18 showed recently that 37% of the GCs harbour receptor tyrosine kinase gene amplifications affecting FGFR2, EGFR, HER2 and MET, whose transcripts are promising therapeutic targets.10, 19 MET is currently explored for the treatment of GC,4, 5, 6, 7, 8, 9 and targeting MET may depend upon its expression pattern explored by immunohistochemistry and/or CISH.4 Many studies have explored the tumour–biological and clinicopathological characteristics of MET‐positive GCs. The expression has been studied by immunohistochemistry in several studies,6, 20, 21, 22, 23, 24, 25, 26, 27, 28, 29, 30, 31, 32, 33, 34, 35 and the number of MET‐IHC‐positive GCs ranged from 3.8%20 to 85%.36 In our cohort, any immunostaining of MET (MET IHC 1+ to 3+) was found in 192 (42.1%) cases. This range of immunopositivity is due to the usage of different types of antibodies and different, non‐standardized scoring systems. Seven studies used the rabbit monoclonal SP44 antibody applied in our study, which was found to be the most reliable antibody.21, 23, 24, 27, 28, 30, 31 The positivity rate was more homogeneous, but still ranged from 924 to 41%.21 This relates to the different scoring systems and cutoff values applied. However, none of these studies provided a rational explanation for the application of a certain cutoff value or scoring system. Until now the significance of the diverse scoring systems has not been explored systematically. In our study we carried out the first systematic analysis, to our knowledge, on MET expression using the HScore. This demonstrates a substantial intra‐ and intertumour variability of MET immunostaining with regard to the combination of staining intensities (MET‐IHC 0, 1+, 2+, 3+) and the percentages of positive tumour areas (see Figure 2 and Supporting information, Figure S1). This is particularly difficult with regard to the application of immunostaining as a predictive biomarker.16 Recently we have shown that pathologists have good ability to estimate ratios of clearly demarcated areas, but gradients in staining intensities (such as a combination of two or three different immmunostaining intensities in a single case) hinder reproducible visual demarcation of positive tumour areas.16 However, for HER2/neu it has been demonstrated in breast and stomach cancer that a combination of immunohistochemistry and in‐situ hybridization may improve the specificity of the predictive biomarker. Using CISH, we show that only 5.3% of our GCs are MET‐amplified. This low prevalence is in line with previous findings, where the number of MET‐amplified GCs ranged from 1.3% to 12%.5, 6, 7, 23, 28, 30, 31, 37, 38 Overall, MET amplification is rare in GC, and is also heterogeneous with amplified and unamplified tumour cell clones occurring in the same primary GC, which was reported occasionally,31, 39 and never explored systematically.
In the tissue‐based HER2‐scoring system for GC, GCs are classified as HER2/neu‐positive when ≥10% of the tumour area shows strong immunostaining (3+) for HER2/neu, or moderate immunostaining (2+) in conjunction with HER2 amplification (ratio ≥ 2.0). A 10% cutoff rule has also been applied to MET scoring.20, 21, 28, 31 Next we explored the putative significance of cutoff values and calculated the percentage area of MET‐positive tumour cells with greater accuracy using virtual microscopy. We show that even a small subpopulation (0.4%) of MET‐amplified tumour cells already indicates a poor prognosis. We provide further evidence that patient prognosis can be used to test and develop a rational classifier of MET status, i.e. positive or negative, by using a combination of immunostaining and CISH and by discarding any cutoff value for positive tumour areas. Using patient survival as a surrogate marker for the development of a predictive biomarker is sensible, as therapeutic efficacy of targeted therapy is assessed by the improvement of, for example, overall survival.10
Our study also supports the contention that tumour heterogeneity is a major issue with regard to analysing the MET status in GC. In a previous study we demonstrated the risk of false positive and negative ratings of HER2/neu status in GC due to sampling errors.40 The spatial distribution of MET expression was highly variable. In seven (21%) cases, MET‐positive tumour cell clones were localized only in the tumour centre or near the invasion front, and superficial tumour biopsies may carry the risk of a false negative test result (Figure 1). This may explain the low prevalence of MET amplification in studies utilizing only biopsy specimens (2%)7 or tissue microarrays (1.3–3.4%).28, 31 Thus, assessment of the MET status carries the same risk of false positive and negative ratings due to a sampling error, as was shown previously for HER2/neu.40, 41 This also applies to the examination of lymph node metastases. MET status is heterogeneous between lymph node metastases of the same patient. While we did not find MET‐positive lymph node metastases in MET‐negative primary GCs, 11% of MET‐positive primary GCs harboured MET‐negative lymph node metastases.
Tumour heterogeneity may be an intrinsic problem of GCs with receptor tyrosine kinase gene amplifications. Recently, whole‐genome sequencing and comprehensive molecular profiling of 100 tumour‐normal pairs of GC have shown that GC with receptor tyrosine kinase gene amplifications are specifically enriched in the subgroup of genomic unstable GCs, which also show activation of the rat sarcoma (RAS) signalling pathway.42, 43 Therefore, our findings are in line with recent findings on the molecular biology of GC. More interestingly, in our cohort, MET amplification and KRAS/PIK3CA mutations were mutually exclusive. MET signalling is mediated primarily through the RAS–mitogen‐activated extracellular kinase (MAPK) and phosphoinositide 3‐kinase (PI3K)–protein kinase B (Akt) pathways. This observation leads to the conjecture that receptor tyrosine kinase amplification and RAS/PIK3CA mutations may be mutually exclusive. Interestingly, we have shown previously that KRAS mutant GCs have a worse prognosis compared with their KRAS wild‐type counterparts (3.5 ± 3.1 versus 12.7 ± 0.7 months),15 being in the range of MET‐amplified GCs. Together, MET‐amplified and KRAS mutant GCs account for 10% of our patient cohort, and seem to specify a unique subgroup with a very poor prognosis. Further studies into this topic are warranted.
In conclusion, MET‐positive GCs define a small aggressive subgroup of genetically unstable GCs with a very poor prognosis. A combination of MET immunostaining and in‐situ hybridization is suitable to assess MET status. If MET is used as a predictive biomarker, prospective studies should pay specific attention to adequate tissue sampling, should ignore cutoff values for tumour areas, may consider the KRAS and PIK3CA genotypes as negative predictive markers and should carry out the analysis expeditiously, as these patients have a very poor prognosis.
Conflicts of interest
The authors declare that no competing interests exist.
Supporting information
Figure S1. Hepatocyte growth factor receptor (MET)‐immunostaining in gastric cancer. Immunostaining [MET immunohistochemistry (IHC)] was evaluated according to the HistoScore (Hscore). The first parameter documented the intensity of the stained cells: no evidence of immunostaining (MET‐IHC 0; A), mild (cMET‐IHC1+; B), moderate (MET‐IHC 2+; C) or strong immunostaining (MET‐IHC 3+; D). The second parameter (P) estimates the distribution of the stained cells in percentage (x‐axis). The sum total of all staining intensities found in a single case always added to a total Hscore of 100% according to the following formula: P (MET‐IHC 0) + P (MET‐IHC 1+) + P (MET‐IHC 2+) + P (MET‐IHC 3+) = 100% (also see Figure 2). The prevalence of the percentage areas of the four different immunostainings found in our gastric cancer cohort is shown on the y‐axis. The figure also demonstrates the heterogeneity of MET immunostaining in gastric cancer.
Acknowledgements
CR is supported by grants from the German Research Foundation (grant no. Ro 1173/11 and Ro 1173/12).
Metzger M‐L, Behrens H‐M, Böger C, Haag J, Krüger S & Röcken C (2016) Histopathology 68, 241–253. DOI: 10.1111/his.12745 MET in gastric cancer – discarding a 10% cutoff rule
References
- 1. Alberts SR, Cervantes A, van de Velde CJ. Gastric cancer: epidemiology, pathology and treatment. Ann.Oncol. 2003; 14(Suppl 2); ii31–ii36. [DOI] [PubMed] [Google Scholar]
- 2. Cunningham D, Allum WH, Stenning SP et al Perioperative chemotherapy versus surgery alone for resectable gastroesophageal cancer. N. Engl. J. Med. 2006; 355; 11–20. [DOI] [PubMed] [Google Scholar]
- 3. Paoletti X, Oba K, Burzykowski T et al Benefit of adjuvant chemotherapy for resectable gastric cancer: a meta‐analysis. JAMA 2010; 303; 1729–1737. [DOI] [PubMed] [Google Scholar]
- 4. Hack SP, Bruey JM, Koeppen H. HGF/MET directed therapeutics in gastroesophageal cancer: a review of clinical and biomarker development. Oncotarget 2014; 5; 2866–2880. [DOI] [PMC free article] [PubMed] [Google Scholar]
- 5. Jardim DL, de Melo Gagliato D, Falchook GS et al MET aberrations and c‐MET inhibitors in patients with gastric and esophageal cancers in a Phase I unit. Oncotarget 2014; 5; 1837–1845. [DOI] [PMC free article] [PubMed] [Google Scholar]
- 6. Kang YK, Muro K, Ryu MH et al A Phase II trial of a selective c‐MET inhibitor tivantinib (ARQ 197) monotherapy as a second‐ or third‐line therapy in the patients with metastatic gastric cancer. Invest. New Drugs 2014; 32; 355–361. [DOI] [PubMed] [Google Scholar]
- 7. Lennerz JK, Kwak EL, Ackerman A et al Met amplification identifies a small and aggressive subgroup of esophagogastric adenocarcinoma with evidence of responsiveness to crizotinib. J. Clin. Oncol. 2011; 29; 4803–4810. [DOI] [PMC free article] [PubMed] [Google Scholar]
- 8. Shah MA, Wainberg ZA, Catenacci DV et al Phase II study evaluating 2 dosing schedules of oral foretinib (GSK1363089), CMET/VEGFR2 inhibitor, in patients with metastatic gastric cancer. PLoS ONE 2013; 8; e54014. [DOI] [PMC free article] [PubMed] [Google Scholar]
- 9. Teng L, Lu J. CMET as a potential therapeutic target in gastric cancer (review). Int. J. Mol. Med. 2013; 32; 1247–1254. [DOI] [PubMed] [Google Scholar]
- 10. Bang YJ, Van CE, Feyereislova A et al Trastuzumab in combination with chemotherapy versus chemotherapy alone for treatment of HER2‐positive advanced gastric or gastro‐oesophageal junction cancer (Toga): a phase 3, open‐label, randomised controlled trial. Lancet 2010; 376; 687–697. [DOI] [PubMed] [Google Scholar]
- 11. Lauren T. The two histologic main types of gastric carcinoma: diffuse and so‐called intestinal‐type carcinoma. Acta Pathol. Microbiol. Scand. 1965; 64; 31–49. [DOI] [PubMed] [Google Scholar]
- 12. Namikawa T, Hanazaki K. Mucin phenotype of gastric cancer and clinicopathology of gastric‐type differentiated adenocarcinoma. World J. Gastroenterol. 2010; 16; 4634–4639. [DOI] [PMC free article] [PubMed] [Google Scholar]
- 13. Sobin LH, Gospodarowicz M, Wittekind C. TNM classification of malignant tumours. 7th ed Chichester: Wiley‐Blackwell, 2009. [Google Scholar]
- 14. McCarty KS Jr, Miller LS, Cox EB, Konrath J, McCarty KS Sr. Estrogen receptor analyses. Correlation of biochemical and immunohistochemical methods using monoclonal antireceptor antibodies. Arch. Pathol. Lab. Med. 1985; 109; 716–721. [PubMed] [Google Scholar]
- 15. Warneke V, Behrens HM, Haag J et al Prognostic and putative predictive biomarkers of gastric cancer for personalized medicine. Diagn. Mol. Pathol. 2013; 22; 127–137. [DOI] [PubMed] [Google Scholar]
- 16. Behrens HM, Warneke VS, Böger C et al Reproducibility of HER2/neu scoring in gastric cancer and assessment of the 10% cut‐off rule. Cancer Med. 2015; 4; 235–244. [DOI] [PMC free article] [PubMed] [Google Scholar]
- 17. Graveel CR, Tolbert D, Vande Woude GF. MET: a critical player in tumorigenesis and therapeutic target. Cold Spring Harb. Perspect. Biol. 2013; 5; a009209. [DOI] [PMC free article] [PubMed] [Google Scholar]
- 18. Deng N, Goh LK, Wang H et al A comprehensive survey of genomic alterations in gastric cancer reveals systematic patterns of molecular exclusivity and co‐occurrence among distinct therapeutic targets. Gut 2012; 61; 673–684. [DOI] [PMC free article] [PubMed] [Google Scholar]
- 19. Morishita A, Gong J, Masaki T. Targeting receptor tyrosine kinases in gastric cancer. World J. Gastroenterol. 2014; 20; 4536–4545. [DOI] [PMC free article] [PubMed] [Google Scholar]
- 20. Betts G, Valentine H, Pritchard S et al FGFR2, HER2 and CMET in gastric adenocarcinoma: detection, prognostic significance and assessment of downstream pathway activation. Virchows Arch. 2014; 464; 145–156. [DOI] [PubMed] [Google Scholar]
- 21. Fuse N, Kuboki Y, Kuwata T et al Prognostic impact of HER2, EGFR, and C‐MET status on overall survival of advanced gastric cancer patients. Gastric Cancer 2015; doi:10.1007/s10120‐015‐0471‐6. [DOI] [PubMed] [Google Scholar]
- 22. Guo T, Yang J, Yao J, Zhang Y, Da M, Duan Y. Expression of MACC1 and c‐MET in human gastric cancer and its clinical significance. Cancer Cell Int. 2013; 13; 121. [DOI] [PMC free article] [PubMed] [Google Scholar]
- 23. Ha SY, Lee J, Kang SY et al Met overexpression assessed by new interpretation method predicts gene amplification and poor survival in advanced gastric carcinomas. Mod. Pathol. 2013; 26; 1632–1641. [DOI] [PubMed] [Google Scholar]
- 24. Ha SY, Lee J, Jang J et al HER2‐positive gastric cancer with concomitant MET and/or EGFR overexpression: a distinct subset of patients for dual inhibition therapy. Int. J. Cancer 2015; 136; 1629–1635. [DOI] [PubMed] [Google Scholar]
- 25. Huang TJ, Wang JY, Lin SR, Lian ST, Hsieh JS. Overexpression of the c‐MET protooncogene in human gastric carcinoma – correlation to clinical features. Acta Oncol. 2001; 40; 638–643. [DOI] [PubMed] [Google Scholar]
- 26. Kubicka S, Claas C, Staab S et al P53 mutation pattern and expression of c‐ERBB2 and c‐MET in gastric cancer: relation to histological subtypes, Helicobacter pylori infection, and prognosis. Dig. Dis. Sci. 2002; 47; 114–121. [DOI] [PubMed] [Google Scholar]
- 27. Kurokawa Y, Matsuura N, Kawabata R et al Prognostic impact of major receptor tyrosine kinase expression in gastric cancer. Ann. Surg. Oncol. 2014; 21(Suppl 4); 584–590. [DOI] [PubMed] [Google Scholar]
- 28. Lee HE, Kim MA, Lee HS et al Met in gastric carcinomas: comparison between protein expression and gene copy number and impact on clinical outcome. Br. J. Cancer 2012; 107; 325–333. [DOI] [PMC free article] [PubMed] [Google Scholar]
- 29. Li Y, Chen CQ, He YL et al Abnormal expression of e‐cadherin in tumor cells is associated with poor prognosis of gastric carcinoma. J. Surg. Oncol. 2012; 106; 304–310. [DOI] [PubMed] [Google Scholar]
- 30. Liu YJ, Shen D, Yin X et al HER2, MET and FGFR2 oncogenic driver alterations define distinct molecular segments for targeted therapies in gastric carcinoma. Br. J. Cancer 2014; 110; 1169–1178. [DOI] [PMC free article] [PubMed] [Google Scholar]
- 31. Nagatsuma AK, Aizawa M, Kuwata T et al Expression profiles of HER2, EGFR, MET and FGFR2 in a large cohort of patients with gastric adenocarcinoma. Gastric Cancer 2015; 18; 227–238. [DOI] [PubMed] [Google Scholar]
- 32. Nakajima M, Sawada H, Yamada Y et al The prognostic significance of amplification and overexpression of c‐MET and c‐ERB B‐2 in human gastric carcinomas. Cancer 1999; 85; 1894–1902. [DOI] [PubMed] [Google Scholar]
- 33. Taniguchi K, Yonemura Y, Nojima N et al The relation between the growth patterns of gastric carcinoma and the expression of hepatocyte growth factor receptor (c‐MET), autocrine motility factor receptor, and urokinase‐type plasminogen activator receptor. Cancer 1998; 82; 2112–2122. [PubMed] [Google Scholar]
- 34. Toiyama Y, Yasuda H, Saigusa S et al Co‐expression of hepatocyte growth factor and c‐MET predicts peritoneal dissemination established by autocrine hepatocyte growth factor/c‐MET signaling in gastric cancer. Int. J. Cancer 2012; 130; 2912–2921. [DOI] [PubMed] [Google Scholar]
- 35. Wu JG, Yu JW, Wu HB et al Expressions and clinical significances of c‐MET, p‐MET and E2F‐1 in human gastric carcinoma. BMC Res Notes 2014; 7; 6. [DOI] [PMC free article] [PubMed] [Google Scholar]
- 36. Drebber U, Baldus SE, Nolden B et al The overexpression of c‐MET as a prognostic indicator for gastric carcinoma compared to p53 and p21 nuclear accumulation. Oncol. Rep. 2008; 19; 1477–1483. [PubMed] [Google Scholar]
- 37. Graziano F, Galluccio N, Lorenzini P et al Genetic activation of the met pathway and prognosis of patients with high‐risk, radically resected gastric cancer. J. Clin. Oncol. 2011; 29; 4789–4795. [DOI] [PubMed] [Google Scholar]
- 38. Lee J, Seo JW, Jun HJ et al Impact of MET amplification on gastric cancer: possible roles as a novel prognostic marker and a potential therapeutic target. Oncol. Rep. 2011; 25; 1517–1524. [DOI] [PubMed] [Google Scholar]
- 39. Catenacci DV, Cervantes G, Yala S et al Ron (MST1R) is a novel prognostic marker and therapeutic target for gastroesophageal adenocarcinoma. Cancer Biol. Ther. 2011; 12; 9–46. [DOI] [PMC free article] [PubMed] [Google Scholar]
- 40. Warneke VS, Behrens HM, Boger C et al HER2/neu testing in gastric cancer: evaluating the risk of sampling errors. Ann. Oncol. 2013; 24; 725–733. [DOI] [PMC free article] [PubMed] [Google Scholar]
- 41. Watson S, Validire P, Cervera P et al Combined HER2 analysis of biopsies and surgical specimens to optimize detection of trastuzumab‐eligible patients in eso‐gastric adenocarcinoma: a GERCOR study. Ann. Oncol. 2013; 24; 3035–3039. [DOI] [PubMed] [Google Scholar]
- 42. Cancer Genome Atlas Research Network . Comprehensive molecular characterization of gastric adenocarcinoma. Nature 2014; 513; 202–209. [DOI] [PMC free article] [PubMed] [Google Scholar]
- 43. Wang K, Yuen ST, Xu J et al Whole‐genome sequencing and comprehensive molecular profiling identify new driver mutations in gastric cancer. Nat. Genet. 2014; 46; 573–582. [DOI] [PubMed] [Google Scholar]
Associated Data
This section collects any data citations, data availability statements, or supplementary materials included in this article.
Supplementary Materials
Figure S1. Hepatocyte growth factor receptor (MET)‐immunostaining in gastric cancer. Immunostaining [MET immunohistochemistry (IHC)] was evaluated according to the HistoScore (Hscore). The first parameter documented the intensity of the stained cells: no evidence of immunostaining (MET‐IHC 0; A), mild (cMET‐IHC1+; B), moderate (MET‐IHC 2+; C) or strong immunostaining (MET‐IHC 3+; D). The second parameter (P) estimates the distribution of the stained cells in percentage (x‐axis). The sum total of all staining intensities found in a single case always added to a total Hscore of 100% according to the following formula: P (MET‐IHC 0) + P (MET‐IHC 1+) + P (MET‐IHC 2+) + P (MET‐IHC 3+) = 100% (also see Figure 2). The prevalence of the percentage areas of the four different immunostainings found in our gastric cancer cohort is shown on the y‐axis. The figure also demonstrates the heterogeneity of MET immunostaining in gastric cancer.