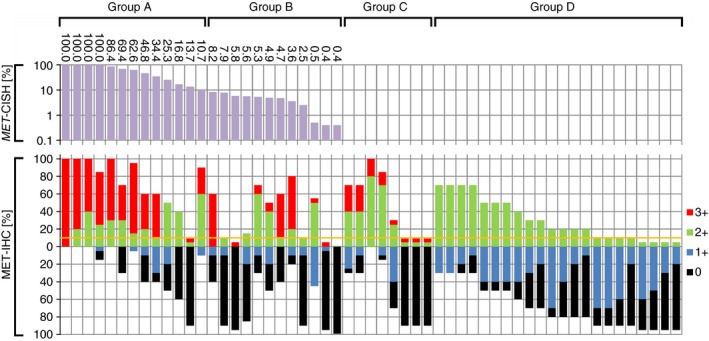
Figure 2.

Waterfall‐plot illustrating the distribution of MET amplification and hepatocyte growth factor receptor (MET) immunostaining among 55 patients. The waterfall plot shows case‐by‐case the results of chromogenic in‐situ hybridization (MET‐ CISH; logarithmic data presentation), and immunohistochemistry (MET‐IHC; liner data presentation) for patients belonging to group A (≥10% MET amplification), group B (<10% MET amplification), group C (MET‐IHC 3+ without MET amplification) and group D (MET‐IHC 2+ without MET amplification). Note that the different colours at the bottom illustrate the different staining intensities: MET‐IHC 3+ (red), MET‐IHC 2+ (green), MET‐IHC 1+ (blue) and MET‐IHC 0 (black). The sum total of all staining intensities found in a single case always added to a total HistoScore (Hscore) of 100% according to the following formula: P (MET‐IHC 0) + P (MET‐IHC 1+) + P (MET‐IHC 2+) + P (MET‐IHC 3+) = 100%. The yellow line marks a 10% cutoff, which is used, for example, to classify HER2/neu as either positive (above) or negative (below).
