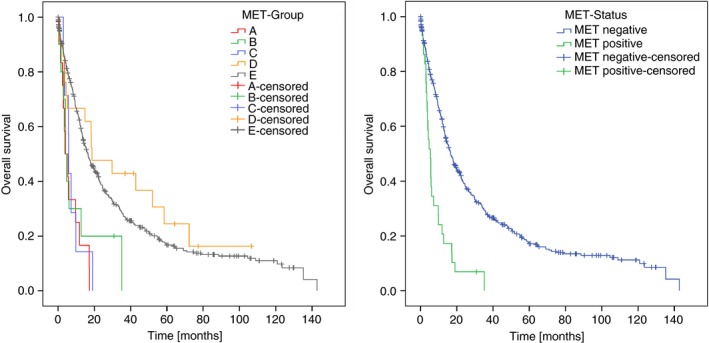
Figure 3.

Kaplan–Meier curves depicting patients’ survival. Patients were categorized into five hepatocyte growth factor receptor (MET) groups (A): ≥10% MET‐amplified tumour area (group A), <10% MET‐amplified tumour area (group B), MET‐IHC 3+ and ‐unamplified (group C), MET‐IHC 2+ and unamplified (group D), and MET‐IHC 1+ or MET‐IHC 0 (group E). Subsequently, groups A–C were classified as MET‐positive and groups D–E as MET‐negative (B).
