

Abstract
Cancer stem cells (CSCs) are thought to be resistant to standard chemotherapeutic drugs and the inimical conditions of the tumor microenvironment. Obtaining CSCs in sufficient quantities and maintaining their undifferentiated state have been major hurdles to their further characterization and to the identification of new pharmaceuticals that preferentially target these cells. We describe here the tagging of CSC-like populations from four human breast cancer cell lines with green fluorescent protein (GFP) under the control of the Oct3/4 stem cell-specific promoter. As expected, GFP was expressed by the CSC-enriched populations. An unanticipated result, however, was that these cells remained blocked in a CSC-like state and tended to be resistant to chemotherapeutic drugs as well as acidotic and hypoxic conditions. These CSC-like cells possessed several other in vitro attributes of CSCs and were able to reproducibly generate tumors in immuno-compromised mice from as few as 100 cells. Moreover, the tumors derived from these cells were comprised almost exclusively of pure CSCs. The ability of the Oct3/4 promoter to block CSC differentiation underscores its potential general utility for obtaining highly purified CSC populations, although the mechanism by which it does so remains undefined and subject to further study. Nonetheless, such stable cell lines should be extremely valuable tools for studying basic questions pertaining to CSC biology and for the initial identification of novel CSC-specific chemotherapeutic agents, which can then be verified in primary CSCs.
Keywords: Oct3/4, cancer stem cells, chemotherapy, tumor microenvironment
INTRODUCTION
Cancer stem cells (CSCs) are believed to be capable of making a binary choice between unlimited self-renewal or differentiation into highly proliferative “transit amplifying cells” (TACs) with a limited life span [1-3]. This model, based on that of the hematopoietic system [2-4], postulates that CSCs divide infrequently but remain sufficiently abundant so as to provide a continuous reservoir. As a result of these differential self-renewal and replicative potentials, CSCs are much more efficient than TACs at initiating new tumors and better retain the capacity for serial passage. TACS, in contrast, rapidly proliferate but initiate new tumors inefficiently and do not survive serial passage. The model also predicts that, as a result of the disparate proliferative differences between CSCs and TACs, the bulk of most tumors will consist of the latter cells, even when the initial inoculum consists exclusively of CSCs. Minority cell populations with CSC-like properties, have been identified in a number of solid tumors [5-12]. In addition to their functional differences, they can be distinguished from their TAC counterparts by various cell surface markers and biochemical and molecular properties [5,12-15]. Specifically, CSCs may possess transcriptional profiles distinct from those of TACs and, in some cases, similar to those of embryonic tissues or cancer cells undergoing an epithelial-to-mesenchymal transition (EMT) [14,16-22].
Individuals whose tumors contain high numbers of CSCs may experience inferior disease-free intervals and cure rates following therapy [13,19]. CSCs and TACs may also be differentially sensitive to chemotherapeutic drugs and/or radiation although the extent to which this occurs varies widely [11,18,23-32]. Because the majority of tumor cells are TACs, chemotherapeutic drugs that target these cells may cause tumor regression but not durable cures unless the CSC population is concurrently eliminated. Indeed, in its purest form, the CSC hypothesis implies that only CSCs need be eradicated since TACs will eventually be lost through attrition [2].
CSCs have also been postulated to be more resistant to the hypoxic and acidotic tumor microenvironment [28]. Metastases have been proposed to arise from circulating CSCs or from tumor cells with embryonal- or mesenchymal-like properties [33-35].
There are several limitations to studying CSCs. First, because they are generally quite rare [1,2,36,37], their isolation can be challenging, particularly since CSCs from similar tumors are not necessarily identical [18,38]. Second, the tendency of CSCs to differentiate into TACs can compromise attempts to maintain and expand initially homogenous populations of the former cells. Moreover, most isolation schemes thus far described generally only enrich for CSCs but do not yield pure populations [2].
We describe here the unexpected isolation of breast cancer CSC-like cells that are unable to differentiate into mature TAC-like progeny. These cells are characterized by chemo-resistance, survival in hypoxic and acidotic environments, and by high tumor-initiating abilities. As such, they constitute valuable reagents for studying CSC-like properties in a homogeneous state and are powerful tools for identifying novel CSC-selective pharmaceuticals.
MATERIALS AND METHODS
Cell Lines
MCF7 cells were obtained from the American Type Cultures Collection (ATCC, Manassas, VA) and were maintained in alpha modified Eagle's Minimal Essential Media (MEM) supplemented with 10% fetal bovine serum (FBS), 1 mM sodium pyruvate, 100 μM non-essential amino acids, 100 units/ml Penicillin G and 100 μg/ml Streptomycin (Pen/Strep). MDA-MB231 cells were a gift from Dr. Max Wicha (University of Michigan Medical School) and were maintained in the same medium. MDA-MB453 cells (also from M. Wicha) were maintained in Dulbecco's Modified MEM (D-MEM) supplemented with 10% FBS. JL-BTL12 cells were established from the direct culture of a stage III, ER+,PR+, Her2- chemotherapy and radiation naïve tumor and can be obtained upon request from JLL. They were maintained on 1% gelatin-coated plates in WMRI specialty media supplemented with 20% FBS and 1 mM β–mercaptoethanol. The histological subtypes of the tumors from which cell lines were derived, their estrogen and progesterone receptor and HER2/NEU gene status, and their previous therapy histories are summarized in Supporting Information Table 1. These cell are available upon request from JLL. Primary human foreskin fibroblasts (HFFs) were obtained from the ATCC and were cultured in Iscove's modification of D-MEM supplemented with 10% FBS, non-essential amino acids and Pen/Strep. All media and chemical supplements were obtained from Mediatech (Manassas, VA) and serum supplement was obtained from Atlanta Biological (Atlanta, GA).
Oct3/4-GFP Plasmid Transfections and Isolation of GFP+ Cells
The Oct3/4-GFP vector, consisting of 4.0 kb of human Oct3/4 promoter sequence driving the expression of enhanced green fluorescent protein (GFP) in the phOCT3-EGFP1 vector, was a kind gift from Dr. Wei Cui (Imperial College, London, UK) [39]. Stable transfections were performed by electroporation. Briefly, 10 μg of ApaLI-linearized plasmid DNA was mixed with 107 tumor cells in 0.5 ml of PBS and placed in a 4 mm electroporation cuvette (FisherBiotec, Subiaco, WA). After chilling briefly on ice, the cuvette was subjected to a 160 kV shock in a Biorad GenePulser electroporation apparatus with the capacitance extender set to 960 μF. This was followed by a 10 minute incubation on ice. The cells were then seeded into a 150 mm tissue culture plate containing 30 ml of warm medium and incubated for 48 hours before adding G418 (Mediatech) to a final concentration of 0.5 mg/ml. G418-containing medium was then changed every 3-4 days. The several hundred G-418-resistant colonies arising from each transfection were pooled and evaluated for GFP expression either by UV microscopy or flow cytometry as previously described [40]. GFP+ and GFP- cells were simultaneously separated by fluorescence-activated cell sorting (FACS) using a FACSAria flow cytometer as previously described [40] and expanded in G418-containing growth medium. Cells were periodically subjected to flow cytometry to evaluate the fraction of GFP+ cells.
CD44 and CD24 Staining
Immuno-staining of breast cancer cells lines was performed with an allophycocyanin-labeled monoclonal antibody (mAb) against CD44 and a phycoerythrin-labeled mAb against CD24 (Cat nos. 55942 and 555428: BD Biosciences, Inc. Franklin Lakes, NJ). Staining was performed using conditions recommended by the supplier. Quantification of staining was performed using a Becton-Dickinson FACSCalibur flow cytometer. The purification of CD44hi/CD24lo cells was performed with a FACSAria flow cytometer using filter settings of 520/550-FITC(GFP), 575/625-phycoerythrin, 670/830-allophycocyanin. For plating of individual CD44hi/CD24lo cells into 96 well plates, we used a Beckman Coulter MoFlo fluorescence-activated cell sorter (Fullerton CA) using filter settings at 585/625-phycoerythrin and 660/830-allophycocyanin. These plates were monitored daily and the time to appearance of macroscopically visible colonies was noted.
Quantitative Real-Time RT-PCR (qRT-PCR)
Total RNAs were purified using RNAeasy columns (Qiagen, Inc. Valencia, CA) and were treated with Turbo DNAse as recommended (Ambion/Applied Biosystems, Foster City, CA). qRT-PCR primers were synthesized by International DNA Technologies, Inc. (Coralville, IA) based on sequences obtained from previously validated primers (http://pga,mgh.harvard.edu/primerbank) or by using the Primer3 prediction algorithm (http://frodo.wi.mit.edu/primer3). In one case (BMI1), PCR primers were purchased from SuperArray BioScience Corp. (Frederick, MD). Except for the latter, primer sequences are listed in Supporting Information Table 2. qRT-PCRs were performed on triplicate samples with 50 ng/sample of total RNA and approximately 12 pmole of each primer using a SYBR-Green-based detection system with the conditions recommended by the supplier (Quantitect, Qiagen) Roche LightCycler 2.0 (Roche Applied Science, Nutley, NJ). Calculated mean Cτ values for each primer set were normalized to those obtained for the housekeeping gene GAPDH as previously described [40]. To ensure primer specificities, representative qRT-PCR products were electrophoresed in 2% agarose or 4% NuSieve agarose (Fisher Scientific, Pittsburgh, PA) to confirm amplification of properly sized bands.
Exposure to Chemotherapeutic Drugs and Acidotic and Hypoxic Conditions
The following drugs were used to test the in vitro sensitivities to chemotherapeutic agents: adriamycin, cis-platinum, etoposide, 5-fluorouracil, methotrexate, and taxol (Sigma-Aldrich, St. Louis, MO). Each compound was reconstituted in sterile water or dimethyl sulfoxide and frozen at −20C in concentrated aliquots of 5-10 mM each. For each experiment, a fresh aliquot was diluted in tissue culture medium to the desired concentration. To determine the relative sensitivities of MCF7 CSCs and non-CSCs, they were seeded the day before in 12 well plates. The average number of viable cells/well was then determined on triplicate wells by manual counting of trypan blue-stained cells. The medium was replaced with fresh medium containing the indicated concentration of each compound. Over the next several days, the total number of viable cells was determined in the same manner. In experiments performed on other cell lines, GFP+ CSC-like and GFP- non-CSC-like cells were mixed at ca. 1:30 ratios and allowed to attach and grow for 1-2 days. The medium was then replaced with fresh medium containing the appropriate concentration of chemotherapeutic drug. Cells were incubated for 3 days, washed free of drug, and returned to drug-free standard growth medium for the remainder of the experiment. After attaining log-phase growth, the GFP+/GFP- ratio was again determined. From these internally controlled studies, the relative sensitivities of each CSC-like population could be calculated. Control experiments with untreated cells showed that the GFP+/GFP- ratios did not change significantly over the course of the study.
The sensitivity of each cell line to acidotic conditions was performed as described above for chemotherapeutic drugs sensitivities except that, after the initial plating and attainment of log-phase growth, the cells were exposed to fresh medium that had been adjusted to the desired pH. Exposure to moderate hypoxia (1% O2) was performed by initially growing the freshly plated cells as described above and then placing them into a hypoxic chamber O2 Control Tissue Culture Box (Coy Laboratory, Grass Lake, MI).
H&E Staining and Cell Size Determinations
Standard hematoxylin/eosin staining was performed on cells grown for at least 2 days on glass coverslips (18mm round, no.1, VWR Scientific, West Chester, PA). Light microscopy and image capture was performed on a Zeiss Axiovert 135 light microscope outfitted with Sony DXC-970MD digital camera.
Cell size determinations were performed on a Vi-Cell cell viability analyzer (BD, Inc.) [40]. Measurements of at least 5000 individual viable cells in log-phase growth, representing determinations from 3-5 independent samples, were combined to generate the final histograms.
In Vivo Tumorigenesis Studies and Re-Growth of GFP+ Tumor Cells
All studies were reviewed and approved by The University of Pittsburgh's Institutional Animal Use and Care Committee. 6-8 week old nu/nu mice were purchased from Harland Laboratories (Indianapolis, IN). They were housed under sterile, germ-free conditions with 12 hr day-night cycles and allowed access to feed and water ad libitum. Animals were inoculated subcutaneously in the flank with the indicated number of tumor cells in PBS. They were monitored at least twice weekly and were sacrificed when tumors reached an average diameter of ca. 2 cm. In some cases, tumors were removed for subsequent histopathological and immunohistochemical evaluation or in vitro propagation. In the latter case, they were minced in sterile tissue culture medium lacking FBS, digested at 37C for 30 minutes with trypsin and collagenase A, ticturated several times through a 27g needle, and then plated in fresh medium containing 10% FBS and 0.5 mg/ml G418. After at least two weeks of growth to eliminate all host-derived cells, cells were evaluated by UV microscopy and flow cytometry.
RESULTS
Retention of Stem Cell Markers
We initially asked how long isolated breast cancer CSCs would maintain their phenotype. We separated the CD44hi/CD24lo CSC-enriched population of MCF7 cells [5,27] and plated individual cells into 96 well dishes. As controls, cells from the CD44hi/CD24lo-depleted population were similarly plated. We noted the appearance of macroscopically visible colonies, expanded at least 15 of these from the CD44hi/CD24lo set, and reassessed these for CD44/CD24 expression. As shown in Supporting Information Fig. 1A, approximately 1% of the initial MCF7 population could be classified as CSCs or CSC-like based on CD44/CD24 profiling. These cells were somewhat slower and less efficient than CD44hiCD24lo-depleted cells at generating colonies (Supporting Information Fig. 1B). Moreover, after only 4-5 weeks, the cell surface marker profiles of the individual clones had reverted to that of the original uncloned MCF7 population (Supporting Information Fig. 1C). In related experiments, the CD44hi/CD24lo population from a second breast cancer cell line, MDA-MB453, followed a similar fate (Supporting Information Fig. 1D&E). Thus, as predicted from the CSC model, isolated CD44hi/CD24lo breast cancer cells only transiently retain this phenotype and eventually revert to an equilibrium state in which the expanded population regains the cell surface profile of the original cell line.
Differentiation of the CSC-Like Population Can be Blocked
To allow CSC-like cell differentiation to be followed more conveniently, we sought to develop an independent, simple, and quantitative means of monitoring their fate. We stably transfected MCF7 cells with a plasmid encoding GFP driven by a 4.0 kb segment of the Oct3/4 promoter, which is selectively expressed by some CSC and embryonic stem (ES) cell populations [39,41,42]. We postulated that, if expression of the vector served as a true marker of CSCs, then GFP+ cells should comprise a small minority of stable transfectants and should track with the CD44hi/CD24lo phenotype. Indeed, we found GFP to be expressed by ca. 1% of stably transfected cells (Fig. 1A). Closer examination of this population showed it to be comprised predominantly of CD44hi/CD24lo cells (Fig. 1B). In reciprocal experiments, the CD44hi/CD24lo population from the cells shown in Fig. 1A, was found to be largely GFP+ (Fig. 1C). Similar results were obtained repeatedly with independently transfected populations of MCF7 cells (not shown).
Figure 1.
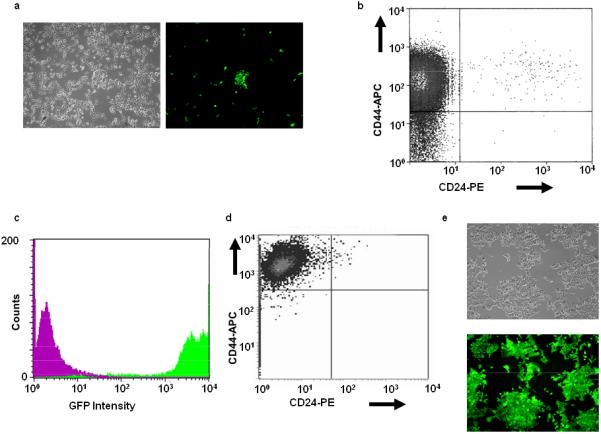
Characterization of Oct3/4-GFP-transfected MCF7 cells. MCF7 cells were transfected with a linearized plasmid encoding GFP under the control of the 4.0 kb Oct3/4 promoter and a G-418 resistance cassette [39]. (A): After selection in G-418, the same field of cells was visualized by light or UV microscopy (left and right panels, respectively). Note that only a small minority of cells were GFP+. (B): GFP+ cells (ca. 1% of the entire population) were isolated by FACS from the population shown in (A), briefly expanded, and then evaluated for CD44/CD24 expression. Note the predominantly CD44hi/CD24lo phenotype. (C): In the reciprocal experiment, CD44hi/CD24lo cells from (A) were isolated by FACS, expanded briefly, and then examined for the expression of GFP. Note the high-level expression of GFP (green curve) compared to that of a control CD44hi/CD24lo-depleted population (magenta curve). (D): Repeat analysis of the originally isolated GFP+ population from (B) performed six months later. (E): Light and UV microscopy of the cells from (D) showing essentially100% GFP positivity.
Based upon the findings shown in Supporting Information Fig. 1, we expected the percentage of GFP+/CD44hi/CD24lo cells to decline as CSCs differentiated. Unexpectedly, however, we found CD44hi staining and GFP expression to persist, with this population remaining stable for > 1 year (Fig. 1D&E). Thus, the stable incorporation of the Oct3/4-GFP vector appeared to block the differentiation of CSCs.
Tumorigenicity of CSC-Like MCF7 Cells
A hallmark of CSCs is their high tumor-initiating activity in immuno-compromised mice compared to non-CSCs [5,12,13,23]. We therefore asked whether CSC-like MCF7 cells were similarly more tumorigenic. Serial dilutions of these cells produced tumors in 3/3 animals inoculated with 500 cells, whereas animals inoculated with 3×10⁴ CD44hi/CD24lo-depleted cells failed to develop any tumors over a >3 month period. Thus, tumor initiation by CSC-like MCF7 cells in this initial study was conservatively estimated to be at least 60-fold greater than that of their non-CSC-like counterparts. Moreover, cells isolated from these tumors retained both GFP-positivity (Fig. 2A&B) and the CD44hi/CD24lo phenotype (Fig. 2C).
Figure 2.
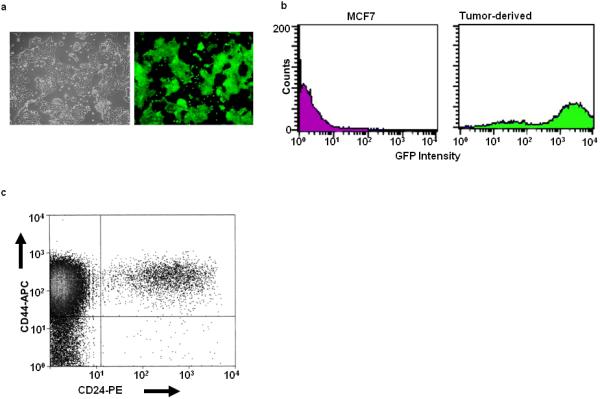
Phenotypic characterization of tumor-derived Oct3/4-GFP cells. Tumors arising in nu/nu mice inoculated with the CSC-like MCF7 cells shown in Fig. 1 were minced, dissociated with trypsin and collagenase, and propagated for 2-3 weeks in vitro in the presence of G418. (A): Visible light + UV low power microscopic views of a typical field showing GFP expression by the entire population of G418-resistant cells. (B): Flow cytometric evaluation of the re-cultured tumor-derived CSC-like cells confirming the expression of GFP by virtually the entire population (green curve). CD44hi/CD24lo-depleted cells were included as a negative control (magenta curve). (C): CD44/CD24 staining showing that the tumor-derived cells shown in (A) retained the CD44hi/CD24lo phenotype.
CSC-Like MCF7 Cells are Inherently Resistant to Most Chemotherapeutic Drugs
CSCs have been proposed to be more chemo-resistant than non-CSCs [11,18,23,25,26,28-30,33,38,43]. We therefore exposed both cell populations to six drugs commonly used to treat breast cancer and found the CSC-like cells to be resistant in five cases (Fig. 3). The exception was seen with taxol, which showed modest selective killing of the CSC-like population. In other internally controlled experiments, we employed a “single-step” selection method in which GFP+ CSC-like cells were co-cultivated with a ca. 40-fold excess of non-CSC-like cells, exposed to adriamycin or etoposide for 3 days, and allowed to recover in drug-free medium. The proportion of GFP+ cells was then determined in the surviving populations. In each case, a >30-fold increase of this population was obtained (Supporting Information Fig. 2). In contrast, unexposed cultures retained the initial GFP+:GFP- ratio, indicating that, in the absence of drugs, the former cells possessed no particular growth or survival advantage (not shown).
Figure 3.
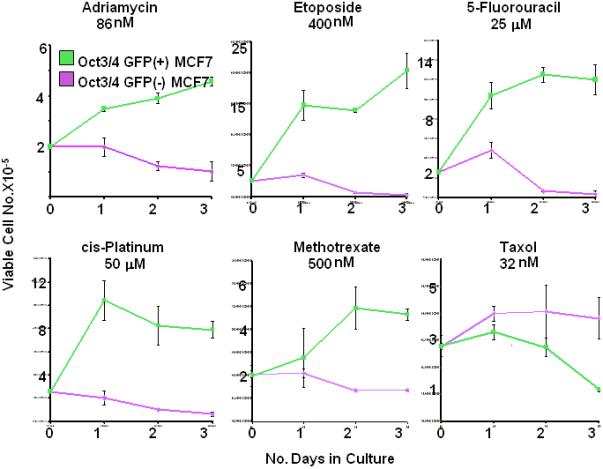
Differential chemotherapeutic sensitivities of blocked CSC-like MCF7 cells. Equivalent numbers of the CSC-like MCF7 cells or CSC-like depleted cells shown in Fig. 1 were seeded into 6 well plates at a final concentration of 2 × 10⁵ cells/ well. The following day, (day 0) the cells were counted to ensure that comparable numbers from the two groups had survived. The medium on the remaining wells was replaced with fresh medium containing the indicated concentration of chemotherapeutic drug. Total viable cell counts were then performed on triplicate wells over the ensuing 3 days. Each point represents the average number of viable cells/well +/- 1 S.E. Abbreviation: S.E., standard error.
Isolation of Blocked CSC-Like Populations From Other Breast Cancer Cell Lines
In addition to MCF7 cells, we also tested three other breast cancer-derived cell lines to determine if the Oct3/4-GFP vector could block the differentiation of CSC-like populations. These included the MDA-MB453 and MDA-MB231 cell lines, derived from pericardial and pleural effusions of breast adenocarcinomas, respectively, and the JL-BTL12 cell line derived from a ductal adenoarcinoma primary tumor (Supporting Information Table 1). GFP+ populations were detected at frequencies of 4-15% following stable transfection with the linearized Oct3/4-GFP vector (Supporting Information Table 1).
Further assessment of the GFP+ populations from the above cell lines was initially hampered by several factors. One was the fact that >90% of the starting MDA-MB231 and JL-BTL12 cells strongly expressed CD44, thus precluding characterization of their CSC-like properties by standard cell surface immuno-phenotyping (Supporting Information Table 1). A second difficulty was that many of the initially isolated GFP+ cells from Oct3/4-GFP-transfected MDA-MB453 cells and JL-BTL12 cells gradually lost their fluorescence. This suggested either that the CSC population was not truly blocked or that the initially isolated GFP+ population might itself be comprised of both blocked CSCs and more mature differentiation-competent cells. This latter possibility was supported by the finding that only ca. 1% of the MDA-MB453 cells were CD44hi/CD24lo (Supporting Information Table 1). We used different methods to distinguish between these mutually exclusive possibilities and to isolate stable GFP+ populations.
In the case of MDA-MB231 cells, the GFP+ population was subjected to two additional rounds of FACS. This removed cells that had reverted to a GFP- phenotype and eventually permitted the isolation of a stable GFP+ population. In the case of MDA-MB453 cells, the unsorted population was exposed to 5-fluoruracil (5-FU) for 3 days and surviving cells were allowed to recover as described in Supporting Information Fig. 2. On three separate occasions, this resulted in the outgrowth of a nearly 100% pure GFP+ population that stably retained this property. We refer to these below as MDA-MB453-5FU cells. Finally, GFP+ JL-BTL12 cells were isolated from tumor xenografts and re-selected in G418-containing medium. As had been seen with similarly selected MCF7 cells (Fig. 2), the in vivo selected JL-BTL12 cells (JL-BTL12t cells) were 100% GFP+ and have remained so for >3 months (not shown).
Of the above three starting cell lines, only the MDA-MB453 cell line contained a sufficiently small CD44hi/CD24lo population (ca. 1%- Supporting Information Fig. 1D and Supporting Information Table 1) to allow this measurement to be used to assess putative CSC-like purity. In contrast, MDA-MB453-5FU cells were highly enriched for CD44hi/CD24lo staining, with >90% of this starting population possessing and stably retaining this phenotype, as well as high-level GFP expression, for >6 months (Supporting Information Fig. 3 and data not shown). These studies suggest that the original population of GFP+ MDA-MB453 cells was heterogeneous, although enriched for CD44hi/CD24lo CSC-like cells. They also explained why a substantial fraction of these cells eventually extinguished their expression of GFP. Selection of these cells by exposure to 5-FU thus allowed the preferential survival of a stable GFP+/CD44hi/CD24lo population.
Differentially Sensitivity of CSC-Like Cells to Chemotherapeutic Drugs, Acidosis and Hypoxia
As shown in Fig. 3, CSC-like MCF7 cells were resistant to several chemotherapeutic agents used to treat breast cancer. We therefore determined whether this was also true for GFP+ isolates of MDA-MD231, MDA-453-5FU, and JL-BTL12t CSC-like cell lines. For this purpose, we employed the single-step drug selection procedure described in Supporting Information Fig. 2. As shown in Fig. 4A, each CSC-like cell line showed a distinct pattern of chemo-sensitivity. For example, relative to their respective non-CSC-like cells, MDA-MB453-5FU cells were resistance only to 5-FU as expected. In contrast, MDA-MB 231 and JL-BTL12t CSC-like cells showed resistance to a larger number of drugs, although the identity of the drugs, the concentrations used, and the degree of eventual selection obtained differed (Fig. 4A and Supporting Information Table 3). The CSC-like population from each breast cancer cell line thus possesses a signature pattern of chemo-resistance that distinguishes it from its non-CSC-like counterparts, as well as from CSC-like cells derived from other cell lines. In other experiments, designed to evaluate the dose-response profiles of the above cell lines, we confirmed the relative resistance patterns of the CSC-like populations to the above chemotherapeutic agents relative to those of their non-CSC counterparts (not shown).
Figure 4.
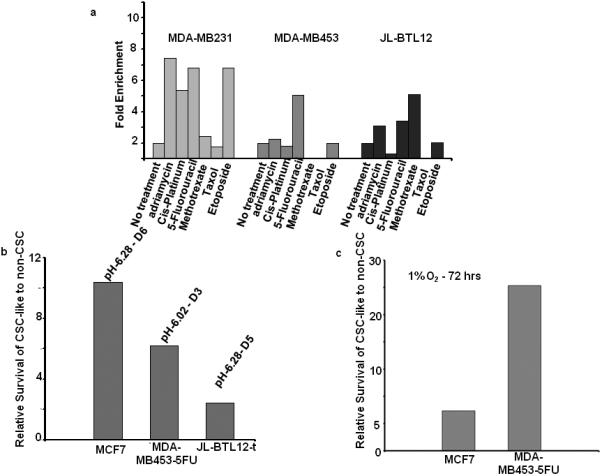
Differential sensitivities of CSC-like cells to chemotherapeutic drugs, acidosis, and hypoxia. Each of the above-described GFP+ CSC-like cell lines was mixed with its GFP- non-CSC-like counterparts at a ca. 1:20 ratio and seeded into 6 well plates for all subsequent studies (A): Chemotherapeutic resistance. Cell monolayers at ca. 50% confluency were exposed to the indicated chemotherapeutic drugs for 3 days (Supporting Information Table 3), washed, and then maintained and expanded in drug-free medium for the remainder of the study. After 2-3 weeks of recovery, the surviving populations were assessed for GFP content by flow cytometry. Note that GFP+ MDA-MB453-5FU cells were resistant only to 5-FU whereas GFP+ MDA-MB231 cells and GFP+ JLBTL12t cells were resistant to a larger number of drugs, as had been previously seen with MCF7 cells (Fig. 3). Each cell line showed a distinct profile of drug resistance and were maximally resistant to different drug concentrations (Supporting Information Table 3). In all cases, control incubations performed in the absence of any cytotoxic agents (“No Treatment”) showed that the relative ratios of GFP+ and GFP- cells remained constant over the course of the study. (B): Resistance to acidotic conditions. GFP+ CSC-like and GFP- non-CSC-like populations from the indicated cell lines were mixed at the ca. 1:20 ratios described above and seeded. The following day, standard growth medium, adjusted to the indicated pH's, was added for 5 d. Cells were then re-cultured in standard growth medium (pH=7.40) and allowed to recover for 1-2 wks at which point the % of GFP+ CSC-like cells was again assessed by flow cytometry. (C): Resistance to hypoxia. Cells were plated as described in (A) and (B) and allowed to attach. The following day, they were placed in a moderately hypoxic atmosphere (1% O2) and maintained for 5 days before being returned to normoxic conditions. After the cells had achieved log-phase growth, the percent of GFP-positive cells was again assessed cytometrically.
CSCs have also been proposed to be resistant to the acidotic and hypoxic conditions of the tumor microenvironment [11,19,23,32,33]. However, as with chemo-resistance, it has been difficult to test this idea due to the transient nature of isolated CSC phenotypes. The availability of blocked CSCs provided an opportunity to test this hypothesis with more stable cellular populations. As shown in Fig. 4B, three of the four CSC-like lines were resistant to acidotic conditions, although the extent of the effect and the optimal pH at which it occurred differed. Similarly, two of the four lines were also variably resistant to moderate hypoxia (1% O2-Fig. 4C). Taken together, our studies indicate that both the qualitative and quantitative behaviors of each set of CSC-like cells in response to cytotoxic compounds, acidosis, and hypoxia are generally distinct from their non-CSC counterparts and other similarly-derived CSC-like cells.
Distinct In Vitro Growth Patterns and Morphologies of CSC-Like Cells
Previous studies have shown that CSCs in primary breast cancers often reside in small foci [13]. While studying mixed populations of GFP+ CSC-like and GFP- non-CSC-like cells for the studies described above, we noted that evenly-dispersed populations of CSC-like and non-CSC-like cells eventually segregated into well-demarcated islands comprised exclusively of their respective cell type (Fig. 5A and Supporting Information Fig. 4A).
Figure 5.
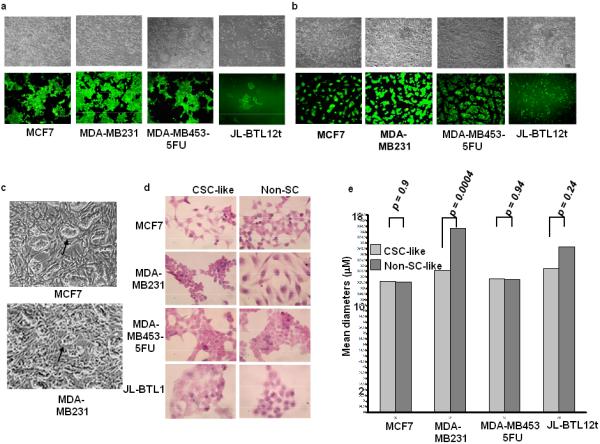
In vitro segregation and distinct morphologies of CSC-like cells. (A): CSC-like and non-CSC-like cells from the indicated tumor lines were mixed at a ca. 1:10 ratio and seeded at low density (ca. 2 × 10⁴ total cells/well) into 6 well plates. Microscopic inspection the following day showed well-dispersed individual cells (not shown). Incubations were continued for an additional 5-7 days and both phase-contrast and UV microscopic photos were concurrently obtained. Each set of images shows the same field. (B): GFP+ CSC-like cells from each of the indicated cell lines were seeded at a ca. 1:10 ratio with HFFs and allowed to grow for 1-2 days at which point they were imaged using standard visible light or UV microscopy. Note that, in three cases, the CSC-like population formed distinct colonies upon the HFF feeder layer. Non-CSC-like populations tagged with a promiscuously expressed GFP vector did not show such a pattern when co-cultured with HFFs (Supporting Information Fig. 5B). (C): Higher power phase contrast images of MCF7 and MDA-MB231 colonies from (B) showing distinct growth patterns of CSC-like cells atop HFFs (arrows). (D): Histologic differences between CSC-like and non-CSC-like populations. The indicated cells were plated onto glass coverslips and propagated for 1-2 days before being fixed and stained under standard conditions with H&E. (E): Size determinations of CSC-like and non-CSC-like populations. Logarithmically growing cells of the indicated type were stained with trypan blue. Viable cells were then sized on a Vi-Cell viability analyzer as previously described [40]. At least 5000 cells of each type were analyzed on a minimum of three separate occasions. Numbers above each curve indicate the mean diameter of each cell type. p values were calculated using Student's paired t-test and the Vi-Cell software package provided by the company. Abbreviation: HFF, human foreskin fibroblasts.
ES cells, co-cultured with feeder layers of fibroblasts, form distinct colonies [44]. We thus asked whether the CSC-like cells described here also possessed this property. We plated primary human foreskin fibroblasts (HFFs) together with GFP+ CSC-like cells and examined these cultures over the course of ca. 1-2 days. As seen in Fig. 5B and Supporting Information Fig. 5A, the CSC-like populations from MCF7 cells, MDA-MB453-5-FU cells, and MDA-MD231 cells formed distinct islands atop the HFFs; in two cases, these could also be detected by visible light microscopy (Fig. 5C). In contrast, GFP-tagged non-CSCs remained dispersed, and could not be readily distinguished by light microscopy from HFFs (Supporting Information Fig. 5B).
Normal breast epithelial stem cells as well as CSCs from some established breast cancer cell lines also have the ability to proliferate as non-adherent spherical clusters, termed mammospheres. In contrast, non-stem cells from these sources either do not propagate or tend to form irregular aggregates (45-49). When evaluated in this type of assay, MCF7, MDA-MB453, and MDA-MB231 CSC-like cells were significantly better at forming mammospheres than their non-CSC-like counterparts (Supporting Information Fig. 6).
In some cases, in vitro-propagated CSC-like cells were morphologically distinct from non-CSC-like cells based on hematoxylin-eosin (H&E) staining. For example, CSC-like cells of both MCF7 and MDA-MB231 origin appeared more rounded and stained more intensely than the parental populations. The latter cells also appeared smaller and exhibited both a higher nuclear:cytoplasmic ratio and a less reticulated cytoplasm. In contrast, JL-BTL12t CSC-like cells contained less prominent nuclei and a lower nuclear:cytoplasmic ratio (Fig. 5D). Direct measurements of cell diameters also indicated that MDA-MB231 CSC-like cells were significantly smaller than those of their non-CSC-like counterparts (Fig. 5E). Thus, within a given tumor cell type, some CSC-like and non-CSC-like cells can be distinguished from one another based solely on morphologic criteria.
Distinct Transcript Patterns of CSC-Like Populations
A number of CSCs, including those from breast cancers, possess transcriptional profiles resembling those of ES cells or tumor cells undergoing an EMT [13,19,21,43,50-54]. To determine whether the CSC-like populations described here behaved similarly, we assessed the expression of 12 CSC-, ES-, and EMT-specific transcripts. As shown in Table 1, many of these markers were elevated in the four CSC-like populations. Although each one expressed a distinct profile, we identified a common overlapping group of three transcripts consisting of ABCG2, SNAIL, and SOX1 whose average up-regulation was 5.5-, 7.9-, and 4.5-fold, respectively.
Table 1.
Transcriptional profiling of CSC-like cell lines.
| Name of Cell Line | Name of Transcript | Fold Difference: CSC-like vs. non-CSCS-like* | p value** |
|---|---|---|---|
| MCF7 | ABCG2 | 5.8 | 0.0001 |
| ALDH1 | 4.0 | 0.0001 | |
| BMI1 | 3.2 | 0.0002 | |
| COL1A2 | 3.3 | 0.0001 | |
| FBN1 | ∞ (not expressed in non CSCs) | - | |
| NANOG | 2.4 | 0.0005 | |
| NOTCH1 | 3.1 | 0.0004 | |
| ONZIN/PLAC8 | 2.3 | 0.0008 | |
| SNAIL | 2.3 | 0.001 | |
| SOX1 | 6.0 | 0.0001 | |
| MDA-MB231 | ABCG2 | 3.6 | 0.0019 |
| CD133 | 552 | 0.0001 | |
| COL1A2 | 2.3 | 0.0001 | |
| NANOG | 3.9 | 0.0007 | |
| ONZIN/PLAC8 | 7.1 | 0.0003 | |
| SNAIL | 1.5 | 0.02 | |
| SOX1 | 2.1 | 0.009 | |
| MDA-MB453-5FU | ABCG2 | 2.4 | 0.0004 |
| CD133 | 16.0 | 0.003 | |
| NANOG | 1.53 | 0.004 | |
| SNAIL | 1.69 | 0.003 | |
| SOX1 | 2.2 | 0.001 | |
| JL-BTL12t*** | ABCG2 | 10.1 | 0.0003 |
| ALDH1 | 30.2 | 0.0001 | |
| BMI1 | 8.3 | 0.0002 | |
| CD133 | 59.9 | 0.0002 | |
| FBN1 | 14.3 | 0.0001 | |
| NOTCH1 | 10.7 | 0.0001 | |
| ONZIN/PLAC8 | 2.1 | 0.0093 | |
| SNAIL | 26 | 0.0004 | |
| SOX1 | 7.6 | 0.0003 | |
| MCF7t*** | ABCG2 | 6.0 | 0.0001 |
| ALDH1 | 3.2 | 0.0001 | |
| BMI1 | 2.8 | 0.0001 | |
| NANOG | 2.5 | 0.0005 | |
| NOTCH1 | 3.2 | 0.0002 | |
| ONZIN/PLAC8 | 2.4 | 0.0002 | |
| SNAIL | 2.0 | 0.0001 | |
| SOX1 | 5.8 | 0.0001 | |
| MDA-MB231t*** | ABCG2 | 6.4 | 0.0004 |
| CD133 | 140 | 0.0001 | |
| COL1A2 | 860 | 0.0001 | |
| NANOG | 22 | 0.006 | |
| ONZIN/PLAC8 | 14.1 | 0.0001 | |
Each of the indicated cell lines was assessed by qRT-PCR as previously described54 for expression of the following CSC-, ES-, or EMT-associated transcripts: ABCG2, ALDH1, BMI1, CD133, COL1A1, FBN, NANOG, NOTCH1, ONZIN/PLAC8, SNAIL, THY-1, and SOX1. See Supporting Information Table 2 for primer sequences.
The numbers represent the relative expression of that transcript in the CSC-like population compared to its expression in the homologous non-CSC-like population following the correction of each to that of the housekeeping gene GAPDH. Although all 12 transcripts were profiled for each cell line, only those in which significant differences between the CSC-like and non-CSC-like population (p ≤ 0.05) are listed.
The values shown are based on the mean of triplicate samples, all of which had standard errors of ≤ 2% of the mean. p values were determined using the online graphpad (www.graphpad.com) software.
JL-BTL12t, MCF7t and MDA-MB231t were each derived from CSC-like populations that were first grown as tumors in nu/nu mice. Tumor cells were dissociated, plated, and expanded for 2-3 wks in the presence of G418. An assessment of these cells showed them to be virtually 100% GFP+ (not shown).
In two cases (MCF7 and MDA-MB231), we re-examined the expression of the same transcripts in tumor-derived CSC-like cells (designated as MCF7t and MDA-MB231t). In both cases, the expression patterns were quite similar to those of the starting cells. This was particularly true with the MCF7 vs. MCF7t comparison where none of the 10 deregulated transcripts differed by more than ca. 3-fold. The MDA-MB231 versus MDAMB231t comparison showed somewhat greater changes with CD133 and NANOG transcript levels being 3.4 fold higher and 5.6-fold lower, respectively. The most remarkable change was a 373-fold higher level of COL1A2 transcripts in MDA-MB231t cells. None of the remaining transcripts differed by more than two-fold. The four CSC-like cell lines described here thus contain distinct and overlapping sets of CSC-, ES-, and EMT-related transcripts that, with few exceptions, do not change appreciably following propagation as xenografts.
Tumorigenesis by CSC-Like Cells
Our earlier studies had demonstrated more efficient tumorigenesis by the blocked MCF7-derived CSC-like population. We next asked whether this was also true of the other three CSC-like populations and further assessed tumorigenesis by smaller numbers of MCF7 CSC-like cells. We inoculated nu/nu mice with varying numbers of blocked CSC-like cells and compared the efficiency of tumor formation with the appropriate CSC depleted populations. As seen in Supporting Information Table 4, CSC-like cells were at least 100-300 times more efficient at initiating tumors, with as few as 100 cells/animal being sufficient. Thus, all four of the blocked CSC-like populations were significantly more tumorigenic than the corresponding CSC-depleted cell populations.
Standard histopathological and immunohistochemical staining of paraffin-embedded tumor sections was used to compare the properties of each of the CSC/non-CSC pairs (Supporting Information Fig. 7). Stem-like cell-derived tumors from both MCF7 and MDA-MB453 cells appeared more undifferentiated than did tumors arising from their non-stem cell-like counterparts. These findings were consistent with the fact that these same cells could also be distinguished in vitro (Fig. 5D). In contrast, immunohistochemical staining for standard breast cancer cell markers such as cytokeratins and vimentin did not reliably discriminate between tumors arising from stem-like and non-stem-like cells (Supporting Information Fig. 7).
DISCUSSION
Given the method of transfection of the vector, well over 90% of the G418-resistant population from each tumor cell line should have expressed GFP had the Oct3/4 promoter been promiscuous [55]. Instead, the examples reported here were associated with a much smaller fraction of GFP+ cells, ranging from ca. 1-15%. These findings show that Oct3/4-driven GFP expression marks a minority but phenotypically stable population of breast cancer cells with properties distinct from those of their GFP- sister cells. Other criteria by which we judge these cells to be CSCs are based upon morphologic features; CSC-associated cell surface markers; resistance to chemotherapeutic drugs, acidosis, and hypoxia; expression of CSC-, ES-, or EMT-associated transcripts; mammosphere formation in vitro; and a high tumor-initiating capacity. Indeed, perhaps the greatest testimony to the effectiveness of the differentiation block is that tumor xenografts generated by these cells are comprised almost exclusively of cells with the same CSC-like characteristics.
Current purification methods generally only enrich CSCs as evidenced by the fact that, even in highly immunocompromised hosts, efficient tumorigenesis requires several hundred cells [5,13,25]. The cell populations reported here are probably heterogeneous as well given that, in three of four cases, GFP expression declined, thus necessitating further purification. This was consistent with the observation that the 12-15% GFP+ population of the starting MDA-MB453 cells was discordant with its ca. 1% CD44hi/CD24lo phenotype (Supporting Information Table 1). This suggested that GFP expression is not necessarily restricted to CSCs but may be expressed, and eventually lost, by more differentiated TAC-like cells. Secondary selection methods presumably eliminate this population and/or provide a growth advantage for cells with more durable GFP expression and CSC-like properties.
Several lines of evidence argue that the CSC-like cells described here are not clonal outgrowths. First, we successfully isolated similarly blocked cell populations following repeat transfection of the Oct3/4-GFP vector in all four cases (not shown). Second, even at the earliest evaluable times, MCF7 cells always showed complete concordance between GFP expression and the CD44hi/CD24lo phenotype (Fig. 1 not shown). Clonal expansion should have resulted in loss of such concordance in many, if not the vast majority, of these initial transfectants, which we have not observed. Finally, similarly blocked CSC-like populations were obtained when the Oct3/4-GFP sequences were introduced into cells using a much more efficient lentiviral-mediated transduction protocol (not shown).
While sharing certain properties of CSCs, the populations described here were nonetheless distinct from one another. This is not surprising given that the tumors from which they originated were heterogeneous with respect to their presumed cell of origin, initial phenotypes, and prior therapeutic exposures (Supporting Information Table 1). Moreover, patient-to patient variability in the properties of breast CSCs is well-appreciated even before radio- and chemotherapeutic histories are accounted for [32]. Similar heterogeneity has been described in primary breast cancers where distinct CD44hi populations may co-exist with CD44lo cells that express the aldehyde dehydrogenase 1 (aldh1) isozyme. Both cell types possess CSC-like attributes although this is more often the case in the CD44hi/aldh1+ overlap population, which likely still remains somewhat heterogeneous [13].
Precisely how the Oct3/4-GFP vector blocks the differentiation of CSC-like cells is unknown although preliminary experiments indicate that the promoter must remain intact. Among the possibilities under investigation is that the vector encodes one or more proteins that inhibit differentiation; indeed the Oct3/4 promoter does contain three potential open reading frames of 138, 162, and 201 codons whose virtual translation products do not match any GenBank sequences (not shown). A second possibility is that the promoter encodes small, non-coding RNAs (ncRNAs) that regulate differentiation. In this regard, it is worth noting recent reports demonstrating variable numbers of ca. 20-90 nt-long transcripts arising bi-directionally from many Pol II-transcribed genes in many types of human and murine cells [56-59]. Finally, the Oct3/4 promoter may compete for one or more limiting transcription factors that drive CSC differentiation.
The CSCs described here should have several immediate applications. One will be to understand in greater detail how the initiation and maintenance of tumorigenesis by pure CSCs and TACs differ. A second will be to compare these populations for metastatic potential. Finally, they will be useful for identifying novel pharmaceuticals that preferentially target CSCs. These could, in theory, be used either alone or in combination with current therapies to achieve more durable clinical remissions. Of course, any such novel agents would require further verification both in additional, independently-derived CSC lines as well as in primary patient material. A recent report using human mammary cells transformed by defined genetic elements and induced to undergo an EMT has shown that agents specifically targeting these cells can indeed be identified with this approach [43]. The availability of several different CSC-like lines, each with different natural and therapeutic histories, will also permit an assessment as to the more general applicability of such novel agents.
CONCLUSION
Undifferentiated CSCs from many cancers have been difficult to isolate and maintain, thereby limiting their characterization and the extent to which they can be used to identify new pharmaceuticals to which they are selectively susceptible. Our unanticipated finding that CSCs from four different breast cancer cell lines can be maintained in an undifferentiated state both in vitro and in vivo provides such opportunities. As predicted, these cell lines possess properties that are distinct from those of their more abundant TAC-like counterparts. These include differences in their cell surface phenotypes, differential sensitivities to cytotoxic agents and environmental stresses, in vitro growth properties, tumor initiating capacities, and transcriptional profiles. Despite many shared similarities, differences among the four CSC lines likely reflect the cell of origin of the original primary tumors, inherent biological differences of the tumors, and the therapy histories of the patients from whom the tumors were obtained. The cell lines described here should provide homogenous populations of CSCs derived from naturally-occurring and spontaneously-arising human breast cancer that will serve as powerful tools in the pursuit of these goals. Of course, any novel agents that are shown to specifically inhibit these CSCs will necessarily require verification in a larger number of CSC lines and primary CSCs. At the same time, understanding the differences among the CSC lines may allow for a broader understanding of their biologic and adaptive behaviors.
Supplementary Material
ACKNOWLEDGEMENTS
We thank Bob Lakomy and Alexis Styche of Children's Hospital of Pittsburgh of UPMC and E. Michael Meyer of The University of Pittsburgh Cancer Institute's Core Flow Cytometry Laboratory for help with FACS, Max Wicha of The University of Michigan Comprehensive Cancer Center for cell lines and valuable discussions, and Wei Cui for the Oct3/4-GFP plasmid. We thank Nicole T. Myers for excellent technical assistance. We also thank John Lazo for valuable discussions and comments on the manuscript.
Funded by: NIH grant CA78259 to EVP and by Children's Hospital of Pittsburgh of UPMC
Footnotes
Author contribution summary: G.B.S.: conception and design, collection and/or assembly of data, data analysis and interpretation, final approval of manuscript; K.R.: collection and/or assembly of data, final approval of manuscript; F.Z.: collection and/or assembly of data; D.J.D.: Collection and/or assembly of data, data interpretation and analysis; J.J.L.: provision of study material or patients, final approval of manuscript; S.G.G.: provision of study material or patients, final approval of manuscript; E.V.P.: conception and design; manuscript writing, data analysis and interpretation, final approval of manuscript, financial support
DISCLOSURE OF POTENTIAL CONFLICTS OF INTEREST
The authors indicate no potential conflicts of interest
REFERENCES
- 1.Cho RW, Clarke MF. Recent advances in cancer stem cells. Curr Opin Genet Dev. 2008;18:48–53. doi: 10.1016/j.gde.2008.01.017. [DOI] [PubMed] [Google Scholar]
- 2.Dick JE. Stem cell concepts renew cancer research. Blood. 2008;112:4793–4807. doi: 10.1182/blood-2008-08-077941. [DOI] [PubMed] [Google Scholar]
- 3.Wang JC, Dick JE. Cancer stem cells: lessons from leukemia. Trends Cell Biol. 2005;15:494–501. doi: 10.1016/j.tcb.2005.07.004. [DOI] [PubMed] [Google Scholar]
- 4.Orkin SH, Zon LI. Hematopoiesis: an evolving paradigm for stem cell biology. Cell. 2008;132:631–644. doi: 10.1016/j.cell.2008.01.025. [DOI] [PMC free article] [PubMed] [Google Scholar]
- 5.Al-Hajj M, Wicha MS, Benito-Hernandez A, et al. Prospective identification of tumorigenic breast cancer cells. Proc Natl Acad Sci U S A. 100:3983–3988. doi: 10.1073/pnas.0530291100. Erratum in: Proc Natl Acad Sci U S A 2003;100:6890. [DOI] [PMC free article] [PubMed] [Google Scholar]
- 6.Chan KS, Espinosa I, Chao M, et al. Identification, molecular characterization, clinical prognosis, and therapeutic targeting of human bladder tumor-initiating cells. Proc Natl Acad Sci U S A. 2009;106:14016–14021. doi: 10.1073/pnas.0906549106. [DOI] [PMC free article] [PubMed] [Google Scholar]
- 7.Huang EH, Wicha MS. Colon cancer stem cells: implications for prevention and therapy. Trends Mol Med. 2008;14:503–509. doi: 10.1016/j.molmed.2008.09.005. [DOI] [PMC free article] [PubMed] [Google Scholar]
- 8.Lang SH, Frame FM, Collins AT. Prostate cancer stem cells. J. Pathol. 2009;217:299–306. doi: 10.1002/path.2478. [DOI] [PMC free article] [PubMed] [Google Scholar]
- 9.Lawson DA, Witte ON. Stem cells in prostate cancer initiation and progression. J. Clin Invest. 2007;117:2044–2050. doi: 10.1172/JCI32810. [DOI] [PMC free article] [PubMed] [Google Scholar]
- 10.Peacock CD, Watkins DN. Cancer stem cells and the ontogeny of lung cancer. J Clin Oncol. 2008;26:2883–2889. doi: 10.1200/JCO.2007.15.2702. [DOI] [PMC free article] [PubMed] [Google Scholar]
- 11.Simeone DM. Pancreatic cancer stem cells: implications for the treatment of pancreatic cancer. Clin Cancer Res. 2008;14:5646–5648. doi: 10.1158/1078-0432.CCR-08-0584. [DOI] [PubMed] [Google Scholar]
- 12.Dalerba P, Dylla SJ, Park IK, et al. Phenotypic characterization of human colorectal cancer stem cells. Proc Natl Acad Sci U S A. 2007;104:10158–10163. doi: 10.1073/pnas.0703478104. [DOI] [PMC free article] [PubMed] [Google Scholar]
- 13.Ginestier C, Hur MH, Charafe-Jauffret E, et al. ALDH1 is a marker of normal and malignant human mammary stem cells and a predictor of poor clinical outcome. Cell Stem Cell. 2007;1:555–567. doi: 10.1016/j.stem.2007.08.014. [DOI] [PMC free article] [PubMed] [Google Scholar]
- 14.Majeti R, Becker MW, Tian Q, et al. Dysregulated gene expression networks in human acute myelogenous leukemia stem cells. Proc Natl Acad Sci U S A. 2009;106:3396–3401. doi: 10.1073/pnas.0900089106. [DOI] [PMC free article] [PubMed] [Google Scholar]
- 15.Xin L, Lawson DA, Witte ON. The Sca-1 cell surface marker enriches for a prostate-regenerating cell subpopulation that can initiate prostate tumorigenesis. Proc Natl Acad Sci U S A. 2005;102:6942–6947. doi: 10.1073/pnas.0502320102. [DOI] [PMC free article] [PubMed] [Google Scholar]
- 16.Ben-Porath I, Thomson MW, Carey VJ, et al. An embryonic stem cell-like gene expression signature in poorly differentiated aggressive human tumors. Nat Genet. 2008;40:499–507. doi: 10.1038/ng.127. [DOI] [PMC free article] [PubMed] [Google Scholar]
- 17.Blum R, Gupta R, Burger PE, et al. Molecular signatures of prostate stem cells reveal novel signaling pathways and provide insights into prostate cancer. PLoS One. 2009;4:e5722. doi: 10.1371/journal.pone.0005722. [DOI] [PMC free article] [PubMed] [Google Scholar]
- 18.Creighton CJ, Li X, Landis M, et al. Residual breast cancers after conventional therapy display mesenchymal as well as tumor-initiating features. Proc Natl Acad Sci U S A. 2009;106:13820–13825. doi: 10.1073/pnas.0905718106. [DOI] [PMC free article] [PubMed] [Google Scholar]
- 19.Liu R, Wang X, Chen GY, et al. The prognostic role of a gene signature from tumorigenic breast-cancer cells. N Engl J Med. 2007;356:217–226. doi: 10.1056/NEJMoa063994. [DOI] [PubMed] [Google Scholar]
- 20.Arumugam T, Ramachandran V, Fournier KF, et al. Epithelial to mesenchymal transition contributes to drug resistance in pancreatic cancer. Cancer Res. 2009;69:5820–5828. doi: 10.1158/0008-5472.CAN-08-2819. [DOI] [PMC free article] [PubMed] [Google Scholar]
- 21.Mani SA, Guo W, Liao MJ, et al. The epithelial-mesenchymal transition generates cells with properties of stem cells. Cell. 2008;133:704–715. doi: 10.1016/j.cell.2008.03.027. [DOI] [PMC free article] [PubMed] [Google Scholar]
- 22.Pandit TS, Kennette W, Mackenzie L, et al. Lymphatic metastasis of breast cancer cells is associated with differential gene expression profiles that predict cancer stem cell-like properties and the ability to survive, establish and grow in a foreign environment. Int J Oncol. 2009;35:297–308. [PubMed] [Google Scholar]
- 23.Al-Hajj M, Becker MW, Wicha M, et al. Therapeutic implications of cancer stem cells. Curr Opin Genet Dev. 2004;14:43–47. doi: 10.1016/j.gde.2003.11.007. [DOI] [PubMed] [Google Scholar]
- 24.Dean M, Fojo T, Bates S. Tumour stem cells and drug resistance. Nat Rev Cancer. 2005;5:275–284. doi: 10.1038/nrc1590. [DOI] [PubMed] [Google Scholar]
- 25.Diehn M, Cho RW, Clarke M. Therapeutic implications of the cancer stem cell hypothesis. Semin Radiat Oncol. 2009;19:78–86. doi: 10.1016/j.semradonc.2008.11.002. [DOI] [PMC free article] [PubMed] [Google Scholar]
- 26.Diehn M, Cho RW, Lobo NA, et al. Association of reactive oxygen species levels and radioresistance in cancer stem cells. Nature. 2009;458:780–783. doi: 10.1038/nature07733. [DOI] [PMC free article] [PubMed] [Google Scholar]
- 27.Fillmore C, Kuperwasser C. Human breast cancer cell lines contain stem-like cells that self-renew, give rise to phenotypically diverse progeny and survive chemotherapy. Breast Cancer Res. 2008;10:R25. doi: 10.1186/bcr1982. [DOI] [PMC free article] [PubMed] [Google Scholar]
- 28.Ischenko I, Seeliger H, Schaffer M, et al. Cancer stem cells: how can we target them? Curr Med Chem. 2008;15:3171–3184. doi: 10.2174/092986708786848541. [DOI] [PubMed] [Google Scholar]
- 29.Kakarala M, Wicha MS. Implications of the cancer stem-cell hypothesis for breast cancer prevention and therapy. J Clin Oncol. 2008;26:2813–2820. doi: 10.1200/JCO.2008.16.3931. [DOI] [PMC free article] [PubMed] [Google Scholar]
- 30.Li X, Lewis MT, Huang J, et al. Intrinsic resistance of tumorigenic breast cancer cells to chemotherapy. J Natl Cancer Inst. 2008;100:672–679. doi: 10.1093/jnci/djn123. [DOI] [PubMed] [Google Scholar]
- 31.Phillips TM, McBride WH, Pajonk F. The response of CD24(-/low)/CD44+ breast cancer-initiating cells to radiation. J Natl Cancer Inst. 2006;98:1777–1785. doi: 10.1093/jnci/djj495. [DOI] [PubMed] [Google Scholar]
- 32.Rosen JM, Jordan CT. The increasing complexity of the cancer stem cell paradigm. Science. 2009;324:1670–1673. doi: 10.1126/science.1171837. [DOI] [PMC free article] [PubMed] [Google Scholar]
- 33.Braun S, Auer D, Marth C. The prognostic impact of bone marrow micrometastases in women with breast cancer. Cancer Invest. 2009;27:598–603. doi: 10.1080/07357900802574496. [DOI] [PubMed] [Google Scholar]
- 34.Hollier BG, Evans K, Mani SA. The epithelial-to-mesenchymal transition and cancer stem cells: a coalition against cancer therapies. J. Mammary Gland Biol. Neoplasia. 2009;14:29–43. doi: 10.1007/s10911-009-9110-3. [DOI] [PubMed] [Google Scholar]
- 35.Polyak K, Weinberg RA. Transitions between epithelial and mesenchymal states: acquisition of malignant and stem cell traits. Nat Rev Cancer. 2009;9:265–273. doi: 10.1038/nrc2620. [DOI] [PubMed] [Google Scholar]
- 36.Bonnet D, Dick JE. Human acute myeloid leukemia is organized as a hierarchy that originates from a primitive hematopoietic cell. Nat Med. 1997;3:730–737. doi: 10.1038/nm0797-730. [DOI] [PubMed] [Google Scholar]
- 37.Neering SJ, Bushnell T, Sozer S, et al. Leukemia stem cells in a genetically defined murine model of blast-crisis CML. Blood. 2007;110:2578–2585. doi: 10.1182/blood-2007-02-073031. [DOI] [PMC free article] [PubMed] [Google Scholar]
- 38.Wicha MS. Cancer stem cell heterogeneity in hereditary breast cancer. Breast Cancer Res. 2008;10:105. doi: 10.1186/bcr1990. [DOI] [PMC free article] [PubMed] [Google Scholar]
- 39.Gerrard L, Zhao D, Clark AJ, et al. Stably transfected human embryonic stem cell clones express OCT4-specific green fluorescent protein and maintain self-renewal and pluripotency. Stem Cells. 2005;23:124–133. doi: 10.1634/stemcells.2004-0102. [DOI] [PubMed] [Google Scholar]
- 40.Rothermund K, Rogulski K, Fernandes E, et al. C-Myc-independent restoration of multiple phenotypes by two C-Myc target genes with overlapping functions. Cancer Res. 2005;65:2097–2107. doi: 10.1158/0008-5472.CAN-04-2928. [DOI] [PubMed] [Google Scholar]
- 41.Schoenhals M, Kassambara A, De Vos J, et al. Embryonic stem cell markers expression in cancers. Biochem Biophys Res Commun. 2009;383:157–162. doi: 10.1016/j.bbrc.2009.02.156. [DOI] [PubMed] [Google Scholar]
- 42.Tai MH, Chang CC, Kiupel M, et al. Oct4 expression in adult human stem cells: evidence in support of the stem cell theory of carcinogenesis. Carcinogenesis. 2005;26:495–502. doi: 10.1093/carcin/bgh321. Erratum in: Carcinogenesis 2005;26: 1316. [DOI] [PubMed] [Google Scholar]
- 43.Gupta PB, Onder TT, Jiang G, et al. Identification of selective inhibitors of cancer stem cells by high-throughput screening. Cell. 2009;138:645–659. doi: 10.1016/j.cell.2009.06.034. [DOI] [PMC free article] [PubMed] [Google Scholar]
- 44.Draper JS, Moore HD, Ruban LN, et al. Culture and characterization of human embryonic stem cells. Stem Cells Dev. 2004;13:325–336. doi: 10.1089/scd.2004.13.325. [DOI] [PubMed] [Google Scholar]
- 45.Dontu G, Abdallah WM, Foley JM, et al. In vitro propagation and transcriptional profiling of human mammary stem/progenitor cells. Genes Dev. 2003;17:1253–1270. doi: 10.1101/gad.1061803. [DOI] [PMC free article] [PubMed] [Google Scholar]
- 46.Ponti D, Costa A, Zaffaroni N, et al. Isolation and in vitro propagation of tumorigenic breast cancer cells with stem/progenitor cell properties. Cancer Res. 2005;65:5506–5511. doi: 10.1158/0008-5472.CAN-05-0626. [DOI] [PubMed] [Google Scholar]
- 47.Dey D, Saxena M, Paranjape AN, et al. Phenotypic and functional characterization of human mammary stem/progenitor cells in long term culture. PLoS One. 2009;4:e5329. doi: 10.1371/journal.pone.0005329. [DOI] [PMC free article] [PubMed] [Google Scholar]
- 48.Charafe-Jauffret E, Ginestier C, Iovino F, et al. Breast cancer cell lines contain functional cancer stem cells with metastatic capacity and a distinct molecular signature. Cancer Res. 2009;69:1302–1313. doi: 10.1158/0008-5472.CAN-08-2741. [DOI] [PMC free article] [PubMed] [Google Scholar]
- 49.Kok M, Koornstra RH, Margarido TC, et al. Mammosphere-derived gene set predicts outcome in patients with ER-positive breast cancer. J Pathol. 2009;218:316–326. doi: 10.1002/path.2544. [DOI] [PubMed] [Google Scholar]
- 50.Birnbaum KD, Sánchez Alvarado A. Slicing across kingdoms: regeneration in plants and animals. Cell. 2008;132:697–710. doi: 10.1016/j.cell.2008.01.040. [DOI] [PMC free article] [PubMed] [Google Scholar]
- 51.Burk U, Schubert J, Wellner U, et al. A reciprocal repression between ZEB1 and members of the miR-200 family promotes EMT and invasion in cancer cells. EMBO Rep. 2008;9:582–589. doi: 10.1038/embor.2008.74. [DOI] [PMC free article] [PubMed] [Google Scholar]
- 52.Hermann PC, Huber SL, Herrler T, et al. Distinct populations of cancer stem cells determine tumor growth and metastatic activity in human pancreatic cancer. Cell Stem Cell. 2007;1:313–323. doi: 10.1016/j.stem.2007.06.002. [DOI] [PubMed] [Google Scholar]
- 53.Peinado H, Olmeda D, Cano A. Snail, Zeb and bHLH factors in tumour progression: an alliance against the epithelial phenotype? Nat Rev Cancer. 2007;7:415–428. doi: 10.1038/nrc2131. [DOI] [PubMed] [Google Scholar]
- 54.Thiery JP. Epithelial-mesenchymal transitions in tumour progression. Nat Rev Cancer. 2002;2:442–454. doi: 10.1038/nrc822. [DOI] [PubMed] [Google Scholar]
- 55.Smith MJ, Charron-Prochownik DC, Prochownik EV. The leucine zipper of c-Myc is required for full inhibition of erythroleukemia differentiation. Mol Cell Biol. 1990;10:5333–5339. doi: 10.1128/mcb.10.10.5333. [DOI] [PMC free article] [PubMed] [Google Scholar]
- 56.Core LJ, Waterfall JJ, Lis JT. Nascent RNA sequencing reveals widespread pausing and divergent initiation at human promoters. Science. 2008;322:1845–1848. doi: 10.1126/science.1162228. [DOI] [PMC free article] [PubMed] [Google Scholar]
- 57.Seila AC, Calabrese JM, Levine SS, et al. Divergent transcription from active promoters. Science. 2008;322:1849–1851. doi: 10.1126/science.1162253. [DOI] [PMC free article] [PubMed] [Google Scholar]
- 58.Preker P, Nielsen J, Kammler S, et al. RNA exosome depletion reveals transcription upstream of active human promoters. Science. 2008;322:1851–1854. doi: 10.1126/science.1164096. [DOI] [PubMed] [Google Scholar]
- 59.He Y, Vogelstein B, Velculescu VE, et al. The antisense transcriptomes of human cells. Science. 2008;322:1855–1857. doi: 10.1126/science.1163853. [DOI] [PMC free article] [PubMed] [Google Scholar]
Associated Data
This section collects any data citations, data availability statements, or supplementary materials included in this article.