

Abstract
The 2013/2014 Community Structure–Activity Resource (CSAR) challenge was designed to prospectively validate advancement in the field of docking and scoring receptor–small molecule interactions. Purely computational methods have been found to be quite limiting. Thus, the challenges assessed methods that combined both experimental data and computational approaches. Here, we describe our contribution to solve three important challenges in rational drug discovery: rank-ordering protein primary sequences based on affinity to a compound, determining close-to-native bound conformations out of a set of decoy poses, and rank-ordering sets of congeneric compounds based on affinity to a given protein. We showed that the most significant contribution to a meaningful enrichment of native-like models was the identification of the best receptor structure for docking and scoring. Depending on the target, the optimal receptor for cross-docking and scoring was identified by a self-consistent docking approach that used the Vina scoring function, by aligning compounds to the closest cocrystal or by selecting the cocrystal receptor with the largest pocket. For tRNA (m1G37) methyltransferase (TRMD), ranking a set of 31 congeneric binding compounds cross-docked to the optimal receptor resulted in a R2 = 0.67; whereas, using any other of the 13 receptor structures led to almost no enrichment of native-like complex structures. Furthermore, although redocking predicted lower RMSDs relative to the bound structures, the ranking based on multiple receptor structures did not improve the correlation coefficient. Our predictions highlight the role of rational structure-based modeling in maximizing the outcome of virtual screening, as well as limitations scoring multiple receptors.
Graphical abstract
INTRODUCTION
Computational screening methods continue to be developed and improved as credible and complementary alternatives to high-throughput biochemical compound screening (HTS).1–7 However, purely computational approaches are not able to predict binding free energies.8,9 Thus, rational or expert-guided approaches are required to improve hit rates.6,9 To prospectively assess and benchmark methodologies, the Community Structure–Activity Resource (CSAR) developed a set of challenges to identify robust methods and to improve computational methods for drug discovery. In particular, the challenges included rank-ordering congeneric compounds, identification of a near-native pose out of a set of docked decoy poses, and rank-ordering primary protein sequences based on affinity to a single compound.
Structure-based virtual screening consists of examining a database of 100–100 000 000 compounds and selecting a small set that are most likely to bind in an experiment. There are many established methods for achieving this including pharmacophore based methods1–3,10–12 and molecular docking.9,13–15 In pharmacophore-based methods, virtual screening is performed by matching a specified set of features that describe the structural arrangement of an interaction to a given receptor. After this search, further refinements are often applied such as energy minimization and scoring. Docking-based virtual screening methods use molecular docking tools to predict how each compound in the database binds with respect to a protein receptor and uses the score of the poses to determine which compounds in the database are likely binders. In both of these cases, the scoring function plays a critical role in the success of the method at all levels.16–18
Essential for the success of structure-based virtual screening is an accurate structure of the receptor. Many times an X-ray or solution structure of the protein of interest is known, however this is not the case for many proteins. Moreover, it is often the case that differences between apo and holo structures can make a given structure useless for docking and/or scoring. When no structure is available, it is possible to build a homology model based on known structures of related proteins.19,20 However, it is well-known that homology models are only as good as the similarity of the homologous proteins and the quality of the sequence alignment.21 Low sequence similarity (<30%) or a suboptimal sequence alignment has a detrimental impact on the quality of the homology model.22 Moreover, protein flexibility or induced fit structural rearrangements upon ligand binding are also unsolved challenges in structure prediction.23–27 The latter is the main reason why most virtual screening efforts treat the receptor structure as fixed, or at most sample a limited number of side chain conformations.28 And, as expected, the choice of the receptor structure is a major determinant of the success of the screen.
The CSAR experiment was developed to prospectively test computational tools capable to address some of the aforementioned challenges in structure-based virtual screening. The combined 2013/2014 experiments contained five phases with different challenges. Namely, predicting the affinity of a compound to a protein given only the primary amino acid sequence, choosing the correct binding pose out of a collection of docked decoy poses, and predicting the pose and relative ranking of a set of congeneric compounds. Our lab participated and obtained some of the best results in these challenges by testing a variety of strategies designed to identify the best possible receptor structure for screening, while scoring using two established scoring functions that can be found in the literature, AutoDock Vina28 and the Custom scoring function that we previously developed for the 2012 CSAR competition.8 Our findings underscore that molecular docking can consistently predict and score bound-like poses to a bound-like receptor (redocking). Docking to homology models is still challenging, yet predicting druggable pockets and docking to multiple models allowed us to identify the targets of digoxigenin among a set of 14 protein sequences. Ranking of congeneric compounds depends on having the right open pocket for docking. We showed that out of a set of 14 more or less equivalent small molecule bound receptor structures, only one produced a meaningful affinity ranking with an overall R2 = 0.67. What distinguished this structure from the rest was that it had the largest open pocket-binding site. On the contrary, if the pocket is constrained, then substructure alignment leads to better enrichment than docking. In retrospect, our results suggest that despite the limitation of the scoring functions, a strong indication of the druggability of the receptor is the fact that small molecules consistently fit/dock in a binding pocket.
CSAR 2013 Phase 1
Docking to multiple homology models delivers good binding poses.
Challenge
Predict out of 14 designed protein sequences, which ones bind digoxigenin.
Methods
For this stage, we submitted four different methods (Group E): Vina-Docking, Custom-Docking, Neighbor-Joining-Ranking, and Manual-Consensus-Ranking. The approach consisted in (a) building 3D homology models of the proteins using the I-TASSER server,19,29,30 (b) using fpocket31 to find potential binding sites on the models, (c) performing molecular docking of the digoxigenin to a bounding box based on the top scoring pocket using two scoring functions, an in-house “Custom-Docking” scoring function8 and “Vina-Docking” the AutoDock Vina28 scoring function, (d) ranking structures based on sequence similarity of the structures with best docked models (Neighbor-Joining-Ranking), and (e) ranking models using a “human” Manual-Consensus-Ranking based on the available data which was outperformed by the semiautomated methods and will not be discussed further. For this and all other challenges, molecular docking was performed using smina8 which uses the AutoDock Vina scoring function by default. We also note that the in-house custom scoring function that was developed for the 2012 CSAR competition was used in some phases of the competition and will be denoted as the Custom scoring function.8
Results
Our predictions and results from 2013 Phase 1 are shown in Table 1. Fpocket successfully predicted the binding pocket in most models. Molecular docking using Vina- and Custom-Scoring identified DIG5 and DIG10, respectively, as the highest ranked docked models. Figure 1 shows the Vina-Docking predicted models of DIG5 and DIG10 overlapped on the cocrystals of DIG18 and DIG10. These bound models highlight the accuracy of our homology models, which for DIG10, DIG18, and DIG19 had an all-heavy atoms RMSD of 1.95, 2.15, and 2.02 Å, respectively, relative to their own crystals (the crystal structure of DIG5 is not available). Visual inspection showed striking chemical complementarity for our top models, which further supported our predictions. These included hydrophobic contacts with Phe34 and Phe101 for DIG5 and hydrogen bonds with Tyr34 and Tyr101 for DIG10. The latter recapitulated the bonds observed in the cocrystal of DIG10 (PDB ID 4J8T). However, most docked structures did not get into the pocket, mostly due to the fact that our models had an “extra” 13–21 amino acids on the C-terminal that were poorly predicted ab initio by I-TASSER. Another issue was that the compound provided for screening (shown in Figure 1C) included a longer amide group at one end that is missing from the actual cocrystal. Hence, as shown in Figure 1, for both of our models, the extra tail tilted our models to find an exit point that avoided the extra helical motif present in our models. And, for, say, DIG18 and DIG19, the “extra” amino acids in the receptor overlapped with the extended tail of the compound.
Table 1.
Leveraging Both Sequence and Structural Information To Improve Protein–Ligand Affinity Predictionsa
| Vina-Docking | Custom-Docking | Neighbor-Joining-Ranking |
|---|---|---|
| DIG5 | DIG10 | DIG5 |
| DIG6 | DIG1 | DIG18 |
| DIG3 | DIG3 | DIG10 |
| DIG18 | DIG5 | DIG19 |
| DIG8 | DIG8 | DIG4 |
| DIG10 | DIG18 | DIG12 |
| DIG14 | DIG17 | DIG7 |
| DIG12 | DIG19 | DIG17 |
| DIG13 | DIG6 | DIG6 |
| DIG17 | DIG13 | DIG2 |
| DIG19 | DIG4 | DIG14 |
| DIG9 | DIG9 | DIG9 |
| DIG7 | DIG14 | DIG13 |
| DIG2 | DIG12 | DIG8 |
| DIG4 | DIG7 | DIG1 |
| DIG1 | DIG2 | DIG3 |
| AUC = 0.81 | 0.75 | 1.00 |
Shown are the predicted rankings of the 14 CSAR 2013 Phase 1 protein sequences using our three methods. The actual binders are shown in bold. The last row indicates the area under the curve (AUC) of our predictions.
Figure 1.
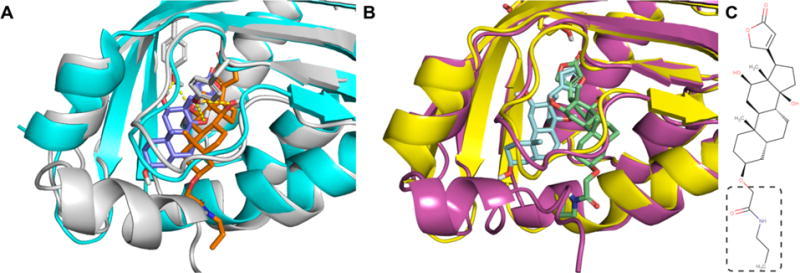
Molecular docking using Vina scoring function produces reasonable poses in binding site of homology models. (A) Homology model of DIG10 (white) with top ranked vina pose of digoxigenin with the extra amide tail (orange) overlaid on the cocrystal structure of DIG10 (PDB ID 4J8T, blue) bound to digoxigenin (purple). (B) Homology model of DIG10 (purple) with top ranked vina pose of digoxigenin with the extra amide tail (green) overlaid on the cocrystal structure of DIG18 (yellow) bound to digoxigenin (light blue). Note that, for both DIG5 and DIG10, there is an “extra” α-helix that covers the opening to the binding site. (C) Ligand structure. Also note that the ligand structure in our model differs slightly from the ligand in the cocrystals by the addition of an amide tail (shown in dashed box). These two factors preclude the identification of any higher-quality poses.
Because of the obvious limitations of structure prediction, we postulated that proteins close in sequence to DIG5 and DIG10 should provide the best binding proteins. A multiple alignment of all 14 sequences resulted in the clustering of DIG5, DIG18, DIG10, and DIG19 as most similar structures (Figure 2); hence, we ranked proteins according to sequence distance from DIG5 (top ranked by Vina-Dock). The Neighbor-Joining-Ranking method, which leverages structure and sequence information, successfully predicted the four proteins that bind to digoxigenin. Only one other team in the competition performed comparably.
Figure 2.
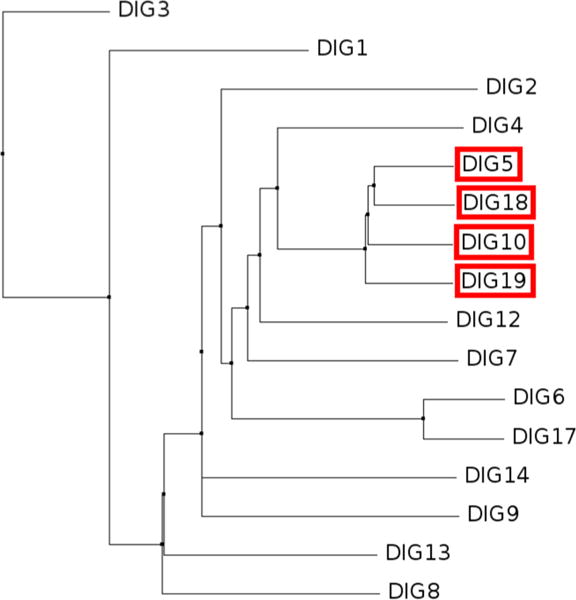
Phylogenetic analysis of the 14 DIG protein family sequences for CSAR 2013 Phase 1. The tree was constructed using BLOSUM62 distance with Jalview v2.832 after multiple sequence alignment with Clustal Omega.33 Red boxes indicate the four sequences that actually bind to the compound (information released after competition).
This challenge highlighted several lessons for docking to homology models: namely, (a) the importance of having high-quality structures of the receptor, (b) the inability of ab initio regions to meaningfully contribute in molecular docking, (c) narrowing the binding surface to only the most druggable sites, and (d) the robustness of molecular docking and multiple scoring functions to identify good binding pockets.
CSAR 2013 Phase 2
Molecular docking identifies near-native poses.
Challenge
Selecting the pose that is closest to the bound cocrystal out of a set of 200 decoy poses.
Methods
For this challenge, we employed and submitted six methods for identifying the correct binding pose. We ranked the poses by their Vina score (Vina-Score), Custom score (Custom-Score), and solvent accessible surface area score (SASA-Score). We also minimized the compounds with the Vina and custom scoring functions (Vina-Min and Custom-Min). Finally, we developed a support vector machine (SVM) scoring function where we applied machine learning techniques to classify poses as either near-native poses (<1 Å RMSD) or decoys (>2 Å RMSD to cocrystal pose). As training data, we redocked the ligands from the 343 high quality cocrystal structures from the CSAR NRC High-Quality set34 with smina and labeled the docked poses as either near-native or decoys. Poses between 1 and 2 Å were discarded to mimic the conditions of the test set data which was described as having one pose under 1 Å and the rest over 2 Å for each target. We trained our model using 10-fold cross validation keeping proteins from the same family in the same subsample. Forward selection was used to select the most discriminative features. These were the AutoDock Vina, the SASA, and the Custom-Score. The full list of features considered is listed in Table S1.
Results
All of our methods ranked the correct pose as the top ranked pose for both DIG18 and DIG20 except for Custom-Score on DIG18 and for Custom-Min for DIG18 and DIG20, where it was ranked second for each (Figure 3A). Scores are normalized between 0 and 1. Our SVM-Score also correctly distinguished the near-native pose (<1 Å RMSD) from the decoys for both targets however the confidence in the predictions is much higher as evidence in the difference between the first and second ranked poses.
Figure 3.
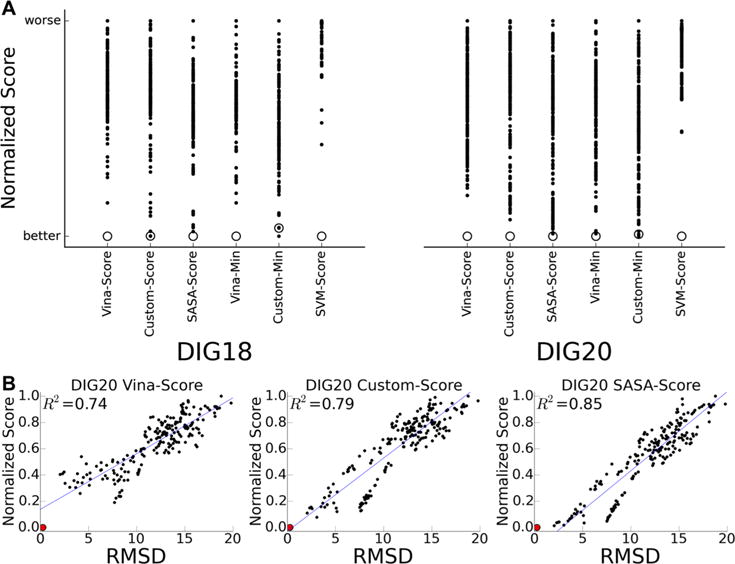
Successful prediction of near-native poses. (A) Scores of six methods for identifying near-native poses (open circles) out of a set of 200 docked decoy poses (black dots) for CSAR 2013 Phase 2 for two targets DIG18 and DIG20. The scores of these varied methods have been normalized where lower scores are better. (B) RMSD of DIG20 decoy poses plotted against their Vina-Score, Custom-Score, and SASA-Score. The red circle indicates the near-native pose. The blue line indicates the best-fit curve, and the R2 is shown in each of the plots.
Figure 3B shows the RMSD of the DIG20 poses against normalized Vina, Custom, and SASA-Score (Figure 3B). We find a striking linearity between the scores and the RMSDs of these poses, indicating that the scoring functions are well suited for identifying low RMSD poses. Even minimizing the poses using Vina does not change the correlation R2 (see the full set of rankings in Figure S1). This challenge reinforces that scoring is capable of validating near-native models, particularly when using the AutoDock Vina scoring function.
CSAR 2013 Phase 3
Molecular docking is an effective tool for rank-ordering of congeneric compounds when a template cocrystal is known.
Challenge
Pose prediction and rank-ordering of 10 congeneric compounds of digoxigenin to the crystal structure of DIG10. Known cocrystals of DIG18 and DIG19 were available.
Methods
For this phase, we submitted a total of four methods (Group G). The approach consisted of (a) 25 conformers of each compound were generated using Omega235 from OpenEye with default parameters and then substructure alignment was performed using obfit36 to digoxigenin from its cocrystallized pose to DIG18 overlapped in DIG10; (b) aligned conformers were minimized with either the Vina (Align-Vina) or the Custom (Align-Custom) scoring functions; (c) ranked top conformers for each compound based on affinity score; (d) molecular docking of the compounds in the binding pocket of DIG10 performed with both Vina (Dock-Vina) or Custom (Dock-Custom) scoring function using smina. Smina was run with default settings, which samples nine ligand conformations using the Vina docking routine of stochastic sampling.8,28
Results
Our method of aligning conformers of the compounds and minimizing with Vina (Align-Vina) was the best of all 33 contributors in the competition (R2 = 0.81, Figure 4). Docking to the protein with Vina (Dock-Vina) also did very well (R2 = 0.72). On the other hand, our Custom scoring function yielded significantly poorer affinity predictions (Figure S2). This was due to the fact that the Custom scoring function allows for more overlaps because its softer contact potential (modeled by an 8–4 Leonard-Jones potential) compared to the Vina scoring function (which has a repulsion term).8,28 Hence, since this challenge involved docking to bound receptors as opposed to unbound structures,8 the extra sampling afforded by a softer scoring function was detrimental for ranking purposes.
Figure 4.
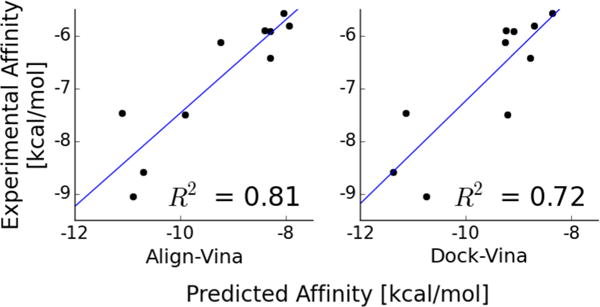
Vina scoring and docking provides a meaningful rank-ordering of congeneric compounds. Binding affinity prediction correlations of 10 compounds to DIG10 from CSAR 2013 Phase 3 using two different methods. (left) Pregenerated conformers are aligned to a cocrystallized ligand and energy minimized or (right) compounds are docked with the Vina scoring function. The blue line shows the linear fit, and the correlation coefficient (R2) value is shown in each subplot. The similar correlations between Align and Dock attest to the fact that docking is sampling ligand rotamers resulting in meaningful docked poses.
This challenge confirms that Vina score is one of the best open-source scoring functions to dock to bound-like receptor structures.
CSAR 2014 Phase 1
Pose prediction works when an optimal receptor structure exists and it is kept fixed.
Challenge
Given 200 docked decoy poses, predict the pose closest to the bound structure for 22 compounds bound to three different receptors: Factor Xa (FXA), spleen tyrosine kinase (SYK), and tRNA (m1G37) methyltransferase (TRMD).
Methods
This challenge is an extension of CSAR 2013 Phase 2 where we established that the Vina score provided excellent discrimination of near-native docked poses (R2 = 0.72, Figure 3B). Here, we are given a total of 22 bound receptor structures (see Table 2), and we used the Vina score to rank the docked poses.
Table 2.
Structural data available for CSAR 2014 Phase 2a
| set | test set compounds | CSAR cocrystals | PDB cocrystals |
|---|---|---|---|
| FXA sets 1, 2, 3 | 44, 66, 50 | 3 (3) | 123 |
| SYK | 273 | 5 (8) | 29 |
| TRMD | 31 | 14 (31) | 8 |
The number of compounds in the five compound test sets (three sets for FXA) are listed in addition to the number of co-crystal structures available from the PDB (at the time of the competition) and from the results of the previous phase. In parentheses are listed the total number of structures available after the competition.
Results
Scoring the compounds with Vina scoring function correctly identified the close-to-crystal poses for all 22 compounds (Figure 5). Furthermore, for the two targets for which we have affinity data, SYK and TRMD, Vina correctly predicted the best affinity compounds GTC233 and GTC451, respectively. Vina score also correctly predicted GTC446 and GTC447 to be the two worst compounds for TRMD.
Figure 5.
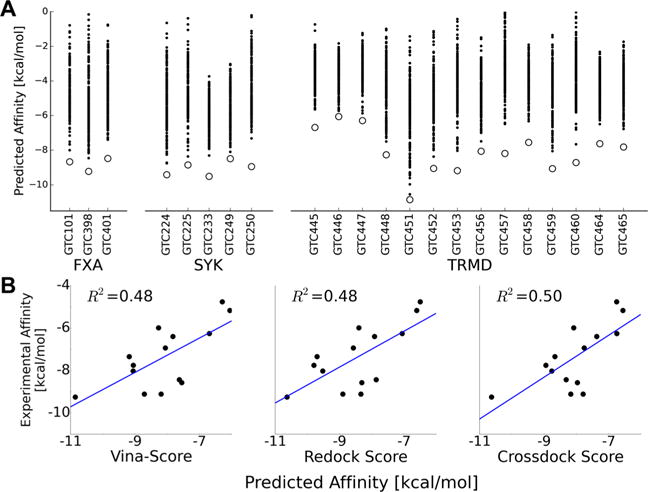
Scoring docked decoys with Vina correctly identifies near-native poses. (A) Vina scores of the 200 decoy poses (black dots) for the 22 compounds of the CSAR 2014 Phase 1. All the closest-to-crystal poses indicated with open circles are ranked with the lowest affinity score. (B) Correlation between the predicted and actual affinities for the 14 TRMD compounds using (left) Vina to score the given poses to their given cocrystal receptor structure, (center) score after redocking the compounds to their cocrystal receptor structure, and (right) score from crossdocking the compounds to the TRMD_451 receptor structure. A slight improvement in the correlation with the actual affinities is observed when crossdocking to TRMD_451, which has the largest open pocket among all cocrystals (see below).
For the 14 bound receptor structures we had for TRMD, we showed that redocking using smina with the Vina scoring function predicted almost identical docked poses as those provided in this challenge that were generated using DOCK6.5.37 Perhaps more interesting, we show that cross-docking to the GTC451 receptor which resulted in the lowest Vina score among the 14 compounds (Figure 5A) and also formed the largest binding pocket (the ligand is also the largest), provides a marginally better correlation coefficient for predicted versus experimental affinities (Figure 5B).
Our results demonstrate that molecular docking can detect and predict bound-like docked poses in a cocrystal receptor. However, computational affinities associated with those docked poses, which for the most part ignore ligand and receptor flexibility and internal energies, have limitations. It is noteworthy that free energy perturbation methods have shown significant progress in remodeling and ranking docked poses around a congeneric bound cocrystal (see, e.g., ref 18). Limitations on this approach are in terms of the computational cost involved in running multiple MD simulations for each one of the compounds.
CSAR 2014 Phase 2
Successful rank-ordering of congeneric compounds depends on a suitable open binding pocket.
Challenge
Rank-order five sets of congeneric compounds based on binding affinity for the same three targets from 2014 Phase 1. We were also provided with the cocrystal structures of the 22 compounds from 2014 Phase 1. See Table 2 for the number of compounds in each of the five test sets and the number of available structures.
Methods
One advantage that we had in this phase as compared to the similar challenge faced in CSAR 2013 Phase 3 is that the target proteins FXA, SYK, and TRMD are fairly well-studied and there was a great deal of structural information available. To leverage this information, we obtained from the Protein Data Bank (PDB) all of the structures of these proteins bound to a small molecule (Table 2).
For this challenge, our goal was to compare affinity rankings based on models of each compound aligned to their most similar cocrystal, docked into their optimal cocrystals or crossdocked into a unique optimal receptor. For substructure alignments we used Open3DAlign,38 binding site volume was computed using mdpocket,39 for docking and scoring we used smina with the Vina scoring function. Then, the methods tested consisted of the following:
Align-Close is a method that used Tanimoto score to identify the most similar ligand and its receptor among all cocrystals for each compound in the test sets. Tanimoto score were computed using OpenBabel.40 Then, 3D poses were generated by aligning 25 conformers of each compound into its most similar receptor and minimized. The lowest free energy score for each compound was then selected as Align-Close.
Align-Cross tested the same method but the conformers were aligned to a reference receptor and then minimized. The reference receptor was the one with the largest binding site volume.
Dock-Close tested whether docking using smina to the most similar receptor from each compound in (a) produces better poses than substructure alignment.
Dock-Cross tested whether ranking based on docking to a single fixed receptor produces better correlations than docking to multiple receptors (even though these receptors have compounds that are more similar). Again, the reference receptor was chosen to be the one with the largest binding pocket.
Results
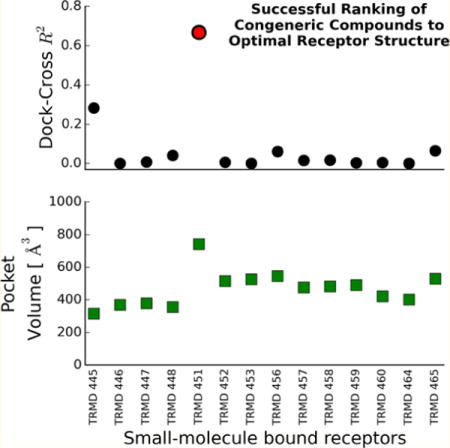
This was likely the most difficult phase of the competition as it addresses two difficult challenges in computational biology: pose prediction and scoring. Due to a technical error our predictions were not received, although they were completed before the submission deadline. The analysis presented in this section corresponds to our findings using similar methodology as the one submitted for CSAR 2013/Phase 3. Here, we only present a retrospective analysis of our methods (Figure 6). For FXA set 1, predictions were basically random. Indeed, none of the submitted methods from any group were able to outperform the null method of simply ranking the compounds based on their molecular weight (R2 = 0.30). For FXA set 2 and 3, Dock-Cross produced marginal predictions with R2 ~ 0.2. For SYK, Align-Close/Dock methods produced a correlation of R2 = 0.39, but Dock-Cross was basically random. Strikingly, Dock-Cross predicted a correlation (R2 = 0.67; Spearman’s correlation of 0.62) for TRMD when we docked to the receptor with the most open binding pocket and slightly worse for Align-Close/Cross or Dock-Close that use compound similarity information.
Figure 6.
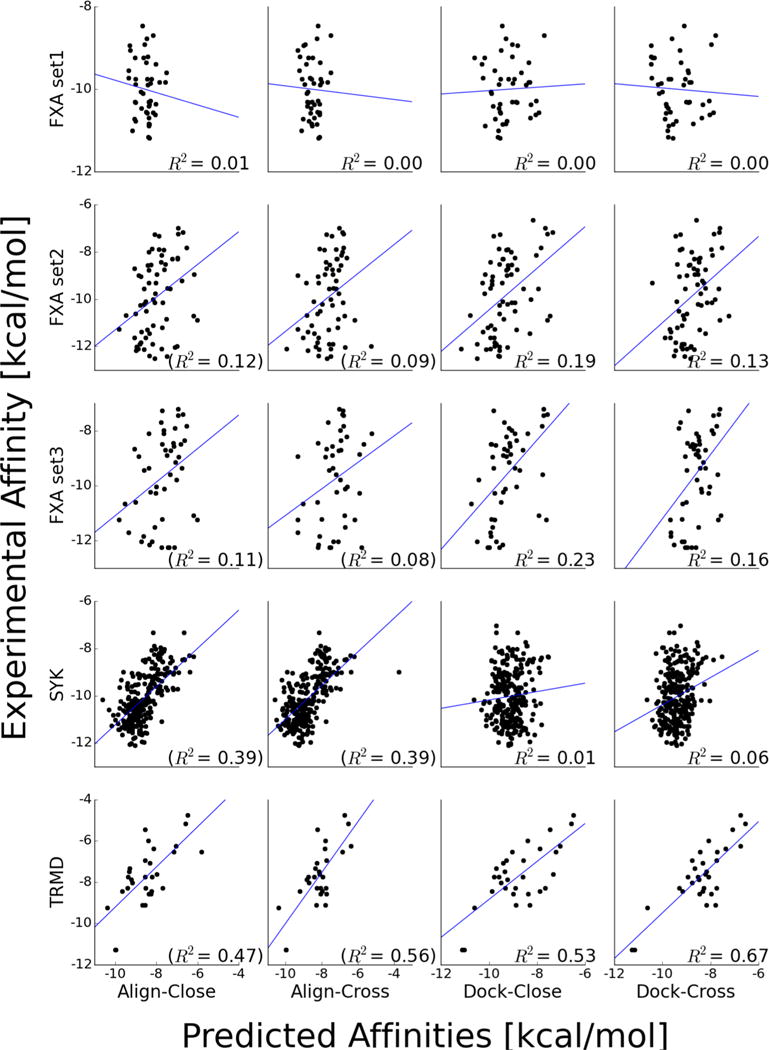
Docking congeneric compounds to optimal fixed receptor predicts meaningful correlations of experimental and computational affinities. Affinity predictions for the five sets of compounds (rows) using four different methods (columns). Some correlations were computed by removing outliers with positive scores, and their R2 are noted in parentheses. The blue line shows the linear fit for the nonoutliers, and the R2 value is shown in each subplot.
The most striking observation in our analysis is how choosing any other reference receptor than that with the largest binding pocket for TRMD led to marginal correlations for Align-Cross and random rankings for Dock-Cross (Figure 7). More interestingly, Align-Cross performed significantly better than Dock-Cross for these suboptimal receptor structures. The latter is consistent with the results for the SYK target, where we had no optimal receptor but (Align-Close/Cross) alignment still provided some discrimination. Thus, although we find that docking to the cocrystal structure with the largest binding pocket led to the best correlations between experimental and predicted (Vina) affinities (Figure 6), a priori it is not obvious whether aligning compounds or outright docking compounds would lead to the best ranking of binding affinities.
Figure 7.
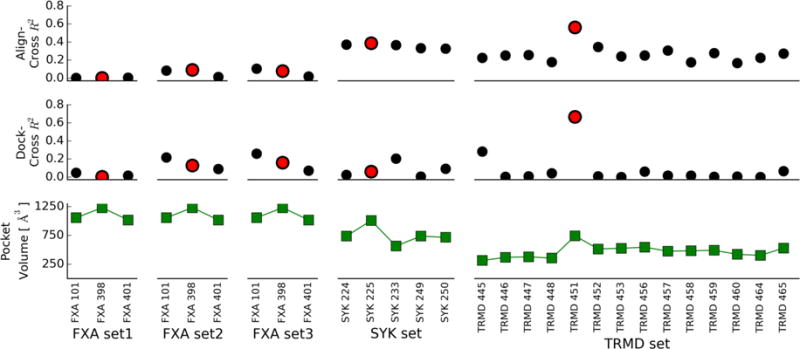
Scoring or docking to the wrong receptor leads to random predictions. The top two panels show experimental and predicted binding affinity correlation coefficients R2 for the Align- and Dock-Cross methods when aligning and docking to each of the cocrystals provided, respectively. Red circles indicate results when using receptor with the largest volume of the binding pocket (highest point for each set in the lower panel).
To understand the dichotomy between Alignment and Docking, we compare the RMSD of the predicted best poses and the bound ligand structures. Figure 8 shows that consistently the minimization of aligned poses led to lower RMSD than Dock-Cross poses. Thus, the ability for the compounds to optimize the contacts in a large pocket improves the scores over a limited minimization of an aligned pose but not its RMSD. If the pocket is small enough and does not allow for the optimization of contacts then crossdocking is futile,41 whereas the aligned compounds will nearly always recover some native contacts.
Figure 8.
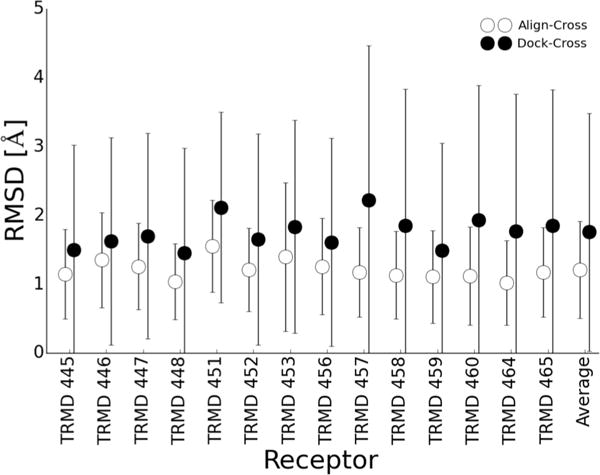
Minimizing aligned conformers produces better RMSD poses than crossdocking. Shown are the average and standard deviations of the RMSDs of the 14 TRMD compounds for the Align-Cross and Dock-Cross methods, as well as the average across all receptor structures. Consistently, substructure alignment and minimization produced superior pose predictions even when resulting in lower affinity correlation coefficients.
DISCUSSION
The purpose of the Community Structure–Activity Resource (CSAR) challenge is to propel development of new methods and approaches that address many of the critical and outstanding challenges in the field of computation structural drug discovery. Some of these problems include the prediction of tertiary protein structure using only the primary sequence information and the prediction of binding affinities of sets of congeneric compounds. For the five phases of competition, we have employed a number of established tools in addition to developing our own custom built tools to form a pipeline where expert structural and biochemical knowledge can be applied to enhance predictions.
In the first phase of the 2013 competition, we were tasked with ranking the affinities of a compound to 14 designed proteins with no known structure. Building a large set of models allowed us to identify a robust binding site and correlate structure with binding properties for the given compound. This approach is quite general and can be applied to other problems.42
In 2013 Phase 2 and 2014 Phase 1, we were challenged to select the closest-to-native structure from a set of 200 docked poses. We used a number of established methods including both scoring the poses and redocking with the AutoDock Vina scoring function, which performed very well on both data sets (Figures 3, 4, and 5). Moreover, Phase 3 of the 2013 competition and Phase 2 of the 2014 competition were centered around ranking sets of congeneric compounds based on their affinity to a given protein. Our methods that leveraged known crystallographic information coupled with the use of the AutoDock Vina scoring function performed very favorable when compared with other submissions. While the accuracy of our predictions is very far from 100% for ranking affinities, the Vina scoring function used in smina represents a robust method for redocking, docking and affinity prediction.
The methods that we employed in the five phases of competition underscore the importance of using the best receptor structure possible. We showed that the optimal receptor for cross-docking and scoring was identified by a self-consistent docking approach that used the Vina scoring function for DIG homology models; by aligning compounds to the closest cocrystal for SYK or by selecting the cocrystal receptor with the largest pocket for TRMD. Of course, an optimal receptor structure makes sense when docking assumes a mostly rigid receptor. Both aligning compounds to a known cocrystal or crossdocking can provide meaningful enrichments. However, exactly when one has an optimal receptor is not obvious.
It seems somewhat counterintuitive that ignoring receptor flexibility would lead to improved scoring predictions, especially in light of a major push in the field to understand and capture the receptor flexibility.18,23–27,43 Most likely this view is biased toward the type of problems presented in the 2013/2014 CSAR experiment. On the other hand, our results seem to suggest that ligand flexibility seems to be appropriate for current scoring functions that have yet to reflect the full complexity entailed by the changes of free energy upon binding.
Supplementary Material
Acknowledgments
The authors wish to thank Dr. David Koes for his valuable insight and comments. This work was supported by the National Institutes of Health [R01GM097082] and Commonwealth of Pennsylvania Department of Health Grant SAP 4100062224. Computational resources were supported by National Science Foundation Grant CNS1229064.
Footnotes
Supporting Information
The Supporting Information is available free of charge on the ACS Publications website at DOI: 10.1021/acs.jcim.5b00338.
Full list of terms considered when training the SVM-Score ranking method as well as the full set of plots of pose RMSD vs normalized scores in CSAR 2013 Phase 2 (as in Figure 3B). Also included are the scoring performance graphs for Align-Custom and Dock-Custom scores of the compounds in CSAR 2013 Phase 3 (as in Figure 4) (PDF)
Notes
The authors declare no competing financial interest.
References
- 1.Koes D, Khoury K, Huang Y, Wang W, Bista M, Popowicz GM, Wolf S, Holak TA, Domling A, Camacho CJ. Enabling Large-Scale Design, Synthesis and Validation of Small Molecule Protein-Protein Antagonists. PLoS One. 2012;7:e32839. doi: 10.1371/journal.pone.0032839. [DOI] [PMC free article] [PubMed] [Google Scholar]
- 2.Koes DR, Camacho CJ. Pharmer: Efficient and Exact Pharmacophore Search. J Chem Inf Model. 2011;51:1307, 1314. doi: 10.1021/ci200097m. [DOI] [PMC free article] [PubMed] [Google Scholar]
- 3.Koes DR, Camacho CJ. Zincpharmer: Pharmacophore Search of the Zinc Database. Nucleic Acids Res. 2012;40:W409–414. doi: 10.1093/nar/gks378. [DOI] [PMC free article] [PubMed] [Google Scholar]
- 4.Koes DR, Camacho CJ. Pocketquery: Protein-Protein Interaction Inhibitor Starting Points from Protein-Protein Interaction Structure. Nucleic Acids Res. 2012;40:W387–392. doi: 10.1093/nar/gks336. [DOI] [PMC free article] [PubMed] [Google Scholar]
- 5.McGaughey GB, Sheridan RP, Bayly CI, Culberson JC, Kreatsoulas C, Lindsley S, Maiorov V, Truchon JF, Cornell WD. Comparison of Topological, Shape, and Docking Methods in Virtual Screening. J Chem Inf Model. 2007;47:1504–1519. doi: 10.1021/ci700052x. [DOI] [PubMed] [Google Scholar]
- 6.Jorgensen WL. The Many Roles of Computation in Drug Discovery. Science. 2004;303:1813–1818. doi: 10.1126/science.1096361. [DOI] [PubMed] [Google Scholar]
- 7.Heikamp K, Bajorath J. The Future of Virtual Compound Screening. Chem Biol Drug Des. 2013;81:33–40. doi: 10.1111/cbdd.12054. [DOI] [PubMed] [Google Scholar]
- 8.Koes DR, Baumgartner MP, Camacho CJ. Lessons Learned in Empirical Scoring with Smina from the Csar 2011 Benchmarking Exercise. J Chem Inf Model. 2013;53:1893–1904. doi: 10.1021/ci300604z. [DOI] [PMC free article] [PubMed] [Google Scholar]
- 9.Kitchen DB, Decornez H, Furr JR, Bajorath J. Docking and Scoring in Virtual Screening for Drug Discovery: Methods and Applications. Nat Rev Drug Discovery. 2004;3:935–949. doi: 10.1038/nrd1549. [DOI] [PubMed] [Google Scholar]
- 10.Taminau J, Thijs G, De Winter H. Pharao: Pharmacophore Alignment and Optimization. J Mol Graphics Modell. 2008;27:161–169. doi: 10.1016/j.jmgm.2008.04.003. [DOI] [PubMed] [Google Scholar]
- 11.Sanders MP, Verhoeven S, de Graaf C, Roumen L, Vroling B, Nabuurs SB, de Vlieg J, Klomp JP. Snooker: A Structure-Based Pharmacophore Generation Tool Applied to Class a Gpcrs. J Chem Inf Model. 2011;51:2277–2292. doi: 10.1021/ci200088d. [DOI] [PubMed] [Google Scholar]
- 12.Wolber G, Langer T. Ligandscout: 3-D Pharmacophores Derived from Protein-Bound Ligands and Their Use as Virtual Screening Filters. J Chem Inf Model. 2005;45:160–169. doi: 10.1021/ci049885e. [DOI] [PubMed] [Google Scholar]
- 13.Huey R, Morris GM, Olson AJ, Goodsell DS. A Semiempirical Free Energy Force Field with Charge-Based Desolvation. J Comput Chem. 2007;28:1145–1152. doi: 10.1002/jcc.20634. [DOI] [PubMed] [Google Scholar]
- 14.Ewing TJ, Makino S, Skillman AG, Kuntz ID. Dock 4.0: Search Strategies for Automated Molecular Docking of Flexible Molecule Databases. J Comput-Aided Mol Des. 2001;15:411–428. doi: 10.1023/a:1011115820450. [DOI] [PubMed] [Google Scholar]
- 15.Friesner RA, Banks JL, Murphy RB, Halgren TA, Klicic JJ, Mainz DT, Repasky MP, Knoll EH, Shelley M, Perry JK, Shaw DE, Francis P, Shenkin PS. Glide: A New Approach for Rapid, Accurate Docking and Scoring. 1. Method and Assessment of Docking Accuracy. J Med Chem. 2004;47:1739–1749. doi: 10.1021/jm0306430. [DOI] [PubMed] [Google Scholar]
- 16.Cheng T, Li X, Li Y, Liu Z, Wang R. Comparative Assessment of Scoring Functions on a Diverse Test Set. J Chem Inf Model. 2009;49:1079–1093. doi: 10.1021/ci9000053. [DOI] [PubMed] [Google Scholar]
- 17.Smith RD, Dunbar JB, Jr, Ung PM, Esposito EX, Yang CY, Wang S, Carlson HA. Csar Benchmark Exercise of 2010: Combined Evaluation across All Submitted Scoring Functions. J Chem Inf Model. 2011;51:2115–2131. doi: 10.1021/ci200269q. [DOI] [PMC free article] [PubMed] [Google Scholar]
- 18.Gkeka P, Eleftheratos S, Kolocouris A, Cournia Z. Free Energy Calculations Reveal the Origin of Binding Preference for Aminoadamantane Blockers of Influenza a/M2tm Pore. J Chem Theory Comput. 2013;9:1272–1281. doi: 10.1021/ct300899n. [DOI] [PubMed] [Google Scholar]
- 19.Roy A, Kucukural A, Zhang Y. I-Tasser: A Unified Platform for Automated Protein Structure and Function Prediction. Nat Protoc. 2010;5:725–738. doi: 10.1038/nprot.2010.5. [DOI] [PMC free article] [PubMed] [Google Scholar]
- 20.Wallner B, Elofsson A. All Are Not Equal: A Benchmark of Different Homology Modeling Programs. Protein Sci. 2005;14:1315–1327. doi: 10.1110/ps.041253405. [DOI] [PMC free article] [PubMed] [Google Scholar]
- 21.Chung SY, Subbiah S. A Structural Explanation for the Twilight Zone of Protein Sequence Homology. Structure. 1996;4:1123–1127. doi: 10.1016/s0969-2126(96)00119-0. [DOI] [PubMed] [Google Scholar]
- 22.Flores TP, Orengo CA, Moss DS, Thornton JM. Comparison of Conformational Characteristics in Structurally Similar Protein Pairs. Protein Sci. 1993;2:1811–1826. doi: 10.1002/pro.5560021104. [DOI] [PMC free article] [PubMed] [Google Scholar]
- 23.Sinko W, Lindert S, McCammon JA. Accounting for Receptor Flexibility and Enhanced Sampling Methods in Computer-Aided Drug Design. Chem Biol Drug Des. 2013;81:41–49. doi: 10.1111/cbdd.12051. [DOI] [PMC free article] [PubMed] [Google Scholar]
- 24.Bottegoni G, Kufareva I, Totrov M, Abagyan R. Four-Dimensional Docking: A Fast and Accurate Account of Discrete Receptor Flexibility in Ligand Docking. J Med Chem. 2009;52:397–406. doi: 10.1021/jm8009958. [DOI] [PMC free article] [PubMed] [Google Scholar]
- 25.Carlson HA, McCammon JA. Accommodating Protein Flexibility in Computational Drug Design. Mol Pharmacol. 2000;57:213–218. [PubMed] [Google Scholar]
- 26.Leach AR. Ligand Docking to Proteins with Discrete Side-Chain Flexibility. J Mol Biol. 1994;235:345–356. doi: 10.1016/s0022-2836(05)80038-5. [DOI] [PubMed] [Google Scholar]
- 27.Morris GM, Huey R, Lindstrom W, Sanner MF, Belew RK, Goodsell DS, Olson AJ. Autodock4 and Autodocktools4: Automated Docking with Selective Receptor Flexibility. J Comput Chem. 2009;30:2785–2791. doi: 10.1002/jcc.21256. [DOI] [PMC free article] [PubMed] [Google Scholar]
- 28.Trott O, Olson AJ. Autodock Vina: Improving the Speed and Accuracy of Docking with a New Scoring Function, Efficient Optimization, and Multithreading. J Comput Chem. 2009;31:455–461. doi: 10.1002/jcc.21334. [DOI] [PMC free article] [PubMed] [Google Scholar]
- 29.Yang J, Yan R, Roy A, Xu D, Poisson J, Zhang Y. The ITasser Suite: Protein Structure and Function Prediction. Nat Methods. 2014;12:7–8. doi: 10.1038/nmeth.3213. [DOI] [PMC free article] [PubMed] [Google Scholar]
- 30.Zhang Y. I-Tasser Server for Protein 3d Structure Prediction. BMC Bioinf. 2008;9:40. doi: 10.1186/1471-2105-9-40. [DOI] [PMC free article] [PubMed] [Google Scholar]
- 31.Le Guilloux V, Schmidtke P, Tuffery P. Fpocket: An Open Source Platform for Ligand Pocket Detection. BMC Bioinf. 2009;10:168. doi: 10.1186/1471-2105-10-168. [DOI] [PMC free article] [PubMed] [Google Scholar]
- 32.Waterhouse AM, Procter JB, Martin DM, Clamp M, Barton GJ. Jalview Version 2–a Multiple Sequence Alignment Editor and Analysis Workbench. Bioinformatics. 2009;25:1189–1191. doi: 10.1093/bioinformatics/btp033. [DOI] [PMC free article] [PubMed] [Google Scholar]
- 33.Sievers F, Wilm A, Dineen D, Gibson TJ, Karplus K, Li W, Lopez R, McWilliam H, Remmert M, Soding J, Thompson JD, Higgins DG. Fast, Scalable Generation of High-Quality Protein Multiple Sequence Alignments Using Clustal Omega. Mol Syst Biol. 2014;7:539. doi: 10.1038/msb.2011.75. [DOI] [PMC free article] [PubMed] [Google Scholar]
- 34.Dunbar JB, Jr, Smith RD, Yang CY, Ung PM, Lexa KW, Khazanov NA, Stuckey JA, Wang S, Carlson HA. Csar Benchmark Exercise of 2010: Selection of the Protein-Ligand Complexes. J Chem Inf Model. 2011;51:2036–2046. doi: 10.1021/ci200082t. [DOI] [PMC free article] [PubMed] [Google Scholar]
- 35.Hawkins PC, Skillman AG, Warren GL, Ellingson BA, Stahl MT. Conformer Generation with Omega: Algorithm and Validation Using High Quality Structures from the Protein Databank and Cambridge Structural Database. J Chem Inf Model. 2010;50:572–584. doi: 10.1021/ci100031x. [DOI] [PMC free article] [PubMed] [Google Scholar]
- 36.Obfit, 2.3.90; OpenBabel, 2015.
- 37.Balius TE, Mukherjee S, Rizzo RC. Implementation and Evaluation of a Docking-Rescoring Method Using Molecular Footprint Comparisons. J Comput Chem. 2011;32:2273–2289. doi: 10.1002/jcc.21814. [DOI] [PMC free article] [PubMed] [Google Scholar]
- 38.Tosco P, Balle T, Shiri F. Open3dalign: An Open-Source Software Aimed at Unsupervised Ligand Alignment. J Comput-Aided Mol Des. 2011;25:777–783. doi: 10.1007/s10822-011-9462-9. [DOI] [PubMed] [Google Scholar]
- 39.Schmidtke P, Le Guilloux V, Maupetit J, Tuffery P. Fpocket: Online Tools for Protein Ensemble Pocket Detection and Tracking. Nucleic Acids Res. 2010;38:W582–589. doi: 10.1093/nar/gkq383. [DOI] [PMC free article] [PubMed] [Google Scholar]
- 40.O’Boyle NM, Banck M, James CA, Morley C, Vandermeersch T, Hutchison GR. Open Babel: An Open Chemical Toolbox. J Cheminf. 2011;3:33. doi: 10.1186/1758-2946-3-33. [DOI] [PMC free article] [PubMed] [Google Scholar]
- 41.Johnson DK, Karanicolas J. Druggable Protein Interaction Sites Are More Predisposed to Surface Pocket Formation Than the Rest of the Protein Surface. PLoS Comput Biol. 2013;9:e1002951. doi: 10.1371/journal.pcbi.1002951. [DOI] [PMC free article] [PubMed] [Google Scholar]
- 42.Prasad JC, Goldstone JV, Camacho CJ, Vajda S, Stegeman JJ. Ensemble Modeling of Substrate Binding to Cytochromes P450: Analysis of Catalytic Differences between Cyp1a Orthologs. Biochemistr. 2007;46:2640–2654. doi: 10.1021/bi062320m. [DOI] [PubMed] [Google Scholar]
- 43.Bowman AL, Nikolovska-Coleska Z, Zhong H, Wang S, Carlson HA. Small Molecule Inhibitors of the Mdm2-P53 Interaction Discovered by Ensemble-Based Receptor Models. J Am Chem Soc. 2007;129:12809–12814. doi: 10.1021/ja073687x. [DOI] [PubMed] [Google Scholar]
Associated Data
This section collects any data citations, data availability statements, or supplementary materials included in this article.