Abstract
Nano‐grained CoSb3 was prepared by melt‐spinning and subsequent spark plasma sintering. The phonon thermal conductivity of skutterudites is known to be sensitive to the kind and the amount of guest atoms. Thus, unfilled CoSb3 can serve as model compound to study the impact of a nanostructure on the thermoelectric properties, especially the phonon thermal conductivity. Therefore, a series of materials was prepared differing only by the cooling speed during the quenching procedure. In contrast to clathrates, the microstructure of meltspun CoSb3 was found to be sensitive to the cooling speed. Although the phonon thermal conductivity, studied by means of Flash and 3ω measurements, was found to be correlated with the grain size, the bulk density of the sintered materials had an even stronger impact. Interestingly, the reduced bulk density did not result in an increased electrical resistivity. The influence of Sb and CoSb2 as foreign phase on the electronic properties of CoSb3 was revealed by a multi‐band Hall effect analysis. While CoSb2 increases the charge carrier density, the influence of the highly mobile charge carriers introduced by elemental Sb on the thermoelectric properties of the composite offer an interesting perspective for the preparation of efficient thermoelectric composite materials.
Keywords: Skutterudite, Multiband, Melt‐spinning
Introduction
In 2013 more than 85 % of the world energy consumption was covered by energy harvested from fossil fuel sources.1 Pollution, global warming as well as the foreseeable depletion of these resources thus demand for the further development of alternative energy sources. Thermoelectric materials can convert waste heat directly into electricity. Therefore, they might play an important role in a future world energy balance.
The efficiency of a thermoelectric material is benchmarked by the dimensionless thermoelectric figure‐of‐merit ZT = S 2/(ρ(κ el + κ ph))T, where S is the thermopower, ρ is the electrical resistivity, and T is the absolute temperature. According to the Wiedemann‐Franz law, the electronic part of the thermal conductivity (κ el) is proportional to the inverse electrical resistivity. Therefore, ρ cannot be tuned without affecting the thermal conductivity (κ). As a result, two main routes for improving ZT can be followed. On the one hand efforts to decrease the phonon thermal conductivity (κ ph) can be undertaken, on the other hand routes to increase the electrical power factor α = S2/ρ can be studied.
One possibility to impede the phonon transport in a material is to add a nanostructure e.g. by implementing grains on the nanometer scale. Melt‐spinning is a rapid quenching technique, which comprises the casting of a melt on a rapidly rotating copper wheel. The melt‐spinning technique was originally developed for producing amorphous materials.2 Recent melt‐spinning experiments on filled skutterudites, however, successfully produced nano‐grained material.3–5 In contrast to type‐I clathrates,6–9 the crystallization speed during the quenching procedure was found to be slow enough to ensure the suppression of micrometer scaled grains. Herein, a systematic investigation of the dependence of the microstructure and the related physical properties of the meltspun and subsequently spark plasma sintered CoSb3 samples on the cooling speed during the quenching procedure is presented.
Experimental Section
Sample Preparation and Characterization: A series of samples with nominal composition CoSb3 was prepared using high‐purity elements (Co 99.999 %, Sb 99.999 %). The starting material for the melt‐spinning (MS) synthesis, polycrystalline CoSb3, was prepared10,11 by a solid‐state reaction. Co and Sb were mixed thoroughly in a stoichiometric ratio and annealed at 883 K for 12 h followed by a heat treatment at 948 K for 36 h under a gas mixture of 5 % H2 and 95 % Ar. The obtained powder was ground in an agate mortar, loaded into 12 mm graphite dies and hot pressed for 3 h under 50 MPa. The resulting CoSb3 pellets were used as starting materials for the MS synthesis. During a MS experiment, the material was placed into a quartz glass nozzle, inductively molten and casted on a rotating copper wheel with a diameter of 300 mm and a variable speed of 600–3000 revolutions per minute (rpm). For each experiment a sample mass of about 4.5 g was used. The typical thickness of a MS flake is approx. 15 μm. The MS flakes were powderized in an agate mortar and compacted using spark‐plasma sintering (SPS) at 823 K for 8 min under 40 MPa. The whole procedure was carried out in an argon atmosphere (99.999 %). The density of the sintered materials was determined using the Archimedes method. Information on the compacted samples is summarized in Table 1.
Table 1.
The sample code, rotation speed of the copper wheel, impurity phase, lattice parameter a, grain size GS determined from XPD data and TEM images, and relative density ρ rel of the meltspun CoSb3 samples after the SPS process.
| Code | Rotation speed /rpm | Impurities | a /Å | GS (XPD) /nm | GS (TEM) /nm | ρ rel /% |
|---|---|---|---|---|---|---|
| 600RPM | 600 | 8 % Sb | 9.0358(3) | 343.5 | 50–1000 | 95.6 |
| 1200RPM | 1200 | 5 % CoSb2 | 9.0355(2) | 336.3 | 250–800 | 97.3 |
| 1800RPM | 1800 | 5 % CoSb2 | 9.0360(2) | – | 150–400 | 88.6 |
| 2400RPM | 2400 | 8 % CoSb2 | 9.0370(3) | 157.1 | < 50 | 87.7 |
| 3000RPM | 3000 | 20 % CoSb2 | 9.0350(6) | – | – | 98.3 |
The crystal structure and phase constitution of the samples were studied by X‐ray powder diffraction (XPD) on MS and SPS samples. The XPD data were collected with a Siemens D‐5000 system (Cu‐K α 1, 15° < 2θ < 75°). The lattice parameters were obtained from Rietveld refinements of the XPD data using the Fullprof Suite software.12
The phase and microstructure analysis of the MS flakes and the SPS treated samples were determined using energy dispersive X‐ray (EDX) spectroscopy in a scanning electron microscope (SEM; Philips XL30 and FEI Quanta 200 FEG operated at 20 kV) and transmission electron microscopy (TEM; Technai TEM/STEM).
Physical Properties: All physical property measurements were performed on SPS samples. The electrical resistivity and Seebeck coefficient above room temperature were measured by a standard DC 4‐terminal method using a ZEM‐3 from ULVAC. Electrical resistivity and specific heat measurements below room temperature were done using a Physical Property Measurement System (PPMS) from Quantum Design. Hall effect measurements were performed using the horizontal rotator option of the PPMS. Thermal conductivity measurements were done using two different techniques. Firstly, the thermal conductivity was determined from the thermal diffusivity (D), measured using a Flashline 3000 from ANTER, the measured specific heat (C p), and the room temperature density (ρ RT) according to:
| κ = DCpρRT. | (1) |
Secondly, direct thermal conductivity measurements were performed between 80 and 330 K by means of the 3ω technique using a commercial nitrogen flow cryostat from Cryovac. This is an ac technique which heats the sample locally and thus reduces errors caused by radiation at room temperature and below to a negligible level 13. A narrow metal line (20 μm wide and 1 mm long) serves as both the heater and the thermometer. To avoid electrical contact between heater and sample the polished sample surfaces were covered with a thin layer of SiO2 by chemical vapor deposition. The heater structures were made by standard optical lithography techniques using a Karl Suess MJB4 mask aligner. Sputtering of a 4 nm thick titanium sticking layer and the 64 nm gold film was done in an Ardenne LS 320 S sputter system. The metal line was heated by an oscillating current at a circular frequency ω, which thus leads to a 2ω temperature oscillation of both the heater and the sample. Due to the linear temperature dependence of the metallic heater, the 2ω temperature oscillation translates to a 3ω voltage oscillation, which is detected using a lock‐in amplifier (7265, Signal Recovery). Prior to the thermal 3ω voltage detection, the first harmonic and all related higher harmonics are subtracted from the signal using an active filter design based on the technique suggested by Cahill et al.13,14
If the thermal penetration depth:
| (2) |
is large compared to the heater half width b and at least five times smaller than the sample thickness t, the amplitude of the temperature oscillation is given by 13
| (3) |
where P/l is the line power density and i is the imaginary unit. Thus, within these frequency limits, the in‐phase temperature oscillation is linear in logarithmic frequency. From the slope of this linear dependence, the thermal conductivity of the sample can be extracted. Figure 1 shows an exemplary frequency scan on the sample 1200RPM at a temperature of 300 K.
Figure 1.
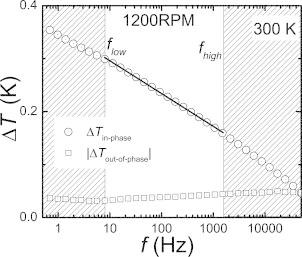
In‐phase and out‐of‐phase temperature oscillation measured during a 3ω experiment on 1200RPM at 300 K. Within the upper and lower frequency limit, the in‐phase temperature oscillation is linear in logarithmic frequency. These limits were calculated from the room temperature thermal diffusivity of 4 mm2 ·s–1, a heater width 2b of 20 μm, and the sample thickness of 0.8 mm.
The phonon thermal conductivity was calculated from the measured thermal conductivity data by subtracting an electronic contribution estimated from temperature dependent electrical resistivity data using the Wiedemann‐Franz law, with a constant Lorenz number of L 0 = 2.44 × 10⁻⁸ W·Ω·K–2.
Results and Discussion
Phase Analysis and Structural Properties
All meltspun flakes consisted of CoSb3 as majority phase and Sb and CoSb2 impurity phases (Figure 2). This is consistent with CoSb3 melting incongruently and crystallizing with moderate rate. In contrast to type‐I clathrates, the crystallization speed of CoSb3 is too small for the kinetic suppression of foreign phases. It was reported that a subsequent heat treatment of meltspun poly‐phased skutterudites during the SPS process drastically reduces the amount of impurity phases.3–5 Due to the small grain size and the homogeneous phase mixture within our meltspun flakes, a short heat treatment of 8 min at a temperature of 550 °C well below the melting point of CoSb3 (876 °C) was sufficient for significantly reducing the amount of Sb and CoSb2 impurity phases (Figure 2, Table 1). The small amount of remaining impurity phases might be explained by the evaporation of Sb during the MS or SPS procedure. Unfortunately, the time for melting the starting material during a MS experiment can hardly be kept constant so that the amount of evaporated Sb can be expected to vary considerably from one experiment to the next one. The presence of the Sb impurity phase within the sample 600RPM is due to a loss of Co during the MS procedure, which was confirmed by a Sb/CoSb2 ratio of roughly two before SPS (see Figure 2). This might be explained by chemical reaction with the quartz glass nozzle, indicating substantial overheating during this specific experiment.
Figure 2.
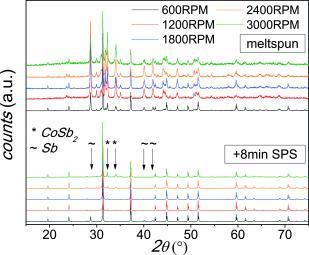
XPD patterns of CoSb3 after MS (top) and after SPS (bottom).
Figure 3 shows the cross‐section of a MS flake for the sample 1200RPM as an example. In comparison to type‐I clathrates prepared using the MS technique,6–9 the CoSb3 flakes do not show columnar grain growth from the copper wheel‐touching side to the wheel‐averted side. In contrast, the meltspun CoSb3 flakes consist of rather ball‐shaped grains. This is true even for the seemingly columnar areas on the wheel‐touching side (Figure 3 inset). We attribute the fundamentally different grain growth of clahtrates and skutterudites during a quenching procedure to the ultrafast crystallization and grain growth of clathrates,9 triggered by the short range order in the melt. A second factor may be that the competing phases Sb, CoSb2, and CoSb3 show a comparable rate of crystallization.
Figure 3.
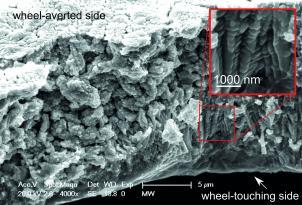
SEM picture of a fractured 1200RPM meltspun CoSb3 flake. The inset shows a magnified image of the area indicated by the red box.
The relative density ρ rel of the SPS samples varies in the range 88 % < ρ rel < 98 % (Table 1). The incomplete compaction of the samples 1800RPM and 2400RPM, evidenced by the lower relative densities compared to 600RPM and 1200RPM, is clearly confirmed by SEM (Figure 4).
Figure 4.
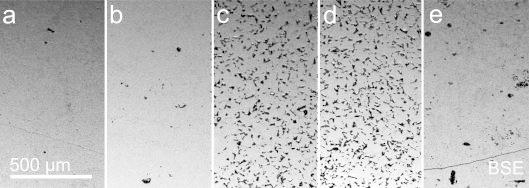
SEM images of the meltspun and SPS treated CoSb3 samples (a) 600RPM, (b) 1200RPM, (c) 1800RPM, (d) 2400RPM, and (e) 3000RPM.
Figure 5 shows the TEM images of all samples but 3000RPM after the SPS procedure. The range of grain sizes found by the TEM investigations on SPS samples is given in Table 1. There is clear evidence that the grain size strongly depends on the rotation speed of the copper wheel during the MS procedure. An increasing rotation speed increases the cooling rate and therefore leads to smaller grains. The discrepancy between the grain size of the sample 2400RPM determined by TEM and XPD is most likely due to the presence of regions with different grain sizes within the sample.
Figure 5.
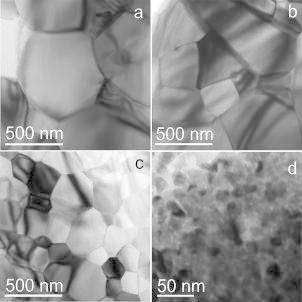
TEM bright field images of the meltspun and SPS treated CoSb3 samples from Figure 4 (a) 600RPM, (b) 1200RPM, (c) 1800RPM, and (d) 2400RPM.
Thermal Transport
The temperature dependent specific heat was measured for the samples 1200RPM and 1800RPM. At low temperatures, the specific heat can be approximated by Cp/T = γ + βT 2, where the Sommerfeld coefficient γ represents the electronic contribution and the parameter β accounts for a Debye‐like phonon contribution. As can be seen from the Cp/T vs. T 2 data (Figure 6 left), both materials show similar behavior, with a negligible Sommerfeld coefficient at low temperatures. When studying the phonon contribution to specific heat it is instructive to plot Cp/T 3 vs. log T (Figure 6 right). Within such a representation, rattling modes appear as bell‐shaped contributions on top of a Debye‐like phonon background. CoSb3 is an unfilled skutterudite and thus rattling modes at low temperatures are unexpected. Nevertheless, the data for 1200RPM, 1800RPM, and conventionally produced CoSb3 15 show a pronounced contribution from localized oscillations. This effect mainly originates from astonishingly low‐lying optical phonon modes of the CoSb3 framework.
Figure 6.
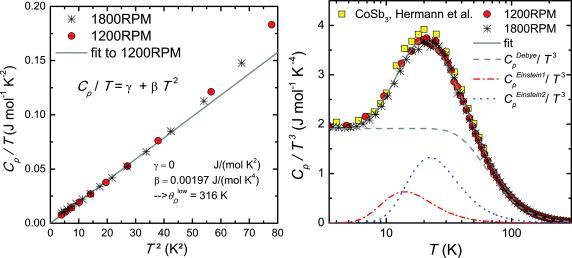
Heat capacity C p over temperature T vs. T 2 (left) for 1200RPM (red circles) and 1800RPM (black stars). From the linear fit (gray line) to the data of 1200RPM, γ and β were determined. The right panel shows C p over T 3 of 1200RPM (red circles), 1800RPM (stars), and literature data from Ref. 15 vs. T on a logarithmic scale. The gray solid line is a fit according to a mixed Debye‐Einstein model [Equation 4], the dashed lines show the Debye (dashed gray line) and the Einstein contributions (dash‐dotted red and dotted blue line).
Mathematically, the phonon specific heat of 1200RPM can be described by the sum of a Debye contribution and one or two Einstein contributions,
 |
(4) |
where x = ħω/k B T and N D and N Ei are the numbers of Debye and Einstein oscillators per formula unit. θ D, θ Ei and pi are the Debye temperature, the Einstein temperatures, and the number of degrees of freedom related to the i‐th vibrational mode, respectively. In the first attempt of our fitting procedure, we used one Einstein contribution in addition to the Debye‐like phonon background and fixed p 1 = 3 and N D + NE1 = 32. The quality of the fit in the low temperature region could, however, be significantly improved by adding a second Einstein contribution. The resulting parameters are summarized in Table 2 and the corresponding fit is shown in Figure 6 right. The second purpose for the specific heat measurements was to provide the data to calculate the thermal conductivity from the measured thermal diffusivity. To estimate the temperature dependent specific heat above room temperature, the data below room temperature are fitted using the equation described above and extrapolated to higher temperatures.
Table 2.
The Sommerfeld coefficient γ and parameter β determined from Cp/T vs. T 2 as well as Debye (θ D) and Einstein temperatures (θ Ei), and corresponding numbers of contributing oscillators (ND, N Ei) determined from C p/T 3 vs. T of 1200RPM.
| γ /mJ·mol–1 K–2 | β /mJ·mol–1 K–4 | θ D /K | ND | θ E1 /K | NE1 | θ E2 /K | NE2 |
|---|---|---|---|---|---|---|---|
| 0.00 | 1.97 | 307.8 | 28.7 | 110.1 | 3.3 | 69.0 | 0.4 |
Figure 7 shows the thermal conductivity of all meltspun and SPS treated CoSb3 samples. Data on high‐purity polycrystalline Sb (99.99 %) and literature data16 on polycrystalline CoSb3 prepared by a conventional method are added for comparison. The measurement on Sb was done to assess the impact of the Sb foreign phase in the sample 600RPM on the thermoelectric figure‐of‐merit. As seen in Figure 7 left (Flash measurements), the phonon thermal conductivity κ ph of 600RPM and 1200RPM are comparable to κ ph of conventionally produced CoSb3.16 The largest suppression of κ ph with respect to these curves is observed for 1800RPM and 2400RPM. These samples show a room temperature density, which is about 10 % lower than those of the other meltspun and SPS treated CoSb3 samples. Thus the main effect observed here is caused by scattering of phonons on additional interfaces. Within the resolution of the laser Flash technique used for these measurements, the phonon thermal conductivities of 1800RPM and 2400RPM are similar. Thus, the effect of the grain size difference discovered by TEM and XPD (Table 1) on κ ph could not be resolved. The sample 3000RPM exhibits the lowest κ ph value among the dense samples. Since 3000RPM contains a relatively large amount of CoSb2, no quantitative conclusion can be drawn.
Figure 7.
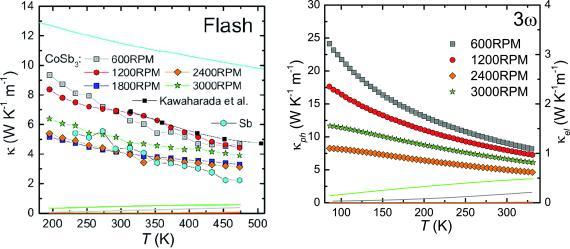
Phononic (symbols) and electronic thermal conductivity (lines, calculated using the Wiedemann‐Franz law) of all meltspun and SPS treated CoSb3 samples as a function of temperature. The black squares show literature data16 on polycrystalline CoSb3. The results shown left were determined using the Flash technique, the right panel shows 3ω data.
To study the phonon thermal conductivity in more detail, we measured our samples also by the 3ω technique. For dense samples, the heater geometry of a 3ω sample can be determined with high accuracy, making the 3ω method very precise. For porous materials with rough surfaces, on the other hand, the length of the heater can considerably deviate from its nominal value. This introduces an error in the line power density, which is a multiplicative quantity for calculating the in‐ and out‐of‐phase temperature oscillation [Equation (3)]. For 1800RPM, all deposited heater structures were even found to be damaged due to the large surface roughness. Thus, 3ω data are only available for 600RPM, 1200RPM, 2400RPM, and 3000RPM (Figure 7 right). The overall trend is similar but the absolute values of the 3ω thermal conductivity data are systematically sizably higher than the values measured by the Flash technique. Thus, Flash data appear to underestimate κ and thus overestimate ZT. The sample 2400RPM shows the lowest κ ph, which we attribute to its relatively low density. The data on 600RPM, 1200RPM, and 3000RPM show a systematic dependence on the rotation speed and thus on the cooling speed during the quenching procedure: 600RPM shows the highest and 3000RPM the lowest phonon thermal conductivity of all well compacted samples, in agreement with the decreasing grain size with increasing rotation speed. The difference in the κ ph values among all meltspun and SPS treated CoSb3 samples increases towards lower temperatures. This is in agreement with the increase of the phonon mean‐free‐path associated with the freezing of Umklapp processes upon cooling.
Electronic Transport
Figure 8 shows the zero‐field electrical resistivity of all investigated CoSb3 samples as a function of temperature. 1200RPM, 1800RPM, and 2400RPM exhibit semiconductor‐like electrical resistivity behavior in the whole temperature range, whereas 600RPM and 3000RPM show features of weak metallicity. This is in agreement with the relatively large amount of foreign phases in 600RPM (8 % Sb) and 3000RPM (20 % CoSb2). Surprisingly, the electrical resistivity of the poorly compacted samples 1800RPM and 2400RPM is comparable to the resistivity of 1200RPM. Our Hall effect analyses presented below confirm that the charge carrier mobilities are comparable in 1200RPM, 1800RPM, and 2400RPM. A reason for this behavior might be the SPS mechanism: the compaction is achieved by pressure and heat generated by an electrical current flowing through the material. Thus, even in samples with low densities there are continuous low‐resistance current paths through the sample.
Figure 8.
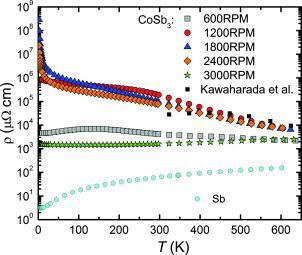
Electrical resistivity of all meltspun and SPS treated CoSb3 samples as a function of temperature. The black squares are literature data for polycrystalline CoSb3,16 the cyan hexagons show data on polycrystalline Sb.
The influence of CoSb2 and Sb impurity phases on the electrical transport properties of CoSb3 can be revealed by Hall effect measurements. The Hall coefficients of the CoSb3 samples are strongly temperature dependent except for the sample 3000RPM (Figure 9). This indicates that the electrical conduction is not simply metal‐like but has to be described by a more complex model. A further indication for multiband transport can be found using the so‐called Kohler's plot.17 In an isotropic single‐band conductor with a constant scattering time τ across the whole Fermi surface the magnetoresistance should follow Kohler's rule:
| (5) |
Figure 9.
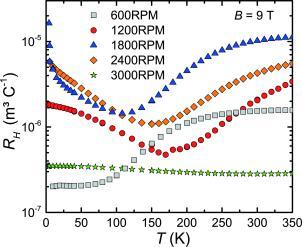
Hall coefficient of all meltspun and SPS treated CoSb3 samples as a function of temperature.
according to which magnetoresistance isothermes should fall on a universal curve when plotted against B/ρ (0, T). Here, Δρ (B, T) = ρ (B, T) – ρ (0, T) and B = μ 0 H. This scaling is strongly violated for all CoSb3 samples, as exemplarily shown for the sample 1200RPM in Figure 10. This might be due to multi‐band effects in the studied samples. Thus, we describe the electrical transport properties using a two‐band model. When considering two independent bands it is possible to express a materials' properties by those of the individual bands. This idea is well established and results in the following expression for the magnetoresistance:18
| (6) |
Figure 10.
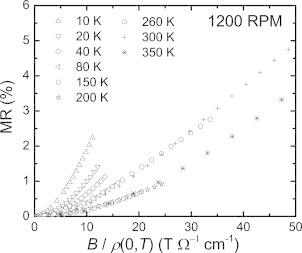
Magnetoresistance data plotted as a function of B/ρ(0, T) at different temperatures for the sample 1200RPM, revealing a clear departure from Kohler's rule.
where
| (7) |
is the saturation value of the magnetoresistance and
| (8) |
is the effective charge carrier mobility. RH ,1 and RH ,2 are the single band Hall coefficients, σ 1 and σ 2 the corresponding conductivities. The total electrical conductivity is given by:
| σ = σ1 + σ2. | (9) |
The low‐field approximation for the Hall coefficient is given by
| (10) |
To extract the single band properties, we first fit the magnetoresistance data (Figure 11 left) using Equation (6) to determine MR∞ and μ eff 2. The sign of μ eff depends on the sign of RH ,1 + RH ,2. For the samples studied herein, predominant hole conduction is evidenced by the (predominantly) positive thermopower (Figure 13) and the positive Hall coefficient (Figure 9 and Figure 11 right for 1200RPM) in the entire temperature range. The low‐field Hall coefficient, the zero‐field electrical conductivity (Figure 8), MR∞, and μ eff are four known values, from which the four unknowns σ 1, σ 2, RH ,1, and RH ,2 can be determined. The single band charge carrier concentrations and charge carrier mobilities can be calculated from n 1,2 = –1/(eRH 1,2) and μ 1,2 = |RH 1,2| σ 1,2. They are displayed in Figure 12. n 1 (n 2) is found to be positive (negative). Therefore, n 1 (n 2) and the corresponding charge carrier mobility μ 1 (μ 2) are denoted by nh and μ h (ne and μ e). All quantities show similar behavior for 1200RPM, 1800RPM, and 2400RPM. 600RPM and 3000RPM show weaker temperature dependencies and sizably larger absolute values for some of the quantities. 3000RPM contains 20 % of CoSb2 (Table 1). The large hole and electron concentration might thus stem from this foreign phase. 600RPM on the other hand is the only sample that contains a sizeable amount of Sb (8 %, Table 1). This seems to be responsible for the very large electron and hole mobilities. Recent spin‐ and angle‐resolved photoemission spectroscopy experiments on Sb confirmed topological surface states for this material.19 Interestingly, for CoSb3 based skutterudites, a small amount of elemental Sb was earlier found to improve the overall electrical powerfactor of these materials 20. For one of the samples presented in Ref. 20, even the thermoelectric figure‐of‐merit was found to be improved by a small amount of elemental Sb. This is of special interest because, in the absence of size or interface effects, the figure‐of‐merit of a composite should not exceed the value of any component.22 Therefore, we measured the thermopower of all meltspun and SPS treated CoSb3 samples and of Sb.
Figure 11.
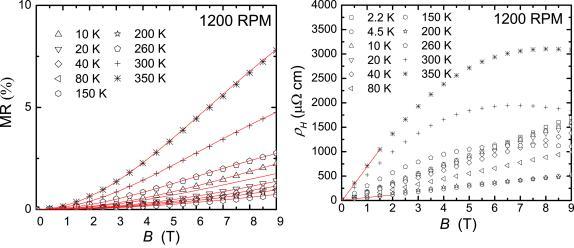
Magnetoresistance data and the Hall resistivity data ρ H (right) of the sample 1200RPM as a function of the applied magnetic field B. The initial slope of the ρ H (B) curves is the Hall coefficient R H. Fits are shown as red solid lines.
Figure 13.
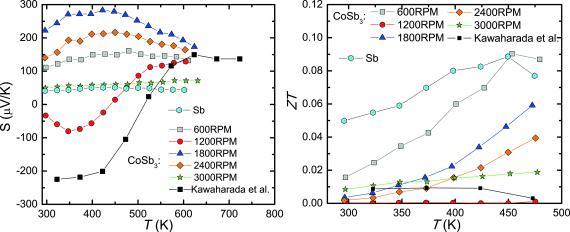
Thermopower (left) and thermoelectric figure‐of‐merit (right) of all investigated CoSb3 samples and of high‐purity (99.99 %) elemental Sb vs. temperature. The black squares show literature data of polycrystalline CoSb3.16
Figure 12.
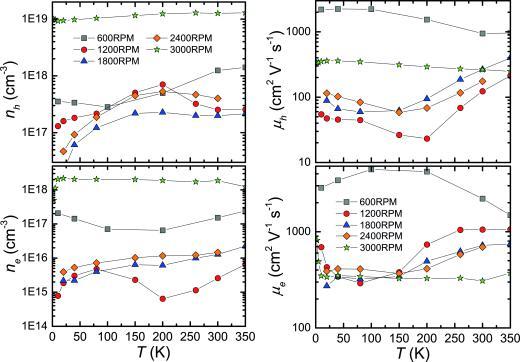
Results of a two‐band Hall effect analysis evaluated using Equations (5)–(10). The left panel shows the temperature dependencies of the charge carrier concentrations of all investigated CoSb3 samples within the individual bands, the right panel the corresponding temperature dependencies of the Hall mobilities.
The thermopower (Figure 13) of 1200RPM resembles that of conventionally produced polycrystalline CoSb3.16 The large spread in the temperature dependencies observed among all meltspun and SPS treated CoSb3 samples might be due to the different amounts of Sb and CoSb2 present in the samples in addition to the slightly varying stoichiometry.
The thermoelectric figure‐of‐merit ZT (Figure 13 right) of all meltspun and SPS treated CoSb3 samples and of polycrystalline Sb was determined taking into account the thermal conductivity data determined by the Flash measurements (Figure 7 left). This was done because Flash thermal conductivity data are available up to higher temperatures for all investigated samples. Interestingly, the two less perfectly compacted samples 1800RPM and 2400RPM show a significantly higher ZT than the conventionally prepared sample16 and the sample 1200RPM. SEM and XPD investigations revealed that 1200RPM and 1800RPM show a comparable amount of foreign phases (5 % CoSb2). These two materials differ mainly by their density and the grain size. Interestingly, the reduced density in 1800RPM does not result in a reduced conductivity of the material. The phonon thermal conductivity, however, was found to be sensitive to changes of the density. The increase of ZT of 1800RPM and 2400RPM is thus explained by their lower density and thermal conductivity, respectively, and the enhanced thermopower.
Conclusions
We have prepared a series of five different CoSb3 samples by melt‐spinning. This was done by varying the rotation speed of the Cu wheel (300 mm diameter) from 600 to 3000 rpm in steps of 600 rpm. Our SEM investigations on the cross‐section of a 1200RPM meltspun flake revealed a different crystallization process as compared to type‐I clathrates. The secondary phases Sb and CoSb2 are not kinetically suppressed, revealing a moderate rate of crystallization and grain growth of the skutterudite phase. In contrast to type‐I clathrates, no columnar grain growth was observed. Instead, the flakes consist of small, ball‐shaped grains. As was reported before for filled skutterudites,3–5 TEM and XPD investigations on the meltspun and SPS treated samples revealed a correlation of the grain size on the cooling speed during the quenching procedure. Due to the short time and moderate sintering temperature, the nano‐structure mainly observed in 2400RPM could even be preserved during the SPS procedure. Density measurements and SEM investigations on the meltspun and SPS treated materials revealed an incomplete compaction of 1800RPM and 2400RPM. Flash thermal conductivity measurements revealed a significantly lower phonon thermal conductivity for 1800RPM and 2400RPM. This was confirmed for 2400RPM by 3ω thermal conductivity measurements. Surprisingly, the electronic properties were found to be less affected by the incomplete compaction, leading to an overall increase of ZT. We explain this by the nature of the SPS technique, which compacts the powders by high pressures and by heat generated by large currents. In the case of CoSb3, this leads to low resistance current paths even in the less perfectly compacted materials. As was reported before,4 our 3ω measurements revealed a systematic decrease of the phonon thermal conductivity with decreasing grain size. As expected from the larger phonon mean‐free‐paths, caused by the freezing of Umklapp processes, the differences in the phonon thermal conductivity caused by boundary scattering increase with decreasing temperature. The influence of Sb and CoSb2 impurity phases in our CoSb3 samples on the electronic properties was studied using a two‐band approach. CoSb2 increases the charge carrier concentration, whereas Sb adds highly mobile charge carriers. Our thermoelectric investigations on the sample series is completed by resistivity and thermopower measurements. The sample including elemental Sb, 600RPM, was found to possess the largest ZT of our CoSb3 sample series in the entire studied temperature range. Thermopower, resistivity, and thermal conductivity measurements on Sb yield a slightly lower ZT than for 600RPM at 475 K. A similar effect has earlier been observed for Yb filled CoSb3 (Ref. 20), where a small amount of elemental Sb increased ZT from 1 to 1.2 at 800 K. The surprising improvement of ZT of the skutterudites beyond the limit given by the maximum ZT of its components (Sb and CoSb3) raises the interesting question of the role of the topological surface states of Sb19 for the thermoelectric properties of the Sb‐CoSb3 composite. The application of Sb‐CoSb3 within a thermoelectric generator would, however, be problematic since the diffusion of the highly volatile Sb to the cooler parts of the device as well as the sublimation of Sb21 would cause degradation of the overall efficiency in the long run.
Acknowledgements
The authors thank J. Schalko for preparing insulating SiO2 layers. The 3ω heater structures were fabricated at the cleanroom facilities (ZMNS, Center for Micro‐ and Nanostructures) at the TU Wien. We acknowledge financial support from the Austrian Science Fund (FWF project TRP 176‐N22 and doctoral program W1243 Solids4Fun) and from the Deutsche Forschungsgemeinschaft (DFG SPP 1386 ‐ project nanOcla). Parts of the work were supported by the Christian Doppler Laboratory for Thermoelectricity, TU Wien.
Dedicated to Professor Yuri Grin on the Occasion of His 60th Birthday
References
- 1. British Petroleum Company, BP Statistical Review of World Energy, June 2014, 2014.
- 2. Klement W. , Willens R. H. , Duwez P. , Nature 1960. , 187 , 869 . [Google Scholar]
- 3. Li H. , Tang X. , Su X. , Zhang Q. , Appl. Phys. Lett. 2008. , 92 , 202114 . [Google Scholar]
- 4. Li H. , Tang X. , Su X. , Zhang Q. , Uher C. , J. Phys. D: Appl. Phys. 2009. , 42 , 145409 . [Google Scholar]
- 5. Su X. , Li H. , Yan Y. , Wang G. , Chi H. , Zhou X. , Tang X. , Zhang Q. , Uher C. , Acta Mater. 2012. , 60 , 3536 . [Google Scholar]
- 6. Laumann S. , Ikeda M. , Sassik H. , Prokofiev A. , Paschen S. , J. Mater. Res. 2011. , 26 , 1861 . [Google Scholar]
- 7. Laumann S. , Ikeda M. , Sassik H. , Prokofiev A. , Paschen S. , Z. Anorg. Allg. Chem. 2012. , 638 , 294 . [Google Scholar]
- 8. Prokofiev A. , Ikeda M. , Makalkina E. , Svagera R. , Waas M. , Paschen S. , J. Electron. Mater. 2013. , 42 , 1628 . [Google Scholar]
- 9. Prokofiev A. , Yan X. , Ikeda M. , Löffler S. , Paschen S. , J. Cryst. Growth 2014. , 401 , 627 . [Google Scholar]
- 10. He T. , Chen J. , Rosenfeld H. , Subramanian M. , Chem. Mater. 2006. , 18 , 759 . [Google Scholar]
- 11. Eilertsen J. , Subramanian M. , Kruzic J. , J. Alloys Compd. 2013. , 552 , 492 . [Google Scholar]
- 12. J. Rodriguez‐Carvajal, FULLPROF, A Program for Rietveld Refinement and Pattern Matching Analysis (Satellite Meeting on Powder Diffraction of the XV IUCr Congress, 1990) p. 127.
- 13. Cahill D. G. , Rev. Sci. Instum. 1990. , 61 , 802 . [Google Scholar]
- 14. Cahill D. G. , Pohl R. O. , Phys. Rev. B 1987. , 35 , 4067 . [DOI] [PubMed] [Google Scholar]
- 15. Hermann R. P. , Grandjean F. , Long G. J. , Am. J. Phys. 2005. , 73 , 110 . [Google Scholar]
- 16. Kawaharada Y. , Kurosaki K. , Uno M. , Yamanaka S. , J. Alloys Compd. 2001. , 315 , 193 . [Google Scholar]
- 17. Pippard A. B. , Magnetoresistance in Metals, Cambridge University Press, Cambridge, 1988. [Google Scholar]
- 18. Chambers R. G. , Proc. Phys. Soc. A 1952. , 65 , 903 . [Google Scholar]
- 19. Hsieh D. , Xia Y. , Wray L. , Pal D. Q. A. , Dil J. H. , Osterwalder J. , Meier F. , Bihlmayer G. , Kane C. L. , Hor Y. S. , Cava R. J. , Hasan M. Z. , Science 2009. , 323 , 919 . [DOI] [PubMed] [Google Scholar]
- 20. Li L. , Checkelsky J. G. , Hor Y. S. , Uher C. , Hebard A. F. , Cava R. J. , Ong N. P. , Science 2008. , 321 , 547 . [DOI] [PubMed] [Google Scholar]
- 21. Schock H. , Brereton G. , Case E. , D′Angelo L. , Hogan T. , Lyle M. , Maloney R. , Moran K. , Novak L. , Nelson C. , Panayi A. , Ruckle T. , Sakamoto J. , Shih T. , Timm E. , Zhang L. , Zhu G. , ASME J. Energy Resour. Technol. 2013. , 135 , 022001 . [Google Scholar]
- 22. Bergman D. J. , Levy O. , J. Appl. Phys. 1991. , 70 , 6821 . [Google Scholar]


