

Abstract
Objective
Individuals with obesity may be less sensitive to the taste of fat, and it is hypothesized that this is due to excess dietary fat intake. This study assessed the effect of a 6‐week low‐fat (LF) or portion control (PC) diet matched for weight loss on fat taste thresholds, fat perception, and preference in people with overweight/obesity.
Methods
Participants (n = 53) completed a randomized dietary intervention and consumed either a LF diet (25% fat) or PC diet (33% fat) for 6 weeks. Fat taste thresholds (lowest detectable fat concentration), fat perception (discrimination ability), preference, and anthropometry were assessed at baseline and week 6.
Results
Consumption of a LF diet (n = 26) and PC diet (n = 27) reduced participants' weight (P < 0.001), with no significant differences between groups (LF, −2.9%, PC, −2.7%). Both diets resulted in a decrease in fat taste thresholds (P = 0.014), and the effect tended to be stronger in the LF diet vs. the PC diet (P = 0.060). The ability to perceive different fat concentrations in foods was increased after the LF diet only (P = 0.017); however, food preference did not change on either diet.
Conclusions
A PC and LF diet both increase fat taste sensitivity in people with overweight/obesity, with the strongest effect after the LF diet.
Introduction
Excess fat consumption is a major cause of excess energy intake and is thus a key contributor to weight gain 1. Identifying potential mechanisms such as appetite control and food motivation is important in understanding how overweight/obesity could be treated and prevented 2. Recent evidence has suggested that an individual's ability to detect fats within the alimentary canal (oral cavity and gastrointestinal (GI) tract) may be an associative factor for development of obesity, with an impaired response to detecting fats being linked to excess fat consumption 3.
Free fatty acids, the breakdown products of dietary fat, are detected by fatty acid receptors 4 throughout the alimentary canal, specifically the gustatory system where they contribute to fat taste and the cephalic response and the GI system where they influence gut motility and the hormonal satiety cascade 5. In individuals with obesity, oral and GI chemoreception of fatty acids is attenuated 5, possibly predisposing these individuals to high intakes of fatty foods 6. This is a controversial area, with some studies reporting inverse relationships between fat taste sensitivity and fat consumption 7, 8, 9, 10 and others not 11, 12.
To date, there has been limited research investigating the modulation of fat taste sensitivity via dietary changes. Hypothetically, an individual following a low‐fat (LF) diet would experience increased chemoreception for fatty acids throughout the alimentary canal, which may in turn help to maintain long‐term fat and energy intake reduction (Figure 1). Conversely, it would be expected that an individual who did not modify their fat intake would not experience changes to their fat taste sensitivity. The aim of this study was to assess the effect of a short‐term weight‐loss LF diet versus a short‐term weight‐loss portion control (PC) diet on fat taste thresholds, fat perception, and fat preferences in participants with overweight/obesity.
Figure 1.
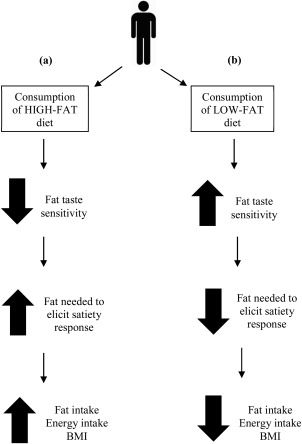
The hypothesized changes to fat taste sensitivity in the oral and GI tract that may occur when individuals follow a habitual LF diet or high‐fat diet. (a) After habitual consumption of a high‐fat diet, it would be expected that fat taste sensitivity in the oral and GI tract would decrease which would increase the amount of fat required to elicit a satiety response in the GI tract, therefore increasing total energy and fat intake and in turn increasing BMI. (b) However, after habitual consumption of a LF diet, it would be expected that individuals would have an increased sensitivity to fatty acids in the oral and GI tract which would therefore decrease the amount of fat that is required to elicit satiety responses within the GI tract and in turn decrease total energy and fat consumption, thus reducing BMI.
Methods
Participants
A power calculation was conducted to determine an appropriate sample size for the study. Using data from a previous study 9, we expected to detect a threshold difference of 2.2 mM oleic acid (C18:1) between baseline and week 6. α was set at 95% confidence, and β at 90% confidence and it was calculated that 26 people per dietary group were required for the study to have adequate power.
Participants were recruited from the suburbs surrounding Deakin University, Burwood, Victoria, Australia. Participants had to meet the following criteria: body mass index (BMI) > 25 kg/m2, non‐smoker and 18‐75 years of age. Participants were excluded if they were pregnant or breastfeeding or had a medical condition that affected their taste or weight‐loss ability. This study was approved by the Deakin University Human Research Ethics Committee and is registered with the Australian New Zealand Clinical Trials Registry (ANZCTR trial number: ACTRN12611000679987). Written informed consent was obtained from all participants prior to commencing the study.
Study outline
This study was a randomized dietary intervention where participants followed one of two weight loss diets: 1) a LF diet (<25% total energy from fat) or 2) a PC diet (33% total energy from fat, reduction in total energy by 25%). All participants were required to attend one laboratory session at baseline and week 6 during which detection threshold tests for C18:1, sucrose, and NaCl using ascending forced choice triangle tests; a fat ranking task using custard samples with varying fat contents; preference ratings for LF and regular‐fat foods; and anthropometric measures, were measured. Participants were also required to complete a one‐day food record at baseline and weeks 2, 3, 4, and 6 and a food frequency questionnaire at baseline and week 6 to determine habitual intake and compliance.
Low‐fat diet
This 25% energy from fat diet was designed to reduce the consumption of full fat dairy products, fatty meats, baked products, high‐fat spreads, and overall kilojoule intake 13. Dietary counseling was overseen by the coordinating dietitian and provided by trained research staff. Participants were given a 30‐45 min face‐to‐face counseling session at baseline, and a booklet which contained all of the information needed to follow the diet. To assist with compliance, participants were given a low‐fat margarine (Flora Ultra‐Light, Unilever, Epping, Australia), four packets of LF crackers (Sakata Rice Snacks Australia, Laverton North, Australia), and one packet of popcorn kernels (Popping Corn, Riviana Foods, Scoresby, Australia) as alternatives to high‐fat spreads and snack foods. Participants were also contacted by phone on a weekly basis throughout the intervention to keep participants motivated and accountable.
Portion control diet
The PC diet (33% energy from fat) was designed to decrease participants’ energy intake by 25%. This diet was based on the Australian government campaign, “Swap it, don't stop it,” 14. Participants were instructed to reduce the consumption of their usual diet. Participants had a one‐on‐one counseling session with trained research staff, outlining how to reduce their energy intake by 25%. To help reduce meal sizes, participants were given guidance on the following four key concepts; (1) use a smaller plate as this makes a little food seem a lot, (2) eat mindfully by taking time to chew your food properly and eat slowly 15, (3) avoid activities such as watching television or reading while eating as this can distract you from noticing when you are full, (4) follow the 80% rule which was to stop eating before you are completely full, which ties in with concept (2) 16. Participants were also given ideas on how to reduce meal size when eating out of the home. To aid in compliance, participants were given a small, appetizer sized plate (23 cm) for all meals 16, 17, 18. Weekly calls were made to those following the PC diet to answer any questions and to keep participants motivated.
Anthropometry
At baseline, height (m) was measured using a free standing stadiometer. Body weight (kg) (Body Scan Composition Monitor Scales, Tanita, Cloverdale, Australia), waist and hip circumferences 19 were measured at baseline and week 6. BMI was calculated (BMI = weight (kg)/height (m2)).
Dietary assessment and compliance
Each participant completed a one‐day food record at baseline and weeks 2, 3, 4, and 6. Participants were asked to, where possible, weigh the foods they consumed (participants used their own scales) or use standard metric measuring cups or common serving sizes. The one‐day food records were analyzed using the AUSNUT 2007 food composition database and FoodWorks 2009 software, version 7 (Xyris software, Highgate Hill, Australia). From these data, the mean energy intake (kJ), macronutrient distribution (% energy from fat, protein and carbohydrate, and grams of fat, protein and carbohydrate), type of fat (grams and % of monounsaturated, polyunsaturated or saturated), and amount of sodium (mg) consumed were calculated.
Participants were also required to complete a food frequency questionnaire that recorded how frequently they consumed common foods identified in the 1995 Australian National Nutrition Survey over the previous month 20. In total, 120 food items were assessed. Participants responded on a scale ranging from “never or less than once a month” to “six or more times per day.” Each frequency category was converted into a daily equivalent value and then categorized into specific food groups.
C18:1 solutions
C18:1 solutions were prepared as previously outlined by Haryono et al. 21.
Fat taste thresholds
Fat taste thresholds were determined using triangle tests with ascending forced choice methodology as described by Haryono et al. 21.
Sucrose and NaCl solutions and detection thresholds
Solutions were prepared in accordance with the International Organization for Standardization as outlined by Newman and Keast 22. Testing for sucrose and NaCl thresholds was conducted using triangle tests with ascending forced choice methodology.
Fat ranking task
Custard samples were prepared according to Stewart et al. 10. Participants were asked to rank the four custard samples (0, 2, 6, or 10% fat) in order of perceived fattiness. All participants received a score out of five for this task 10.
Hedonic ratings
Participants completed a preference test with three sets of regular‐fat and LF foods. Participants were given a variety of different foods including cream cheese (Philadelphia Spreadable Cream Cheese, Kraft Foods Limited, South Wharf, Australia), vanilla yogurt (Yoplait Creamy Vanilla yogurt; National Foods, Docklands, Australia), and chocolate mousse (Nestle Chocolate Mousse, Nestle, Fonterra Brands, Auckland, New Zealand). Liking was measured on a 9‐point hedonic scale ranging from “dislike extremely” to “like extremely.”
Statistical analysis
Data were analyzed using SPSS version 21 (SPSS Inc., Chicago, IL). Repeated‐measures analysis of variance (ANOVA) was used to analyze changes in C18:1, sucrose, and NaCl oral detection thresholds; hedonic ratings; anthropometric measurements; and dietary intake from baseline to week 6 with time point as within‐subject factors and dietary intervention (LF or PC) as between‐subject factors. Wilcoxon signed‐rank tests were used to detect differences in fat ranking scores from baseline to week 6, and Mann–Whitney U tests were used for between‐group analyses. Paired t‐tests were used to establish differences in taste detection thresholds and in answers to dietary questionnaires from baseline to week 6 (significance was accepted at P < 0.01 for the food frequency data). Data that were not normally distributed were log‐transformed prior to analysis. All values are stated as mean ± SEM. Significance was accepted at P < 0.05.
Results
Participants
In total, 53 participants (LF‐26, PC‐27) completed the study (Figure 2). There were no significant differences between the groups at baseline for any of the measures (Table 1).
Figure 2.
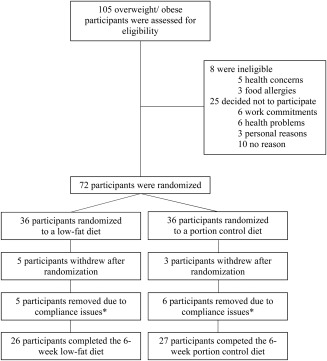
Number of participants who were screened and randomized and who completed the intervention. *These participants were removed as their dietary data did not meet compliance due to the fact that they had consumed less kilojoules than required for their basal metabolic rate (BMR). For example, some subjects had reported consuming 1,500 kJ for a whole day; therefore, these subjects were removed.
Table 1.
Mean ± SEM demographic, anthropometric, and oral detection threshold characteristics at baseline and week 6 for the total sample and diet groups
| All (n = 53) | LF (n = 26) | PC (n = 27) | ||
|---|---|---|---|---|
| Sex (M/F) | 17/36 | 8/18 | 9/18 | nsa |
| Age (years) | 56.5 ± 1.9 | 56.7 ± 2.2 | 56.3 ± 3.2 | nsa |
| Weight (kg) | ||||
| Baseline | 83.5 ± 2.4 | 86.9 ± 3.7 | 81.7 ± 3.0 | nsa |
| Week 6 | 81.9 ± 2.4 | 84.4 ± 3.7 | 79.5 ± 3.0 | P < 0.001b |
| Change | −1.9 ± 0.3 | −2.5 ± 0.4 | −2.2 ± 0.3 | |
| BMI (kg/m2) | ||||
| Baseline | 32.3 ± 0.7 | 32.7 ± 1.2 | 31.8 ± 0.7 | nsa |
| Week 6 | 29.6 ± 0.7 | 29.8 ± 1.2 | 29.4 ± 0.8 | P < 0.001b |
| Change | −2.7 ± 0.1 | −2.9 ± 0.2 | −2.4 ± 0.1 | |
| Waist–hip ratio (cm) | ||||
| Baseline | 0.9 ± 0.01 | 0.9 ± 0.01 | 0.9 ± 0.02 | nsa |
| Week 6 | 0.7 ± 0.1 | 0.7 ± 0.2 | 0.7 ± 0.2 | P = 0.032b |
| Change | −0.2 ± 0.1 | −0.2 ± 0.2 | −0.2 ± 0.1 | |
| Fat taste threshold (mM) | ||||
| Baseline | 8.0 ± 1.0 | 9.8 ± 1.1 | 6.4 ± 1.5 | nsa |
| Week 6 | 5.1 ± 1.0 | 6.7 ± 1.4 | 3.7 ± 1.0 | P = 0.014b |
| Change | −2.9 ± 0.2 | −3.1 ± 0.3 | −2.8 ± 0.4 | |
| Sucrose detection threshold (mM) | ||||
| Baseline | 6.3 ± 0.7 | 6.0 ± 0.9 | 6.5 ± 1.1 | nsa |
| Week 6 | 5.0 ± 0.7 | 5.1 ± 0.8 | 4.9 ± 1.1 | nsb |
| Change | −1.3 ± 1.0 | −0.9 ± 1.3 | −1.6 ± 1.6 | |
| NaCl detection threshold (mM) | ||||
| Baseline | 0.4 ± 0.1 | 0.3 ± 0.04 | 0.4 ± 0.11 | nsa |
| Week 6 | 0.6 ± 0.5 | 0.1 ± 0.1 | 1.2 ± 0.9 | nsb |
| Change | 0.2 ± 0.5 | −0.2 ± 0.1 | 0.8 ± 0.9 | |
BMI, body mass index; LF, low‐fat group; PC, portion control group.P values < 0.1 are shown, ns = (not significant, P > 0.1).
Indicates difference at baseline between LF and PC using independent samples t‐test.
Indicates main effect of time (from baseline to week 6) using repeated measures ANOVA.
Anthropometry
Consumption of both the LF and PC diets resulted in a significant reduction in weight (time effect, F(1, 47) = 51.2, P < 0.001), BMI (time effect, F(1, 47) = 42.1, P < 0.001), and waist–hip ratio (time effect, F(1, 51) = 4.87, P = 0.032). No significant differences between groups were observed for weight loss (P = 0.262) and waist–hip ratio (P = 0.934), but a trend for BMI (P = 0.069). The LF diet group reduced weight by 2.9% while the PC group showed a reduction of 2.7% over the 6‐week period. The weight of the two groups did not differ at week 6 (P = 0.391) (Table 1).
Dietary compliance
There were no significant differences in total energy or macronutrient intake between the two diet groups at baseline (Table 2).
Table 2.
Mean ± SEM macronutrient intakes for the low‐fat and portion control diet groups at baseline and week 6
| LF (n = 26) | PC (n = 27) | ||
|---|---|---|---|
| Total energy (kJ/day) | |||
| Baseline | 7,150.8 ± 384.5 | 7,262.3 ± 500.6 | nsa |
| Week 6 | 6,166.4 ± 209.7 | 5,693.6 ± 250.2 | P < 0.001b |
| Change | −984.4 ± 373.9 | −1,568.6 ± 614.4 | |
| Total fat (g/day) | |||
| Baseline | 64.1 ± 5.2 | 64.4 ± 5.1 | nsa |
| Week 6 | 41.4 ± 2.6 | 47.5 ± 3.2 | P < 0.001b |
| Change | −22.7 ± 5.8 | −16.8 ± 6.5 | |
| Total carbohydrates (g/day) | |||
| Baseline | 185.8 ± 9.9 | 171.7 ± 16.2 | nsa |
| Week 6 | 182.9 ± 7.1 | 148.2 ± 7.4 | nsb |
| Change | −2.9 ± 10.5 | −23.5 ± 17.3 | |
| Total protein (g/day) | |||
| Baseline | 77.8 ± 5.5 | 89.0 ± 5.4 | nsa |
| Week 6 | 75.3 ± 2.5 | 72.6 ± 4.1 | P = 0.031b |
| Change | −2.54 ± 5.3 | −16.4 ± 8.4 | |
| Percentage energy from fat (%/day) | |||
| Baseline | 33.1 ± 1.7 | 32.9 ± 1.3 | nsa |
| Week 6 | 24.9 ± 1.04 | 29.2 ± 1.0 | P < 0.001b |
| Change | −8.2 ± 2.0 | −3.9 ± 1.5 | |
| Percentage energy from carbohydrates (%/day) | |||
| Baseline | 39.5 ± 1.7 | 34.9 ± 1.5 | nsa |
| Week 6 | 45.6 ± 1.3 | 41.6 ± 1.4 | P < 0.001b |
| Change | 6.1 ± 1.9 | 6.7 ± 1.2 | |
| Percentage energy from protein (%/day) | |||
| Baseline | 18.6 ± 1.0 | 22.6 ± 0.7 | nsa |
| Week 6 | 21.5 ± 0.7 | 21.7 ± 0.9 | nsb |
| Change | 2.9 ± 1.0 | −0.8 ± 1.3 | |
LF, low‐fat group; PC, portion control group; kJ, kilojoule. P values < 0.1 are shown, ns = (not significant, P > 0.1).
Differences between groups at baseline; no differences were found.
Indicates main effect of time (from baseline to week 6) using repeated measures ANOVA.
Total energy intake (kJ)
Between baseline and week 6, both groups decreased their total energy intake (time effect, F(1, 42) = 13.1, P < 0.001). Total energy intake did not differ between the two diets (P = 0.676). There were no interaction effects for these changes (P = 0.412) (Table 2).
Total fat (g) intake and percentage energy from fat
Both groups decreased their total fat intake (g) from baseline to week 6 (time effect, F(1, 42) = 20.6, P < 0.001) and percentage of energy derived from fat (time effect, F(1, 42) = 21.1, P < 0.001 for all) (Table 2). Total fat intake and fat percentage did not significantly differ between the two diets (total fat, P = 0.494; fat percentage, P = 0.146). There was no significant interaction between time and group for total fat (P = 0.504); however, there was a trend for the diet groups to differ in percentage energy from fat (time × group, F(1, 42) = 3.79, P = 0.058).
Total carbohydrate (g) intake and percentage energy from carbohydrate
There was a trend for difference between groups in carbohydrate intake (P = 0.077), but no changes over time (P = 0.190) and no group by time interactions (P = 0.306) for total carbohydrate intake (Table 2). Percentage energy from carbohydrates increased significantly in both diet groups from baseline to week 6 (F(1, 42) = 32.9, P < 0.001) and between groups (F(1, 42) = 4.79, P = 0.034).
Total protein (g) intake and percentage energy from protein
Total protein intake significantly decreased in the LF diet and PC diet groups (time effect, F(1, 42) = 4.96, P = 0.031) (Table 2). However, these changes did not differ significantly between groups (P = 0.290) and there was no group by time interaction (P = 0.095). In addition, for percentage energy from protein, there was no significant effect of time (P = 0.204) but a trend for overall group differences (P = 0.073), and a significant interaction was observed (time × group, F(1, 42) = 5.44, P = 0.025).
Food frequency questionnaire
Low‐fat diet
During the intervention, the LF diet group significantly reduced their consumption of fried foods (P = 0.008). Additionally, leafy vegetables (P < 0.001) were consumed more frequently at week 6 when compared to baseline.
Portion control diet
Participants in the PC diet group did not significantly change their consumption of any of the food categories.
The LF diet group also consumed leafy vegetables (LF: 5.95 times/day, PC: 4.48 times/day, (P = 0.007)) on more occasions than the PC group.
Fat taste thresholds
C18:1 detection thresholds did not differ between the two diet groups at baseline (Table 1). Consumption of the LF and PC diets over the 6‐week period significantly decreased C18:1 thresholds (F(1, 46) = 6.58, P = 0.014). There was a trend for a difference in thresholds between groups at week 6 (group effect, F(1, 46) = 3.71, P = 0.060) with the LF group having a greater decrease in thresholds for C18:1. There was no significant interaction effect for group and time (P = 0.845).
There were no significant relationships between baseline fat taste thresholds and energy intake (BL, P = 0.363; WK6, P = 0.636), total fat intake (BL, P = 0.922; WK6, P = 0.604), or percentage energy from fat (BL, P = 0.340; WK6, P = 0.652) at baseline or week 6 when groups were combined. A trend was found for a positive relationship between baseline fat taste threshold and baseline BMI (P = 0.068) and a significant positive correlation was found between fat taste threshold at week 6 and BMI at week 6 (r = 0.289, P = 0.046).
Sucrose and NaCl detection thresholds
There were no significant differences in baseline sucrose (P = 0.627) and NaCl (P = 0.174) detection thresholds between the groups (Table 1). Consumption of the LF diet or the PC diet over the 6‐week period had no significant effect on detection thresholds for sucrose (P = 0.227) or NaCl (P = 0.558). No significant effect was seen for sucrose or NaCl between groups (sucrose, P = 0.910; NaCl, P = 0.208) or time by group interaction (sucrose, P = 0.738; NaCl, P = 0.303).
Fat ranking task
Scores for the fat ranking task at baseline did not differ between dietary groups (P = 0.348) (Figure 3). There was a significant increase in the fat ranking task scores following the consumption of the LF diet (P = 0.017) (Figure 3). In contrast, consumption of the PC diet had no significant effect on fat ranking task scores (P = 0.314) (Figure 3).
Figure 3.
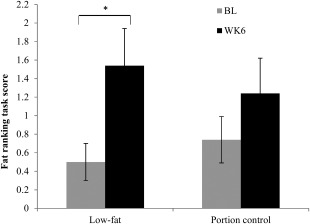
Mean ± SEM fat ranking scores at baseline (BL) and week 6 (WK6) for the LF (n = 26) and PC (n = 27) diet groups. *P < 0.05 using Wilcoxon signed‐Rank tests.
Hedonic ratings
The LF and PC diet groups did not differ in liking of regular‐fat and LF foods at baseline (Table 3). Following the consumption of the diets, there was a significant increase in the liking of LF cream cheese (time effect, F(1, 47) = 7.02, P = 0.011). There was also a significant increase in liking for regular‐fat chocolate mousse (group effect, F(1, 47) = 4.31, P = 0.043). No significant time by group interactions were observed (P > 0.05); however, there was a time by group interaction for liking of the LF yogurt (time × group, F(1, 47) = 4.48, P = 0.040).
Table 3.
Acceptance changes (mean ± SEM) using a 9‐point hedonic scale in regular‐ and low‐fat foods following consumption of the low‐fat diet or portion control diet
| LF (n = 26) | PC (n = 27) | P value | |
|---|---|---|---|
| RF chocolate mousse | |||
| Baseline | 7.2 ± 0.3 | 6.3 ± 0.4 | 0.083a |
| Week 6 | 7.3 ± 0.3 | 6.2 ± 0.3 | 0.449b |
| Change | 0.1 ± 0.3 | −0.1 ± 0.3 | |
| LF chocolate mousse | |||
| Baseline | 6.0 ± 0.3 | 5.6 ± 0.4 | 0.418a |
| Week 6 | 6.2 ± 0.4 | 5.9 ± 0.4 | 0.413b |
| Change | 0.2 ± 0.5 | 0.3 ± 0.5 | |
| RF yogurt | |||
| Baseline | 6.4 ± 0.3 | 6.2 ± 0.4 | 0.769a |
| Week 6 | 6.4 ± 0.4 | 6.6 ± 0.3 | 0.605b |
| Change | 0.0 ± 0.4 | 0.4 ± 0.5 | |
| LF yogurt | |||
| Baseline | 5.6 ± 0.4 | 6.8 ± 0.3 | 0.011a |
| Week 6 | 5.7 ± 0.4 | 6.0 ± 0.3 | 0.291b |
| Change | 0.1 ± 0.4 | −0.8 ± 0.3 | |
| RF cream cheese | |||
| Baseline | 5.6 ± 0.4 | 6.5 ± 0.4 | 0.156a |
| Week 6 | 5.8 ± 0.5 | 6.0 ± 0.4 | 0.847b |
| Change | 0.2 ± 0.4 | −0.5 ± 0.3 | |
| LF cream cheese | |||
| Baseline | 5.5 ± 0.4 | 5.6 ± 0.4 | 0.923a |
| Week 6 | 6.0 ± 0.3 | 6.8 ± 0.3 | 0.011b |
| Change | 0.5 ± 0.5 | 1.2 ± 0.4 | |
RF, regular‐fat; LF, low‐fat.
Indicates P values for the difference between groups in baseline scores using independent samples t‐tests.
Indicates P values for a main effect of time using repeated measures ANOVA.
Discussion
This study compared the effects of a 6‐week LF diet versus PC matched for weight loss on taste detection thresholds for C18:1, sucrose, and NaCl; and fat perception and hedonic ratings for regular‐fat and LF foods. Fat taste thresholds significantly decreased (increased sensitivity to fatty acids) in both groups and this decrease in threshold was specific to fatty acids; thresholds for sucrose and NaCl did not change. Fat perception, which was measured as the discrimination ability to rank different fat concentration, significantly increased only in the LF diet group.
Fat taste thresholds in both the LF and PC diet groups decreased after the 6‐week diet, with the LF diet group tending to have a larger decrease in thresholds compared to the PC group (P = 0.060). There was a trend toward the LF diet consuming a lower percentage from fat (24.9%) and gram value (41.4 g), compared to the PC group (29.2%, 47.5 g) (P = 0.058). Given that the LF group trended toward consuming less percentage energy from fat and also less gram amount of fat we cannot identify whether absolute fat intake or percent energy may be most dominant; but given that there was also a trend for a significant difference in percent energy from fat between the two groups this is worth investigating in a larger study. While significant reductions in fat taste thresholds were seen in both the LF and PC diet groups during the intervention, only the LF diet group demonstrated a significant increase in fat perception, which is similar to previous findings 9. We cannot conclusively state whether fat percentage or amount is more dominant in increasing fat perception in foods.
Interestingly, no changes in oral detection thresholds for sucrose or NaCl were seen in both diet groups. These tests were used to control for potential learning effects that may have occurred from session one to session two. As there were no changes in oral detection thresholds corresponding to changes in consumption of sucrose and sodium from baseline to week 6, it suggests that the decreases in fat taste threshold were specific to the reduction in fat intake throughout the 6‐week period.
The present study found no relationship between fat taste and fat intake at baseline or week 6. Previous data surrounding this area is conflicting, with some studies finding strong associations 8, 9, 10, and others finding no associations 11, 12. However, the cross‐sectional nature of data presented in previous studies, rather than data from intervention studies, may provide insight into these discrepancies. For instance, if two participants who consume excess dietary fat undergo a single fat taste determination, one participant's threshold may be 12 mM and the other 2 mM; this cross‐sectional data would show no correlation between oral sensitivity and fat intake. However, if the same participants both followed a LF intervention diet, and their thresholds changed to 6.4 mM and 1 mM respectively, a temporal association between fat intake and fat taste may be demonstrated. A recent study has highlighted a potential mechanism by which fat taste and energy intake are related, such that those with a higher fat taste threshold consuming significantly more energy after consuming a high fat meal 3. The implications being that lower sensitivity to fats fails to activate satiety or fullness signals after consuming a fatty meal.
The primary focus of this study was to assess whether diet modification in people with overweight and obesity can modify fat taste thresholds 8, 9, 10. Previous studies have reported that those who have lower fat taste thresholds also perform better at the fat ranking task 8, 10. This study investigated whether fat ranking performance could be increased with a change in diet over a 6‐week period and found a significant increase in fat perception after the LF diet only. This is similar to previous research which reported that fat perception can be increased after consumption of a LF diet over 4 weeks 9. Similarly with fat hedonics, we were interested in seeing if liking for high‐ or LF foods would change over time. Preference for some of the LF foods (cream cheese, chocolate mousse) were increased after consumption of the LF or PC diet; however, the findings across all foods were inconsistent. It could be hypothesized that a LF diet would need to be consumed over a longer period of time before definitive changes in hedonic would be seen.
The present study found a positive relationship between BMI and fat taste thresholds at week 6 for both groups combined, such that those with a higher BMI had higher fat taste thresholds, i.e., they were less sensitive to fatty acids. Previous research has demonstrated similar associations between fat taste sensitivity and BMI 8, 10; however, other studies have found no associations 9, 23, 24. Perhaps standardizing the diet enabled the relationship to be revealed, in that the consistency of the short‐term diet among participants minimized one of the environmental variants determining fat taste sensitivity. However, such discrepancies in findings should not be surprising, as obesity is caused by a combination of many different genetic and environmental factors.
This study needs to be considered alongside limitations which may have confounded the results. Dietary adherence is very difficult to monitor during interventions that continue over many weeks; however, the significant reduction in weight, BMI, and waist–hip ratio, along with dietary data suggest that participants adhered to their allocated diet. Food records were used to provide a snapshot of dietary intake pre‐ and post‐intervention; however, they do not necessarily reflect habitual dietary behavior as individuals often alter their eating patterns to exclude socially undesirable foods which would include foods high in fat 25. It must also be mentioned that both the LF and PC groups reduced the amount of fat they were consuming from baseline to week 6. Thus, comparison between the two groups in regards to changes in fat taste sensitivity must be interpreted cautiously as there was only a trend for differences in fat intake at week 6 between the two groups. In addition, changes in fat taste sensitivity have yet to be reported independent of weight loss; therefore, future research should focus on studies that modulate fat intake while maintaining weight of participants.
Conclusion
In summary, this study has demonstrated that following either a 6‐week LF diet or PC diet in people with overweight and obesity significantly decreased fat taste thresholds, with the strongest effect in the LF diet. This increase in fat taste sensitivity may help induce a healthy satiety response to dietary fat.
Acknowledgments
Authors would like to thank Stacey Eyres for her assistance with data collection and data entry and the study participants for their time and effort in completing the study.
Funding agencies: This project has been funded in part by NHMRC grant 1043780 (RK) and Deakin University Strategic Resource Centre funding (RK).
Disclosure: The authors declare no conflict of interest.
Author contributions: LN was involved in the study design, participant recruitment, data collection and statistical analysis, data interpretation, and the manuscript drafting; DB was involved in data interpretation and drafting of the manuscript; ST was involved in the study design, data interpretation, and drafting of the manuscript; RK was involved in the study design, data analysis and interpretation, and drafting of the manuscript. RK had overall responsibility for the research study and obtained the funding required.
References
- 1. Swinburn BA, Sacks G, Hall KD, et al. The global obesity pandemic: shaped by global drivers and local environments. Lancet 2011;378:804‐814. [DOI] [PubMed] [Google Scholar]
- 2. Blundell JE, Stubbs RJ, Golding C, et al. Resistance and susceptibility to weight gain: individual variability in response to a high‐fat diet. Physiol Behav 2005;86:614‐622. [DOI] [PubMed] [Google Scholar]
- 3. Keast RSJ, Azzopardi KM, Newman LP, Haryono RY. Impaired oral fatty acid chemoreception is associated with acute excess energy consumption. Appetite 2014;80:1‐6. [DOI] [PubMed] [Google Scholar]
- 4. Bachmanov AA, Beauchamp GK. Taste receptor genes. Annu Rev Nutr 2007;27:389‐414. [DOI] [PMC free article] [PubMed] [Google Scholar]
- 5. Little TJ, Feinle‐Bisset C. Effects of dietary fat on appetite and energy intake in health and obesity‐oral and gastrointestinal sensory contributions. Physiol Behav 2011;104:613‐620. [DOI] [PubMed] [Google Scholar]
- 6. Stewart JE, Seimon RV, Otto B, Keast RSJ, Clifton PM, Feinle‐Bisset C. Marked differences in gustatory and gastrointestinal sensitivity to oleic acid between lean and obese men. Am J Clin Nutr 2011;93:703‐711. [DOI] [PubMed] [Google Scholar]
- 7. Gilbertson TA, Liu L, York DA, Bray GA. Dietary fat preferences are inversely correlated with peripheral gustatory fatty acid sensitivity. Ann N Y Acad Sci. 1998;855:165‐168. [DOI] [PubMed] [Google Scholar]
- 8. Stewart JE, Feinle‐Bisset C, Golding M, Delahunty C, Clifton PM, Keast RSJ. Oral sensitivity to fatty acids, food consumption and BMI in human subjects. Br J Nutr 2010;104:145‐152. [DOI] [PubMed] [Google Scholar]
- 9. Stewart JE, Keast RSJ. Recent fat intake modulates fat taste sensitivity in lean and overweight subjects. Int J Obes 2012;36:834‐842. doi: 10.1038/ijo.2011.155. [DOI] [PubMed] [Google Scholar]
- 10. Stewart JE, Newman LP, Keast RSJ. Oral sensitivity to oleic acid is associated with fat intake and body mass index. Clin Nutr 2011;6:838‐844. [DOI] [PubMed] [Google Scholar]
- 11. Tucker RM, Laguna L, Quinn R, Mattes RD. The effect of short, daily oral exposure on non‐esterified fatty acid sensitivity. Chemosens Percept 2013;6:78‐85. [Google Scholar]
- 12. Tucker RM, Mattes RD. Influences of repeated testing on nonesterified fatty acid taste. Chem Senses 2013;38:325‐332. [DOI] [PubMed] [Google Scholar]
- 13. Margerison C, Nowson CA, Worsley T, Jorna MK, Frame AG. Fruit and vegetable intake prior to and following a 4‐week intervention (OZDASH study). Asia Pac J Clin Nutr 2003;12 (Suppl):S19. [Google Scholar]
- 14.The Australian National Preventive Health Agency. Swap it, don't stop it: Australian Government; 2012. Available from: http://swapit.gov.au/. [Cited 16 April, 2013].
- 15. Smit HJ, Kemsley EK, Tapp HS, Henry CJK. Does prolonged chewing reduce food intake? Fletcherism revisited. Appetite 2011;57:295‐298. [DOI] [PubMed] [Google Scholar]
- 16. Kruskall LJ, Portion distortion: Sizing up food servings. ACSM's Health & Fitness Journal 2006;10:8–14. [Google Scholar]
- 17. Laddu D, Dow C, Hingle M, Thomson C, Going S. A review of evidence‐based strategies to treat obesity in adults. Nutr Clin Pract 2011;26:512‐525. [DOI] [PubMed] [Google Scholar]
- 18. Pedersen SD, Kang J, Kline GA. Portion control plate for weight loss in obese patients with type 2 diabetes mellitus: a controlled clinical trial. Arch Intern Med 2007;167:1277‐1283. [DOI] [PubMed] [Google Scholar]
- 19. Gibson RS. Principles of Nutritional Assessment, 2nd ed. New York: Oxford University Press; 2005. [Google Scholar]
- 20.Australian Bureau of Statistics. 4804.0—National Nutrition Survey: Foods Eaten. Canberra: Australian Bureau of Statistics; 1995.
- 21. Haryono RY, Sprajcer MA, Keast RSJ. Measuring oral fatty acid thresholds, fat perception, fatty food liking, and papillae density in humans. J Vis Exp, 2014;(88): e51236. [DOI] [PMC free article] [PubMed] [Google Scholar]
- 22. Newman LP, Keast RSJ. The test–retest reliability of fatty acid taste thresholds. Chemosens Percept 2013;6:70‐77. [Google Scholar]
- 23. Mattes RD. Oral fatty acid signaling and intestinal lipid processing: support and supposition. Physiol Behav 2011;105:27‐35. [DOI] [PubMed] [Google Scholar]
- 24. Mattes RD. Oral thresholds and suprathreshold intensity ratings for free fatty acids on 3 tongue sites in humans: implications for transduction mechanisms. Chem Senses 2009;34:415‐423. [DOI] [PMC free article] [PubMed] [Google Scholar]
- 25. Potosky AL, Block G, Hartman AM. The apparent validity of diet questionnaires is influenced by numberof diet‐record days used for comparison. J Am Diet Assoc 1990;90:810. [PubMed] [Google Scholar]