

Abstract
Aims
To investigate the pharmacodynamics, efficacy and safety of empagliflozin as adjunct to insulin in patients with type 1 diabetes.
Methods
A total of 75 patients with glycated haemoglobin (HbA1c) concentrations of ≥7.5 to ≤10.5% (≥58 to ≤91 mmol/mol) were randomized to receive once‐daily empagliflozin 2.5 mg, empagliflozin 10 mg, empagliflozin 25 mg, or placebo as adjunct to insulin for 28 days. Insulin dose was to be kept as stable as possible for 7 days then adjusted, at the investigator's discretion, to achieve optimum glycaemic control. The primary exploratory endpoint was change from baseline in 24‐h urinary glucose excretion (UGE) on day 7.
Results
Empagliflozin significantly increased 24‐h UGE versus placebo on days 7 and 28. On day 28, adjusted mean differences with empagliflozin versus placebo in changes from baseline in: HbA1c were −0.35 to −0.49% (−3.8 to −5.4 mmol/mol; all p < 0.05 vs. placebo); total daily insulin dose −0.07 to −0.09 U/kg (all p<0.05 vs placebo); and weight were −1.5 to −1.9 kg (all p < 0.001 vs. placebo). In the placebo, empagliflozin 2.5, 10 and 25 mg groups, respectively, adverse events were reported in 94.7, 89.5, 78.9 and 100.0% of patients, and the rate of symptomatic hypoglycaemic episodes with glucose ≤3.0 mmol/l not requiring assistance was 1.0, 0.4, 0.5 and 0.8 episodes per 30 days.
Conclusions
In patients with type 1 diabetes, empagliflozin for 28 days as adjunct to insulin increased UGE, improved HbA1c and reduced weight with lower insulin doses compared with placebo and without increasing hypoglycaemia.
Keywords: pharmacodynamics, pharmacology, SGLT2 inhibitor, type 1 diabetes
Introduction
Insulin therapy is an essential part of the management of type 1 diabetes 1, but is often associated with weight gain and hypoglycaemia 2, 3. Despite advances in insulin formulation and delivery, patients with type 1 diabetes often fail to reach the target HbA1c of <7% 1, 4. Inadequate glucose control can lead to acute conditions such as ketoacidosis 5, and to chronic complications including retinopathy, nephropathy and cardiovascular disease 6, 7, 8. Compared with the general population, the risk of cardiovascular disease is nearly eight times greater in patients with type 1 diabetes 7, and the increased risk of mortality from heart disease is even greater 9.
Empagliflozin is a potent and selective inhibitor of the sodium glucose cotransporter 2 (SGLT2) 10 that inhibits renal glucose reabsorption and thus increases urinary glucose excretion (UGE) in patients with diabetes 11, 12. In patients with type 2 diabetes, empagliflozin given as monotherapy or as add‐on therapy (including as add‐on to basal insulin or multiple daily injections of insulin) has consistently been shown to improve glycaemic control and reduce blood pressure and weight, with a low risk of hypoglycaemia 13, 14, 15, 16, 17, 18.
As the mechanism of action of SGLT2 inhibitors is independent of the action of insulin 19, these agents have the potential to be used as an adjunct to insulin to improve glycaemic control in patients with type 1 diabetes. In an 8‐week single‐arm pilot study in patients with type 1 diabetes, empagliflozin as adjunct to insulin led to significant reductions in glycated haemoglobin (HbA1c), fasting glucose, blood pressure, weight and the frequency of symptomatic hypoglycaemic events with plasma glucose <3.0 mmol/l 12.
The objectives of this trial (EASE‐1) were to investigate the pharmacodynamics, efficacy and safety of empagliflozin 2.5, 10 and 25 mg administered as adjunct to a basal‐bolus insulin regimen in patients with type 1 diabetes.
Materials and Methods
Study Design
This was a randomized, double‐blind, placebo‐controlled, parallel‐group, phase II study conducted in one centre in Germany and one centre in Austria between 25 November 2013 and 20 April 2014 (File S1). The clinical trial protocol was approved by the Institutional Review Boards and Independent Ethics Committees and Competent Authorities of the participating centres, and the study was conducted in accordance with the Declaration of Helsinki and International Conference on Harmonization Harmonized Tripartite Guideline for Good Clinical Practice. The trial was registered with ClinicalTrials.gov (NCT01969747). All patients provided written informed consent.
Inclusion and Exclusion Criteria
This study enrolled patients with type 1 diabetes aged ≥18 to ≤65 years with a body mass index (BMI) 18.5–35 kg/m2, HbA1c ≥7.5 to ≤10.5% (≥58 to ≤91 mmol/mol), estimated glomerular filtration rate (eGFR; Chronic Kidney Disease Epidemiology Collaboration formula) ≥60 to ≤150 ml/min/1.73m2 and C‐peptide <1.5 ng/ml. To be included in the study, patients had to have received multiple daily injections of insulin, consisting of basal insulin and ≥3 daily bolus injections, for ≥12 months before screening. Total daily insulin requirement had to be ≤1.5 U/kg at screening and the insulin administration algorithm had to have been stable for ≥12 weeks before screening.
Exclusion criteria included acute symptomatic urinary tract infection (UTI) or genital infection; chronic or recurrent (≥3 annual episodes) cystitis; treatment with any antihyperglycaemic drug except insulin in the 3 months before screening; hypoglycaemia that required hospitalization or emergency treatment in the 3 months before screening; unawareness of hypoglycaemia (investigator's judgment); ≥2 unexplained hypoglycaemic episodes in the 3 months before screening; diabetic ketoacidosis that required hospitalization or emergency treatment in the 12 months before screening; brittle diabetes (investigator's judgement); alanine transaminase, aspartate transaminase or alkaline phosphatase >3 × upper limit of normal at screening; treatment with anti‐obesity drugs, surgery or aggressive diet leading to unstable body weight 3 months before screening; any other investigational drug intake within 30 days of study drug intake.
Treatment and Interventions
After a 2‐week, open‐label, placebo run‐in period, eligible patients were randomized in a 1 : 1 : 1 : 1 ratio to receive once‐daily empagliflozin 2.5 mg, empagliflozin 10 mg, empagliflozin 25 mg, or placebo as adjunct to insulin for 28 days. Randomization was undertaken using a third‐party interactive voice and web response system, and was stratified by site. The insulin regimen was to be kept stable (no change to basal insulin dose, insulin‐to‐carbohydrate ratio, or correction factor for bolus insulin) during the first 7 days of treatment (stable insulin period), then was freely adjustable according to the investigator's judgement to achieve optimum glycaemic control for the remaining 21 days of treatment (flexible insulin period). In cases of hypoglycaemia during the stable insulin period, patients were to ingest carbohydrates; however, insulin could be adjusted for safety reasons at any time if deemed necessary by the investigator.
Patients were admitted to the study site from 2 days before drug administration to day 8 of drug administration. Patients were called by site personnel on day 9 to discuss insulin adjustments, and further telephone calls were agreed upon as needed. Patients returned for ambulatory visits on days 14, 21 and 27, and stayed at the study site overnight on day 28. Patients returned for a follow‐up visit 7 days after the end of treatment. For determination of 24‐h UGE, all urine voided during 24 h was collected at baseline and on days 1, 7 and 28.
Patients received diet and exercise counselling based on local recommendations at the start of the run‐in period and were reminded to follow their usual diet and exercise plan at every study visit. Patients were instructed to keep their diet and daily carbohydrate intake as stable as possible throughout the trial. Patients were provided with a self‐monitoring of blood glucose device. Self‐monitoring of blood glucose was performed before breakfast, lunch and dinner and at bedtime, with additional tests as recommended by the investigator, or if a patient experienced signs or symptoms of hyper‐ or hypoglycaemia. Patients were asked to record in an electronic diary their insulin dose, carbohydrate intake, blood glucose and blood ketones throughout the treatment and follow‐up periods.
Endpoints and Assessments
The primary endpoint was exploratory and was the change from baseline in 24‐h UGE on day 7. Other endpoints included: change from baseline in 24‐h UGE on day 28; change from baseline in HbA1c on day 28; change from baseline in fasting plasma glucose (FPG) on days 7 and 28; change from baseline in mean daily glucose (MDG; eight‐point profile) on days 7 and 28; change from baseline in weekly mean recorded total insulin use in the fourth week of treatment; change from baseline in weight on day 28; and changes from baseline in systolic blood pressure (SBP) and diastolic blood pressure (DBP) on day 28.
Safety endpoints included vital signs, clinical laboratory variables and adverse events (AEs) with onset between the first intake of study drug and up to 7 days after the last dose of study drug [coded using preferred terms in the Medical Dictionary for Drug Regulatory Activities (MedDRA) version 17.0]. Rates of hypoglycaemic episodes per 30 days were based on episodes with onset between the first intake of study drug and up to 1 day after the last dose of study drug. Events consistent with UTI and genital infections were identified using prospectively defined search categories based on 73 and 89 MedDRA preferred terms, respectively.
Statistical Analysis
Sample size calculations indicated that 72 patients (18 per treatment group) would provide ≥95% power to detect a difference in the primary endpoint of 65 g/24 h for empagliflozin 10 mg compared with placebo and 79 g/24 h for empagliflozin 25 mg compared with placebo, assuming a standard deviation of 5, 29 and 27 for placebo, empagliflozin 10 mg and empagliflozin 25 mg respectively, with a two‐sided significance level of 0.05.
Pharmacodynamic and efficacy analyses were performed on the full analysis set, which included patients treated with ≥1 dose of study drug who had a 24‐h UGE measurement at baseline and at day 1 and/or day 7. Safety analyses were descriptive and were performed on the treated set (patients treated with ≥1 dose of study drug).
The primary endpoint was assessed using an analysis of covariance (ancova) model, with treatment as a fixed effect and baseline 24‐h UGE as a continuous covariate. A last observation carried forward (LOCF) approach was used to impute missing data. Changes from baseline in other efficacy endpoints were analysed using an ancova model, with treatment as a fixed effect and the baseline value for the respective endpoint as a linear covariate. The ancova model for MDG on days 7 and 28 included weekly mean recorded insulin dose at week 1 and week 4, respectively, as an additional linear covariate. UGE, insulin dose and carbohydrate intake over time were analysed descriptively.
Results
Patients
A total of 75 patients were randomized and treated with placebo (n = 19), empagliflozin 2.5 mg (n = 19), empagliflozin 10 mg (n = 19), or empagliflozin 25 mg (n = 18). No patients prematurely discontinued from the study. Baseline characteristics were similar across treatment groups, except for a higher mean BMI in the empagliflozin 10 mg group and a higher proportion of females in the empagliflozin 25 mg group (Table 1).
Table 1.
Patient demographics and baseline characteristics
| Placebo | Empagliflozin 2.5 mg | Empagliflozin 10 mg | Empagliflozin 25 mg | |
|---|---|---|---|---|
| Number of patients | 19 | 19 | 19 | 18 |
| Male | 13 (68.4) | 15 (78.9) | 15 (78.9) | 10 (55.6) |
| Age, years | 40.5 (10.6) | 41.9 (12.4) | 39.6 (11.6) | 41.9 (9.7) |
| Race | ||||
| White | 19 (100.0) | 19 (100.0) | 19 (100.0) | 18 (100.0) |
| Time since diagnosis of type 1 diabetes, years | 20.5 (12.8) | 19.9 (12.0) | 16.2 (8.4) | 23.7 (14.5) |
| Time since diagnosis of type 1 diabetes | ||||
| ≤5 years | 0 | 1 (5.3) | 0 | 2 (11.1) |
| >5–10 years | 4 (21.1) | 3 (15.8) | 6 (31.6) | 2 (11.1) |
| >10 years | 15 (78.9) | 15 (78.9) | 13 (68.4) | 14 (77.8) |
| Body weight, kg | 79.8 (13.8) | 75.9 (14.2) | 87.1 (13.3) | 76.9 (14.5) |
| BMI, kg/m2 | 25.4 (3.7) | 24.7 (3.6) | 27.4 (3.5) | 25.4 (3.5) |
| HbA1c, % | 8.18 (0.67) | 8.35 (0.75) | 8.28 (0.79) | 8.15 (0.54) |
| HbA1c, mmol/mol | 66 (7.3) | 68 (8.2) | 67 (8.6) | 66 (5.9) |
| FPG, mmol/l | 9.2 (3.7) | 10.4 (3.6) | 9.8 (3.6) | 9.8 (2.8) |
| MDG, mmol/l | 9.8 (2.6) | 10.3 (2.1) | 9.3 (2.5) | 9.6 (2.0) |
| eGFR*, ml/min/1.73 m2 | 101.4 (14.5) | 106.1 (10.8) | 102.8 (15.7) | 99.0 (13.9) |
| UGE, g/24 h | 20.3 (17.4) | 21.4 (20.3) | 14.0 (15.9) | 13.4 (11.2) |
| SBP, mmHg | 124.4 (15.4) | 122.0 (13.1) | 121.8 (13.0) | 124.4 (13.4) |
| DBP, mmHg | 76.3 (9.4) | 74.5 (8.3) | 72.6 (8.1) | 72.2 (7.8) |
| Recorded daily basal insulin dose, U/kg | 0.33 (0.12) | 0.30 (0.07) | 0.36 (0.11) | 0.32 (0.13) |
| Recorded daily bolus insulin dose, U/kg | 0.33 (0.16) | 0.35 (0.16) | 0.35 (0.14) | 0.33 (0.14) |
| Recorded total daily insulin dose, U/kg | 0.66 (0.23) | 0.65 (0.17) | 0.71 (0.18) | 0.65 (0.23) |
Data are n (%) or mean (standard deviation) in the full analysis set (patients who received ≥1 dose of study medication and had a 24‐h UGE value at baseline and at day 1 and/or day 7). BMI, body mass index; DBP, diastolic blood pressure; eGFR, estimated glomerular filtration rate; FPG, fasting plasma glucose; HbA1c, glycated haemoglobin; MDG, mean daily glucose; SBP, systolic blood pressure; UGE, urinary glucose excretion.
Chronic Kidney Disease Epidemiology Collaboration formula.
Pharmacodynamics
Empagliflozin 2.5, 10 and 25 mg significantly increased 24‐h UGE compared with placebo on day 7 (Figure 1A). Increases in UGE were observed on day 1 and maintained up to day 28 (Figure 1B). On day 28, adjusted mean [standard error (s.e.)] change from baseline in UGE was 0.21 (8.0) g/24 h with placebo compared with 79.1 (8.1) g/24 h with empagliflozin 2.5 mg [adjusted mean difference vs placebo: 78.8 g/24 h, 95% confidence interval (CI) 56.2, 101.4 g/24 h; p<0.001], 114.9 (8.1) g/24 h with empagliflozin 10 mg (adjusted mean difference vs placebo: 114.7 g/24 h, 95% CI 91.9, 137.5 g/24 h; p < 0.001), and 109.4 (8.3) g/24 h with empagliflozin 25 mg (adjusted mean difference vs placebo: 109.2 g/24 h, 95% CI 86.0, 132.3 g/24 h; p < 0.001).
Figure 1.
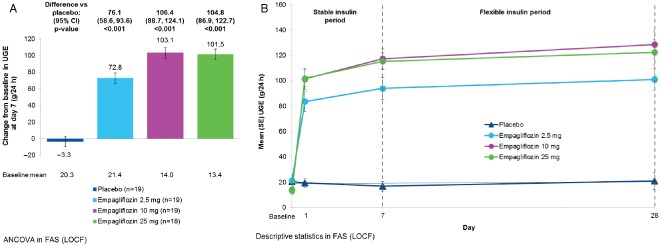
(A) Change from baseline in 24‐h urinary glucose excretion (UGE) at day 7 [analysis of covariance in full analysis set (FAS), last observation carried forward (LOCF) imputation]. Data are adjusted mean [standard error (s.e.)]. (B) UGE over 28 days [descriptive statistics in FAS (LOCF)]. Data are mean (s.e.) values. CI, confidence interval.
Efficacy
Empagliflozin 2.5, 10 and 25 mg significantly decreased HbA1c concentrations compared with placebo on day 28 (Figure 2A). Empagliflozin treatment led to dose‐dependent reductions from baseline in FPG and MDG, which generally did not reach significance compared with placebo (Figure 2B–E).
Figure 2.
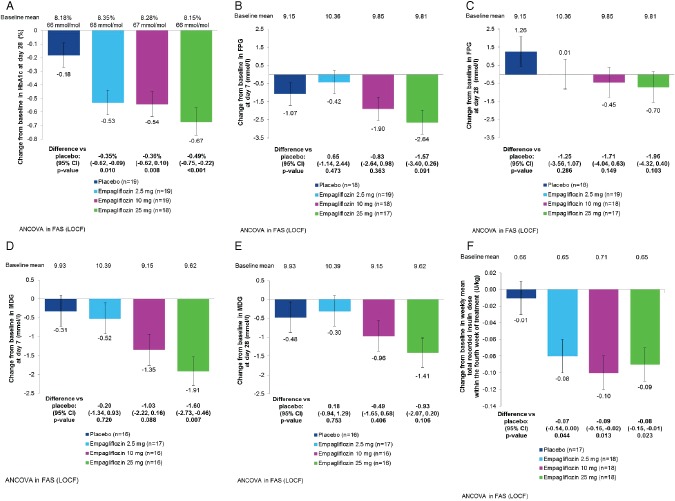
(A) Change from baseline in glycated haemoglobin (HbA1c) on day 28 [analysis of covariance (ancova) in full analysis set (FAS), last observation carried forward (LOCF) imputation]. (B) Change from baseline in fasting plasma glucose (FPG) on day 7 (ancova, FAS, LOCF). (C) Change from baseline in FPG on day 28 (ancova, FAS, LOCF). (D) Change from baseline in mean daily glucose (MDG) at day 7 (ancova, FAS, LOCF). (E) Change from baseline in MDG on day 28 (ancova, FAS, LOCF). (F) Change from baseline in weekly mean total recorded insulin dose within the fourth week of treatment (ancova, FAS, LOCF). Data are adjusted mean (standard error) values. CI, confidence interval.
Empagliflozin 2.5, 10 and 25 mg significantly decreased weekly mean total recorded insulin doses compared with placebo within the fourth week of treatment (Figure 2F). This reduction was driven by changes in bolus insulin (Figure S1). The weekly mean recorded total, basal and bolus insulin doses over the treatment period are shown in Figure S1. In all groups, carbohydrate intake was increased over the first week of treatment, but decreased during week 2 to near baseline levels without substantial changes thereafter (Figure S2).
Empagliflozin 2.5, 10 and 25 mg significantly decreased weight compared with placebo. On day 28, adjusted mean (s.e.) change from baseline in weight was 0.2 (0.3) kg with placebo compared with −1.4 (0.3) kg with empagliflozin 2.5 mg [adjusted mean difference vs placebo: −1.5 (95% CI −2.4, −0.7) kg; p < 0.001)], −1.6 (0.3) kg with empagliflozin 10 mg (adjusted mean difference vs placebo: −1.8 kg, 95% CI −2.7, −0.9 kg; p < 0.001), and −1.7 (0.3) kg with empagliflozin 25 mg (adjusted mean difference vs placebo: −1.9 kg, 95% CI −2.7, −1.0 kg; p < 0.001).
There were no significant differences in changes from baseline in SBP or DBP with empagliflozin compared with placebo. On day 28, adjusted mean (s.e.) change from baseline in SBP was 2.8 (2.1) mmHg with placebo compared with 2.7 (2.1) mmHg with empagliflozin 2.5 mg, 5.3 (2.1) mmHg with empagliflozin 10 mg and 1.2 (2.2) mmHg with empagliflozin 25 mg. On day 28, adjusted mean (s.e.) change from baseline in DBP was 2.7 (1.3) mmHg with placebo compared with 1.3 (1.3) mmHg with empagliflozin 2.5 mg, 3.9 (1.3) mmHg with empagliflozin 10 mg, and 2.2 (1.3) mmHg with empagliflozin 25 mg.
Safety
AEs were reported in 18 (94.7%), 17 (89.5%), 15 (78.9%) and 18 (100.0%) patients on placebo, empagliflozin 2.5 mg, empagliflozin 10 mg and empagliflozin 25 mg, respectively (Table 2). AEs regarded as drug‐related by the investigator were reported in 15 (78.9%), 14 (73.7%), 11 (57.9%) and 18 (100.0%) patients on placebo, empagliflozin 2.5 mg, empagliflozin 10 mg and empagliflozin 25 mg, respectively (Table 2); the vast majority of these AEs were hypoglycaemia. There were no discontinuations attributable to AEs. One patient in the placebo group experienced a serious AE (hypoglycaemia). There were no deaths, and no cases of diabetic ketoacidosis were reported. Severe AEs were reported in two patients, both in the placebo group (nasopharyngitis and hypoglycaemia). AEs (MedDRA preferred terms) reported in ≥2 patients in any treatment group were hypoglycaemia, nasopharyngitis, headache, back pain and arthralgia. An AE consistent with UTI was reported in one female patient (on empagliflozin 25 mg). This event did not require therapy and did not lead to premature discontinuation of study medication. No AEs consistent with genital infections were reported.
Table 2.
Summary of adverse events and rates of hypoglycaemic episodes per 30 days
| Placebo (n = 19) | Empagliflozin 2.5 mg (n = 19) | Empagliflozin 10 mg (n = 19) | Empagliflozin 25 mg (n = 18) | |
|---|---|---|---|---|
| Patients with AEs * , n(%) | ||||
| One or more AE(s) | 18 (94.7) | 17 (89.5) | 15 (78.9) | 18 (100.0) |
| One or more investigator‐reported drug‐related AE(s) | 15 (78.9) | 14 (73.7) | 11 (57.9) | 18 (100.0) |
| One or more AE(s) leading to discontinuation | 0 (0.0) | 0 (0.0) | 0 (0.0) | 0 (0.0) |
| One or more severe AE(s) | 2 (10.5) | 0 (0.0) | 0 (0.0) | 0 (0.0) |
| One or more serious AE(s) | 1 (5.3) | 0 (0.0) | 0 (0.0) | 0 (0.0) |
| Deaths | 0 (0.0) | — | — | — |
| AEs reported in ≥2 patients in any group (by preferred term) | ||||
| Hypoglycaemia | 17 (89.5) | 16 (84.2) | 13 (68.4) | 17 (94.4) |
| Headache | 3 (15.8) | 0 (0.0) | 2 (10.5) | 6 (33.3) |
| Nasopharyngitis | 5 (26.3) | 2 (10.5) | 0 (0.0) | 1 (5.6) |
| Back pain | 2 (10.5) | 1 (5.3) | 1 (5.3) | 0 (0.0) |
| Arthralgia | 0 (0.0) | 0 (0.0) | 2 (10.5) | 0 (0.0) |
| Events consistent with UTI† | 0 (0.0) | 0 (0.0) | 0 (0.0) | 1 (5.6) |
| Events consistent with genital infection‡ | 0 (0.0) | 0 (0.0) | 0 (0.0) | 0 (0.0) |
| Rates of hypoglycaemic episodes per 30 days § | ||||
| During week 1 (stable insulin period) | ||||
| Asymptomatic hypoglycaemia with plasma glucose ≤3.9 mmol/l | 7.4 | 9.0 | 10.8 | 10.5 |
| Symptomatic hypoglycaemia with plasma glucose ≥3.0 to ≤3.9 mmol/l and no need for assistance | 3.2 | 2.5 | 7.2 | 5.0 |
| Symptomatic hypoglycaemia with plasma glucose <3.0 mmol/l and no need for assistance | 0.9 | 0.9 | 1.1 | 1.2 |
| Hypoglycaemia requiring assistance | 0.2 | 0 | 0 | 0 |
| During weeks 2–4 (flexible insulin period) | ||||
| Asymptomatic hypoglycaemia with plasma glucose ≤3.9 mmol/l | 3.7 | 3.2 | 2.3 | 3.0 |
| Symptomatic hypoglycaemia with plasma glucose ≥3.0 to ≤3.9 mmol/l and no need for assistance | 2.9 | 2.4 | 1.7 | 2.9 |
| Symptomatic hypoglycaemia with plasma glucose <3.0 mmol/l and no need for assistance | 1.1 | 0.3 | 0.4 | 0.6 |
| Hypoglycaemia requiring assistance | 0 | 0 | 0 | 0 |
| Overall (weeks 1–4) | ||||
| Asymptomatic hypoglycaemia with plasma glucose ≤3.9 mmol/l | 4.6 | 4.6 | 4.4 | 4.8 |
| Symptomatic hypoglycaemia with plasma glucose ≥3.0 to ≤3.9 mmol/l and no need for assistance | 2.9 | 2.4 | 3.1 | 3.4 |
| Symptomatic hypoglycaemia with plasma glucose <3.0 mmol/l and no need for assistance | 1.0 | 0.4 | 0.5 | 0.8 |
| Hypoglycaemia requiring assistance | 0.1 | 0 | 0 | 0 |
Data are from the treated set (patients treated with ≥1 dose of study medication). AE, adverse event; UTI, urinary tract infection.
AEs reported between the first intake of study medication and up to 7 days after the last intake of study medication are shown.
Based on 73 Medical Dictionary for Drug Regulatory Activities (MedDRA) preferred terms.
Based on 89 MedDRA preferred terms.
Based on episodes reported between the first intake of study medication and up to 1 day after the last intake of study medication.
During week 1 (stable insulin period), the rates of symptomatic hypoglycaemia with plasma glucose ≥3.0 to ≤3.9 mmol/l were higher with empagliflozin 10 and 25 mg but lower with empagliflozin 2.5 mg than with placebo, and the rates of symptomatic hypoglycaemia with plasma glucose <3.0 mmol/l were similar across treatment groups (Table 2). No hypoglycaemic events requiring assistance occurred in empagliflozin groups during week 1 (Table 2). During weeks 2–4 (flexible insulin period), the rates of symptomatic hypoglycaemia with plasma glucose ≥3.0 to ≤3.9 mmol/l were similar between empagliflozin 2.5, 25 mg and placebo and appeared to be lower with empagliflozin 10 mg than with placebo, and the rates of symptomatic hypoglycaemia with plasma glucose <3.0 mmol/l were generally lower with empagliflozin than with placebo (Table 2). No hypoglycaemic events requiring assistance occurred in weeks 2–4 (Table 2). Over the whole study (including the flexible insulin period), the rates of symptomatic hypoglycaemia with plasma glucose ≥3.0 to ≤3.9 mmol/l were 2.9, 2.4, 3.1 and 3.4 episodes per 30 days with placebo, empagliflozin 2.5 mg, empagliflozin 10 mg and empagliflozin 25 mg, respectively, and the rates of symptomatic hypoglycaemia with plasma glucose <3.0 mmol/l were 1.0, 0.4, 0.5 and 0.8 episodes per 30 days with placebo, empagliflozin 2.5 mg, empagliflozin 10 mg and empagliflozin 25 mg, respectively (Table 2).
Small increases in haematocrit and β‐hydroxybutyrate and small decreases in uric acid and eGFR were observed with empagliflozin (Table S1). During routine safety laboratory monitoring, a fasting β‐hydroxybutyrate level of 5.4 mmol/l was observed in a patient on empagliflozin 2.5 mg and a level of 2.2 mmol/l was observed in a patient on empagliflozin 25 mg at week 4. At baseline, these patients had elevated pre‐treatment β‐hydroxybutyrate levels of 1.1 and 0.4 mmol/l, respectively, and at week 4, total daily insulin doses had been reduced by 51% and 31% in these patients, respectively. The high fasting β‐hydroxybutyrate levels at week 4 were not considered AEs by the investigator. There were small increases in LDL cholesterol in the empagliflozin 10 and 25 mg groups and a small increase in total cholesterol in the empagliflozin 10 mg group (Table S1). There were no relevant changes in electrolytes (Table S1).
Discussion
This is the first placebo‐controlled trial to investigate the pharmacodynamics, efficacy and safety of empagliflozin, administered as adjunct to a basal‐bolus insulin regimen, in patients with type 1 diabetes. This study comprised two treatment phases: a 1‐week stable insulin period, followed by a 3‐week flexible insulin period. The stable insulin period allowed direct assessment of the pharmacodynamics and efficacy of the three doses of empagliflozin against a stable insulin regimen. The flexible insulin period was more reflective of clinical practice, in which insulin dose should be adjusted to achieve optimum glycaemic control.
Empagliflozin significantly increased UGE in patients with type 1 diabetes after single drug administration and after 28 days of treatment, resulting in significant reductions in HbA1c compared with placebo. Dose‐dependent reductions in FPG and MDG were observed after 28 days, not reaching statistical significance compared with placebo, presumably because of the small sample size. The reductions in HbA1c, FPG and MDG with empagliflozin were achieved together with a significant reduction in daily insulin dose, mostly attributable to reductions in bolus insulin. While rates of moderate hypoglycaemic episodes (symptomatic hypoglycaemia with plasma glucose <3.0 mmol/l, not requiring assistance) were similar in the empagliflozin and placebo groups during the stable insulin period, they appeared to be reduced with empagliflozin compared with placebo during the flexible insulin period. Over the entire study, rates of moderate hypoglycaemic episodes were generally lower with empagliflozin than with placebo and no hypoglycaemic episodes requiring assistance were reported with empagliflozin. This is an important clinical finding, as hypoglycaemia is associated with significant morbidity and mortality in patients with type 1 diabetes, while fear of hypoglycaemia is a barrier to adherence to treatment (and so to achieving adequate glycaemic control) and has a negative impact on patients' quality of life 20, 21, 22.
Empagliflozin has consistently been shown to lead to sustained weight loss in patients with type 2 diabetes 13, 14, 15, 16, 17, 18, including those treated with a regimen of multiple daily injections of insulin, likely due to loss of calories in the urine. The majority of weight loss in patients with type 2 diabetes is attributable to a reduction in fat mass, including reductions in both trunk fat and limb fat and in both abdominal visceral and abdominal subcutaneous adipose tissue 23. Insulin treatment and intensification of insulin treatment often leads to weight gain in patients with type 1 diabetes, which can lead to delays in intensification of therapy and can affect patients' adherence to treatment 3. Moderate weight loss was observed with empagliflozin as adjunct to insulin in this study, despite the short treatment period.
Empagliflozin was well tolerated in patients with type 1 diabetes. No events consistent with genital infection were reported and there was only one AE consistent with UTI. Similar to findings seen in patients with T2DM, treatment with empagliflozin led to a small increase in haematocrit, which is believed to be attributable to osmotic diuretic effects, and a small increase in LDL cholesterol, possibly attributable to haemoconcentration. Small increases in mean fasting levels of the ketone body β‐hydroxybutyrate were observed with empagliflozin, probably reflecting glucose and calorie loss and a substrate shift from glucose to lipid utilization associated with the mode of action of empagliflozin 24. High fasting β‐hydroxybutyrate levels were observed in two patients on empagliflozin during routine safety laboratory monitoring at week 4, but these were not considered AEs by the investigator. Small changes in eGFR were observed with empagliflozin, likely as a result of haemodynamic changes attributable to effects on tubular‐feedback mechanisms 25.
A limitation of the present proof‐of‐concept study is its short duration and small sample size. Strengths include that it was a randomized double‐blind placebo‐controlled trial and included two treatment phases addressing distinct research questions. The results of this study are consistent with those of the 8‐week, single‐arm pilot study of empagliflozin in patients with type 1 diabetes 12 and those of a 2‐week placebo‐controlled study of the SGLT2 inhibitor dapagliflozin in patients with type 1 diabetes 26.
In conclusion, empagliflozin for 28 days as adjunct to insulin led to improvements in glycaemic control and reduced body weight accompanied by lower insulin doses compared with placebo in patients with type 1 diabetes. These data suggest that empagliflozin is an adjunct to insulin intervention that could prove to be efficacious in improving the management of type 1 diabetes in larger randomized controlled trials.
Conflict of Interest
T. R. P. has served in advisory boards or received speaker honoraria from Novo Nordisk, Eli Lilly, AstraZeneca, Roche Diagnostics and Bristol Meyer Squibb. S. F. has no conflicts of interest to disclose. J. E., J. C., N. S., O. E. J., H. J. W., U. C. B. and S. K. are employees of Boehringer Ingelheim.
T. P. and S. F. contributed to the acquisition and interpretation of data and writing of the manuscript. J. E., J. C., N. S., O. E. J., H. J. W., U. C. B. and S. K. contributed to the study design and interpretation of data and writing of the manuscript. T. R. P. is the guarantor of this work and, as such, had full access to all the data in the study and takes responsibility for the integrity of the data and the accuracy of the data analysis.
Supporting information
Figure S1. (A) Recorded total insulin dose over the treatment period. (B) Recorded basal insulin dose over the treatment period. (C) Recorded bolus insulin dose over the treatment period. Data are mean (standard error).
Figure S2. Total carbohydrate intake over the treatment period.
Table S1. Laboratory results.
File S1 . List of Investigators.
Acknowledgements
This study was funded by Boehringer Ingelheim and Eli Lilly and Company.
The authors acknowledge the contribution of Tim Heise, Profil Institut für Stoffwechselforschung GmbH, Neuss, Germany, to the acquisition and interpretation of data. Medical writing assistance, supported financially by Boehringer Ingelheim, was provided by Elizabeth Ng and Wendy Morris of Fleishman‐Hillard Group, Ltd during the preparation of this article. The authors were fully responsible for all content and editorial decisions, were involved at all stages of manuscript development and have approved the final version.
References
- 1. American Diabetes Association . Standards of medical care in diabetes – 2014. Diabetes Care 2014; 37(Suppl. 1): S14–80. [DOI] [PubMed] [Google Scholar]
- 2. McCrimmon RJ, Sherwin RS. Hypoglycemia in type 1 diabetes. Diabetes 2010; 59: 2333–2339. [DOI] [PMC free article] [PubMed] [Google Scholar]
- 3. Russell‐Jones D, Khan R. Insulin‐associated weight gain in diabetes–causes, effects and coping strategies. Diabetes Obes Metab 2007; 9: 799–812. [DOI] [PubMed] [Google Scholar]
- 4. Nathan DM, Cleary PA, Backlund JY et al. Intensive diabetes treatment and cardiovascular disease in patients with type 1 diabetes. N Engl J Med 2005; 353: 2643–2653. [DOI] [PMC free article] [PubMed] [Google Scholar]
- 5. Weinstock RS, Xing D, Maahs DM et al. Severe hypoglycemia and diabetic ketoacidosis in adults with type 1 diabetes: results from the T1D Exchange clinic registry. J Clin Endocrinol Metab 2013; 98: 3411–3419. [DOI] [PubMed] [Google Scholar]
- 6. Klein R, Knudtson MD, Lee KE, Gangnon R, Klein BE. The Wisconsin Epidemiologic Study of Diabetic Retinopathy: XXII the twenty‐five‐year progression of retinopathy in persons with type 1 diabetes. Ophthalmology 2008; 115: 1859–1868. [DOI] [PMC free article] [PubMed] [Google Scholar]
- 7. de Ferranti SD, de Boer IH, Fonseca V et al. Type 1 diabetes mellitus and cardiovascular disease: a scientific statement from the American Heart Association and American Diabetes Association. Diabetes Care 2014; 37: 2843–2863. [DOI] [PMC free article] [PubMed] [Google Scholar]
- 8. Nordwall M, Abrahamsson M, Dhir M et al. Impact of HbA1c, followed from onset of type 1 diabetes, on the development of severe retinopathy and nephropathy: the VISS Study (Vascular Diabetic Complications in Southeast Sweden). Diabetes Care 2015; 38: 308–315. [DOI] [PubMed] [Google Scholar]
- 9. Laing SP, Swerdlow AJ, Slater SD et al. Mortality from heart disease in a cohort of 23,000 patients with insulin‐treated diabetes. Diabetologia 2003; 46: 760–765. [DOI] [PubMed] [Google Scholar]
- 10. Grempler R, Thomas L, Eckhardt M et al. Empagliflozin, a novel selective sodium glucose cotransporter‐2 (SGLT‐2) inhibitor: characterisation and comparison with other SGLT‐2 inhibitors. Diabetes Obes Metab 2012; 14: 83–90. [DOI] [PubMed] [Google Scholar]
- 11. Heise T, Seewaldt‐Becker E, Macha S et al. Safety, tolerability, pharmacokinetics and pharmacodynamics following 4 weeks' treatment with empagliflozin once daily in patients with type 2 diabetes. Diabetes Obes Metab 2013; 15: 613–621. [DOI] [PubMed] [Google Scholar]
- 12. Perkins BA, Cherney DZ, Partridge H et al. Sodium‐glucose cotransporter 2 inhibition and glycemic control in type 1 diabetes: results of an 8‐week open‐label proof‐of‐concept trial. Diabetes Care 2014; 37: 1480–1483. [DOI] [PubMed] [Google Scholar]
- 13. Haering H‐U, Merker L, Seewaldt‐Becker E et al. Empagliflozin as add‐on to metformin in patients with type 2 diabetes: a 24‐week, randomized, double‐blind, placebo‐controlled trial. Diabetes Care 2014; 37: 1650–1659. [DOI] [PubMed] [Google Scholar]
- 14. Haering H‐U, Merker L, Seewaldt‐Becker E et al. Empagliflozin as add‐on to metformin plus sulfonylurea in patients with type 2 diabetes: a 24‐week randomized, double‐blind, placebo‐controlled trial. Diabetes Care 2013; 36: 3396–3404. [DOI] [PMC free article] [PubMed] [Google Scholar]
- 15. Kovacs CS, Seshiah V, Swallow R et al. Empagliflozin improves glycaemic and weight control as add‐on therapy to pioglitazone or pioglitazone plus metformin in patients with type 2 diabetes: a 24‐week, randomized, placebo‐controlled trial. Diabetes Obes Metab 2014; 16: 147–158. [DOI] [PubMed] [Google Scholar]
- 16. Roden M, Weng J, Eilbracht J et al. Empagliflozin monotherapy in drug‐naïve patients with type 2 diabetes: a randomised, 24‐week, double‐blind, placebo‐controlled, parallel group, trial with sitagliptin as active comparator. Lancet Diabetes Endocrinol 2013; 1: 208–219. [DOI] [PubMed] [Google Scholar]
- 17. Rosenstock J, Jelaska A, Frappin G et al. Improved glucose control with weight loss, lower insulin doses and no increased hypoglycemia with empagliflozin added‐on to titrated multiple daily injections of insulin in obese inadequately controlled patients with type 2 diabetes. Diabetes Care 2014; 37: 1815–1823. [DOI] [PubMed] [Google Scholar]
- 18. Rosenstock J, Jelaska A, Zeller C et al. Impact of empagliflozin added‐on to basal insulin in type 2 diabetes inadequately controlled on basal insulin: a 78‐week randomized, double‐blind, placebo‐controlled trial. Diabetes Obes Metab 2015; 17: 936–948. [DOI] [PMC free article] [PubMed] [Google Scholar]
- 19. Vallon V. The mechanisms and therapeutic potential of SGLT2 inhibitors in diabetes mellitus. Annu Rev Med 2015; 66: 255–270. [DOI] [PubMed] [Google Scholar]
- 20. Fidler C, Elmelund CT, Gillard S. Hypoglycemia: an overview of fear of hypoglycemia, quality‐of‐life, and impact on costs. J Med Econ 2011; 14: 646–655. [DOI] [PubMed] [Google Scholar]
- 21. Awoniyi O, Rehman R, Dagogo‐Jack S. Hypoglycemia in patients with type 1 diabetes: epidemiology, pathogenesis, and prevention. Curr Diab Rep 2013; 13: 669–678. [DOI] [PubMed] [Google Scholar]
- 22. Cryer PE. Hypoglycaemia: the limiting factor in the glycaemic management of Type I and Type II diabetes. Diabetologia 2002; 45: 937–948. [DOI] [PubMed] [Google Scholar]
- 23. Ridderstrale M, Andersen KR, Zeller C et al. Comparison of empagliflozin and glimepiride as add‐on to metformin in patients with type 2 diabetes: a 104‐week randomised, active‐controlled, double‐blind, phase 3 trial. Lancet Diabetes Endocrinol 2014; 2: 691–700. [DOI] [PubMed] [Google Scholar]
- 24. Ferrannini E, Muscelli E, Frascerra S et al. Metabolic response to sodium‐glucose cotransporter 2 inhibition in type 2 diabetic patients. J Clin Invest 2014; 124: 499–508. [DOI] [PMC free article] [PubMed] [Google Scholar]
- 25. Cherney DZ, Perkins BA, Soleymanlou N et al. Renal hemodynamic effect of sodium‐glucose cotransporter 2 inhibition in patients with type 1 diabetes mellitus. Circulation 2014; 129: 587–597. [DOI] [PubMed] [Google Scholar]
- 26. Henry RR, Rosenstock J, Edelman S et al. Exploring the potential of the SGLT2 inhibitor dapagliflozin in type 1 diabetes: a randomized, double‐blind, placebo‐controlled pilot study. Diabetes Care 2015; 38: 412–419. [DOI] [PubMed] [Google Scholar]
Associated Data
This section collects any data citations, data availability statements, or supplementary materials included in this article.
Supplementary Materials
Figure S1. (A) Recorded total insulin dose over the treatment period. (B) Recorded basal insulin dose over the treatment period. (C) Recorded bolus insulin dose over the treatment period. Data are mean (standard error).
Figure S2. Total carbohydrate intake over the treatment period.
Table S1. Laboratory results.
File S1 . List of Investigators.