Abstract
Air and light pollution contribute to fetal abnormalities, increase prevalence of cancer, metabolic and cardiorespiratory diseases, and central nervous system (CNS) disorders. A component of air pollution, particulate matter, and the phenomenon of dim light at night (dLAN) both result in neuroinflammation, which has been implicated in several CNS disorders. The combinatorial role of these pollutants on health outcomes has not been assessed. Male C3H/HeNHsd mice, with intact melatonin production, were used to model humans exposed to circadian disruption by dLAN and contaminated environmental air. We hypothesized exposure to 2.5μm of particulate matter (PM2.5) and dLAN (5 lux) combines to upregulate neuroinflammatory cytokine expression and alter hippocampal morphology compared to mice exposed to filtered air (FA) and housed under dark nights (LD). We also hypothesized that exposure to PM2.5 and dLAN provokes anxiety-like and depressive-like responses. For four weeks, four groups of mice were simultaneously exposed to ambient concentrated PM2.5 or FA and/or dLAN or LD. Following exposure, mice underwent several behavioral assays and hippocampi were collected for qPCR and morphological analyses. Our results are generally comparable to previous PM2.5 and dLAN reports conducted on mice and implicate PM2.5 and dLAN as potential factors contributing to depression and anxiety. Short-term exposure to PM2.5 and dLAN upregulated neuroinflammatory cytokines and altered CA1 hippocampal structural changes, as well as provoked depressive-like responses (anhedonia). However, combined, PM2.5 and dLAN exposure did not have additive effects, as hypothesized, suggesting a ceiling effect of neuroinflammation may exist in response to multiple pollutants.
Keywords: Light pollution, air pollution, mood, hippocampus, particulate matter
1. Introduction
Rapid urbanization has contributed to an unprecedented increase in population, their distribution and associated human activity. Besides change in diet, exercise which have been traditionally linked with adverse health effects, a frequently ignored but important contributor is the extraordinary increase in environmental pollution and a near constant exposure to light at night. Pre-clinical, clinical and epidemiological investigations have previously demonstrated that an important pervasive component, air pollution contributes to many adverse health outcomes. Indeed air pollution can alter fetal development1 and adversely affect cardiovascular and respiratory function. Air pollution (indoor and outdoor) contribute to a substantial burden of disease worldwide. Air pollution is a complex mixture of particles and gaseous constituents with the particulate matter <2.5μm component being strongly and consistently associated with adverse cardiometabolic and neural effects2. Recent data seem to suggest that central nervous system (CNS) pathways may be involved in the pathogenesis of cardiometabolic disorders3,4,5. These include the stereotypical activation of neuroinflammatory cytokine production by microglial cells, resident innate immune cells of the CNS that produce pro-inflammatory regulators in the brain (e.g. Interleukin-1β [IL1-β], tumor necrosis factor [TNF-α], prostaglandin E2, interferon-γ). Activated microglia are implicated in neurodegenerative diseases6 as well as neural developmental disorders such as, childhood autism7. While microglial cells microglia predominate as sources of pro-inflammatory response to a variety of insults including air pollution8, a host of other CNS cells, including astrocytes9 and oligodendrocytes10 may also be activated during air pollution exposure. While a number of behavioral effects have been attributed to air pollution including decreases in measures of spatial learning11, motor behavior12, and behavioral measures of emotion13 these results were often in the setting of intra-nasal exposures or with diesel exhaust which predominates with fine and ultrafine fractions and typically over very short durations. Work from our lab chronically exposed to PM2.5 levels typical of major urban environments impaired cognition and increased depressive-like behavior. These changes were associated with upregulation of pro-inflammatory gene expression (IL1-β, TNF-α and alterations in hippocampal morphology, potentially contributing to the cognitive deficits14.
In common with air pollution, exposure to light at night is associated with cardiometabolic disease 15,16. The suprachiasmatic nucleus (SCN) of the hypothalamus regulates responses to the light/dark cycles in mammals17. Light information is detected by specific non-image forming cells in the retina called intrinsically photosensitive retinal ganglion cells (ipRGCs). ipRGCs project to hypothalamic areas, such as the SCN18 as well as specific limbic regions, including the lateral habenula and amygdala19. The downstream connections from the SCN to the limbic regions suggest involvement in mood regulation. Multiple studies using a variety of species, Phodopus sungorus20, Arvicanthis niloticus21 and an inbred strain of mice (C3H/HeNHsd)22, demonstrated that exposure to varying light cycles and dim light at night cycles (dLAN) led to changes in hippocampal morphology, spatial learning and memory deficits, as well as increases in depressive-like behaviors, all suggesting light at night exposure leads to mood and cognitive problems in rodents.
Our goal was to investigate the simultaneous effects of PM2.5 and dLAN exposure on several different pro-inflammatory cytokines (TNF-α, IL-1β, IL-6), as well as hippocampal morphology in groups of C3H/HeNHsd mice. Groups of mice were exposed to specific levels of PM2.5 and/or dLAN for a four-week period, and then subsequently experienced a series of behavioral tests and molecular technique analysis. We hypothesized that exposure to PM2.5 and dLAN provoke anxiety-like and depressive like behaviors. We also hypothesized that co-exposure to PM2.5 and dLAN has synergistic effects on neuroinflammatory cytokine expression and altered hippocampal morphology compared to the mice exposed to filtered air (FA) and under a standard light-dark cycle (LD).
2. Methods
2.1 Animals
Forty male C3H/HeNHsd mice (~8 weeks of age) were obtained from Harlan Laboratories for use in this study. The mice were individually housed in propylene cages (dimensions: 27.8 × 7.5 × 13 cm) at an ambient temperature of 23 ±2°C and provided with Harlan Teklad 8640 food (Madison, WI) and filtered tap water ad libitum. All mice were maintained in a standard light-dark cycle (14:10 light [~150 lux]/dark [0 lux]; LD) for two weeks of acclimation upon arrival. The 14:10 light/dark cycle was chosen as opposed to a 12:12 light/dark cycle in order to avoid providing a seasonally ambiguous signal. These mice are an inbred strain, but they may still retain some responsiveness to photoperiod. Mice might interpret a 12:12 light/dark as either a long or short photoperiod; this could lead to higher variability in phenotype.
The C3H/HeNHsd inbred mouse model was used as it is a nocturnal species with intact melatonin production, which was previously characterized by our lab for proper analysis of light at night effects on the brain and behavior22.
2.2 Light Cycles
After two weeks of acclimation under the 14:10 light/dark cycle, mice were randomly assigned to either LD or dLAN (14:10 light [~150 lux]/dark [5 lux]). Five lux of light exposure was chosen for dLAN because it is of greater intensity than moonlight (<0.5 lux), but highly distinguishable from exposure during the light phase (150 lux). The dim light exposure was administered with a flexible strip of cool white light-emitting diodes (LEDs) placed in front of the cage rack on which the mouse cages were placed. The lighting intensity was measured inside of the home cage and was highly consistent between cages. The mice were exposed to these two different lighting conditions for four weeks.
2.3 Particulate matter exposure
During four weeks of either LD or dLAN exposure, the same groups of randomly assigned mice were either assigned to filtered air (FA) or ambient concentrated particulate matter (<2.5μm [PM2.5]) and exposed under respective light phase for six hours per day (starting at Zeitgeber Time 0400) for five days per week for a four-week total exposure period. The FA and PM2.5 exposure is conducted using the Versatile Aerosol Concentration Enrichment System (VACES) used by our group over many years23, 24, 25. The VACES delivered concentrated PM2.5 particles to the mice within the whole-body exposure chambers, to which concentrations are relevant to human exposure26. For the FA control group, an identical system was used, except that a HEPA filter at the inlet to the VACES was installed to remove ambient particles.
2.4 Behavior testing
2.4.1 Open field
In order to assess locomotor behavior and anxiety-like responses in a novel environment, mice were placed into a clear acrylic chamber (36 × 36 cm). The mice were allowed to acclimatize to the testing room for 20-30 min prior to commencement of the testing procedure. The testing chamber was cleansed with 70% ethanol between each test. The center of the open field was defined as the central 30 × 30 cm. Mice were placed in the open field for five minutes and video recorded. The recorded video was analyzed by a condition-blinded observer using Observer software for time spent in the periphery versus the center of the open field. Increases in time spent in the center of the open field are generally interpreted as a reduction in anxiety-like behavior27.
2.4.2 Elevated plus maze
Anxiety-like behavior was further measured by assessing time spent in the open arms versus time in the enclosed arms of the maze. Locomotor differences were also assessed by using total entries into arms. Mice were placed in the center of the elevated plus maze with two enclosed arms (50 × 10 × 40cm) and two open arms (50 × 10 cm). The entire maze itself is elevated 40cm off the ground. Once the mice were placed into the maze, they were allowed to freely explore and video recorded. The recoded video was scored on Observer software (Noldus Corporation, Leesburg, VA) by a conditioned blinded observer. The observer scored average time spent in open and closed arms, as well as central region of the maze.
2.4.3 Forced swim test
Following the elevated plus maze, depressive-like behaviors were assessed using a forced swim paradigm. Mice were placed into an opaque, cylindrical tank (24cm × 53cm) filled with room temperature (22 ± 2°C) water that was ~17cm in depth. Mice were recorded inside of the tanks for five minutes and then removed from the water, dried, and returned to a clean, bedded cage. A conditioned blinded scorer utilized Observer software (Noldus Corporation, Leesburg, VA) and measured floating duration, latency to first float, the number of floating bouts, fecal boli present as well as wall climbing and swimming duration.
2.4.4 Sucrose anhedonia
A final assessment of depressive-like responses, measuring the interest or lack thereof in rewarding stimuli (sugar-water), was conducted. Prior to the testing, the mice were habituated to the presence of modified water bottles by being administered water for five hours for three days. Following the acclimation period, mice had free choice of either drinking from the bottle containing 1% sucrose solution or the bottle containing plain drinking water for a period of five hours. In order to quantify sucrose preference, bottles were weighed before and after the five-hour sessions and sucrose consumption was normalized to water consumption.
2.5 Tissue and blood collection
After the final behavioral assessment was completed, mice were placed under isoflurane anesthesia and humanely euthanized via decapitation. The thoracic cavity of the mouse was dissected and a syringe and needle were used to collect blood from the heart. Brains were removed and divided at the hemisphere.
2.6 Gene expression
Half of the dissected brain was placed into RNA later for ~48 hours. Total RNA was extracted from brain tissue using a homogenizer (Ultra-Turrax T8, IKAWorks, Wilmington, NC) and an RNeasy Mini Kit (Qiagen, Austin, TX) according to manufacturer’s instructions. RNA was subsequently transcribed into cDNA with M-MLV Reverse Transcriptase enzyme (Invitrogen, Carlsbad, CA). Gene expression for TNF-α, IL1-β, and IL-6 was determined using inventoried primer and probe assays (Applied Biosystems, Foster City, CA) on an ABI 7500 FastReal Time PCR System using Taqman Universal PCR Master Mix. The two-step RT-PCR cycling conditions used were: 50°C for 2min, 95°C for ten minutes, followed by 40 cycles of 95°C for 15s, and 60°C for one minute. Relative gene expression of individual samples run in duplicate was calculated by comparison to a relative standard curve and standardized by comparison to 18S rRNA signal.
2.7 Golgi-Cox impregnation
One half of the brain was processed for Golgi-impregnation using the FD Rapid GolgiStain Kit (FD Neurotechnologies, Ellicott City, MD) according to manufacturer’s instructions and submerged in Golgi-Cox solution and stored for 14 days in the dark. Brains were then rapidly frozen and 100mm coronal sections were sliced on a cryostat and collected onto gelatin-coated glass slides. The stain was developed in NH4OH for 10 minutes and sections were counterstained with cresyl violet. Finally, slides were dehydrated through a series of graded ethanol washes, cleared with xylene, cover-slipped with Permount, and dried in the dark for at least one week.
Pyramidal cells in the CA1 region were traced using Neurolucida software on an Eclipse E800 microscope (Nikon, Tokyo, Japan) at 200× magnification (Neurolucida; MicroBrightField, Williston, VT). Six representative neurons were traced per area, from each animal. Neurons chosen for tracing met the following criteria: (1) they were completely impregnated with Golgi stain, (2) they were not obscured by other impregnated neurons or precipitant, and (3) all dendrites were visible within the plane of focus. The hemispheric location of the traced neurons was chosen randomly. Additionally, dendritic spines from neurons in the pyramidal cell layer of the CA1 region were traced. Four randomly chosen spines per neuron were counted on 20μm distal dendritic segments at 1000× magnification. Using the accompanying software (NeuroExplorer; MicroBrightField) dendritic length, cell body area, and spine density were calculated. All samples were number-coded, and the experimenter was blind to the treatments.
2.8 Statistical analyses
Comparisons for behavioral analyses, sucrose consumption and gene expression results were conducted using a one-way analysis of variance (ANOVA). Neuronal characteristics and spine densities were averaged per animal and then analyzed using a one-way ANOVA. Following a significant result on one-way ANOVA, multiple comparisons, or which groups differed from one another, were compared using Tukey’s HSD or Games Howell tests. The above statistical analyses were conducted with IBM SPSS Statistical Software (IBM Corp. Released 2013. IBM SPSS Statistics for Windows, Version 22.0. Armonk, NY: IBM Corp.). In all cases, mean differences between group means were considered statistically significant if p ≤ 0.05.
3. Results
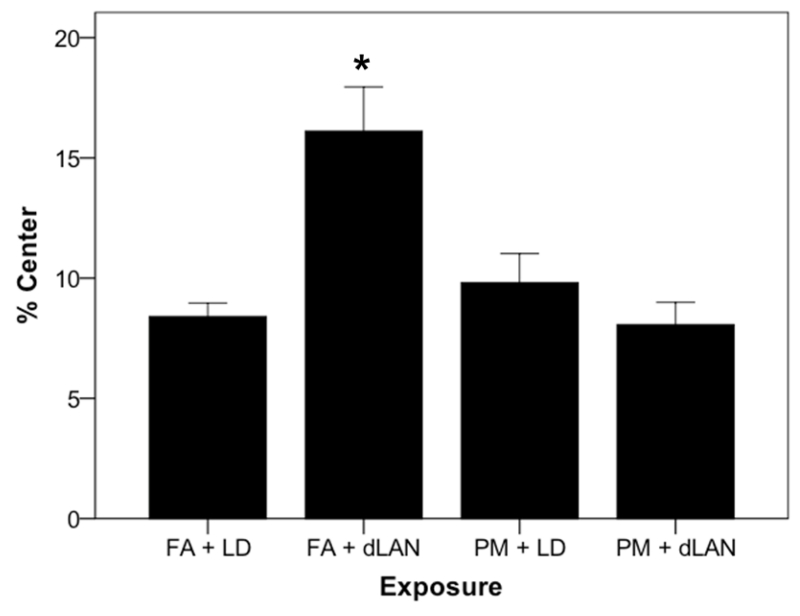
Mice in the FA + dLAN group, spent a greater percentage of exploratory time (F3, 35 = 9.52, p = 0.0001) in the center of the open field compared to all groups (Figure 3). However, mice in both PM2.5-exposed groups spent a reduced percentage of time in the open field compared to the FA + dLAN group.
Figure 3.
Percentage of exploratory time each exposure group spent (mean + SEM) in the center of the open field. p = 0.0001.
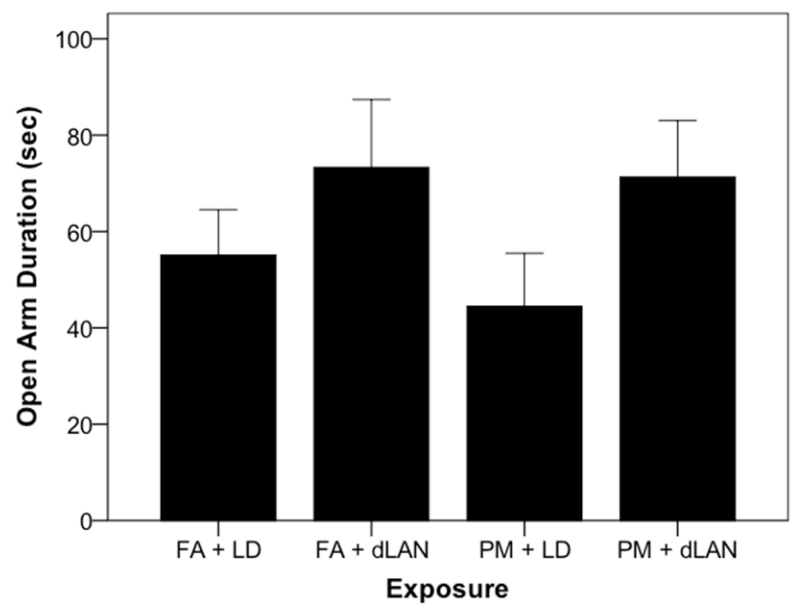
The elevated plus maze behavioral assay yielded no significant differences between groups in average time spent in open & closed arms, as well as central region of the maze (p > 0.05). One interesting note (Figure 4) is the mice in the PM + LD group had decreased entries into the open arm of the elevated plus maze (p > 0.05). This correlates with previous work14, where decreased open arm duration was observed in the particulate matter exposed group.
Figure 4.
Time spent (seconds) in the open arm of the elevated plus maze (mean + SEM). p = 0.26.
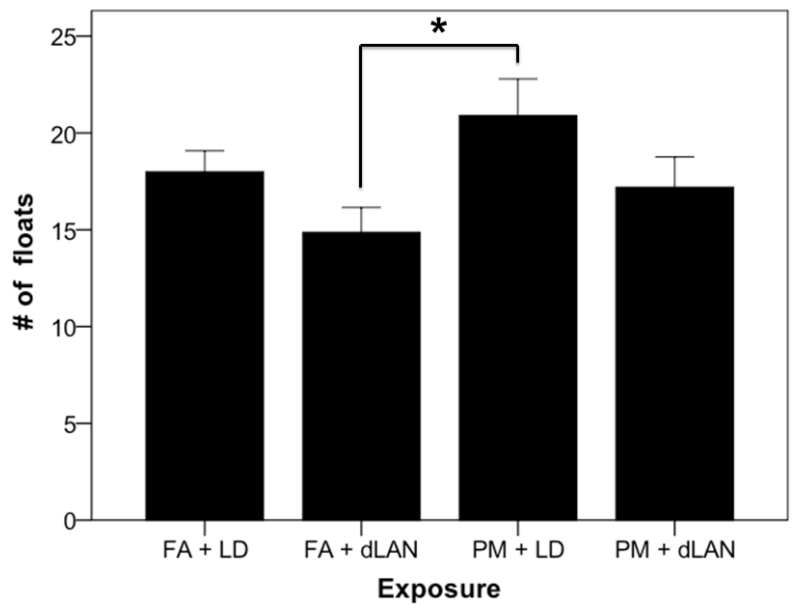
Depressive-like responses were also evaluated using a forced swim test, revealing high variability and no significant differences between groups in floating duration, latency to first float, number of fecal boli present as well as climbing and swimming duration measurements. However, the number of floating bouts (Figure 5) showed numerical differences (p > 0.05) similar to previous work regarding particulate matter14. Specifically, a Tukey post hoc test revealed a significantly greater difference in the number of floating bouts for the mice in the PM + LD group compared to the FA + dLAN mice was displayed (p < 0.05).
Figure 5.
Number of floating bouts during the forced swim test (mean + SEM), p > 0.05. Mice in the PM + LD group had a greater number of floating bouts compared to the FA + dLAN group, p < 0.05.
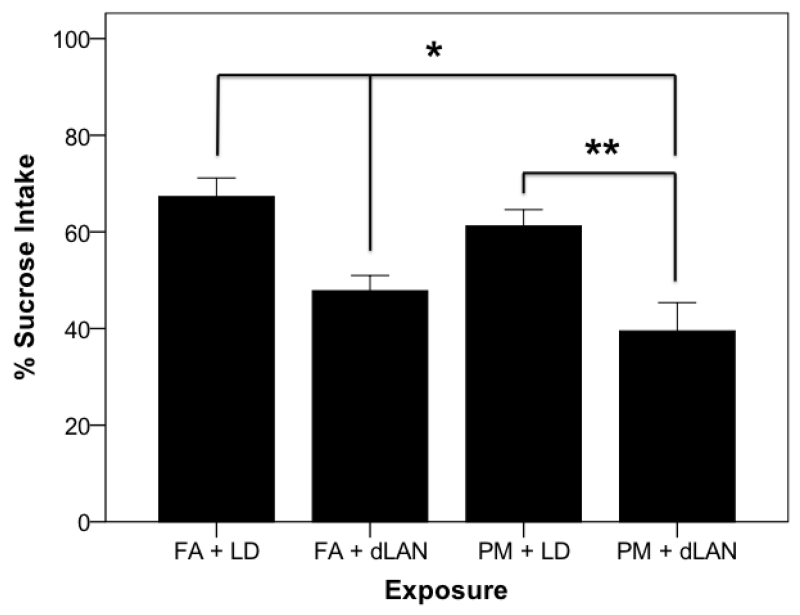
Sucrose preference testing was conducted in order to confirm behavioral changes occurred due to light and pollutant exposure. As predicted, There were statistically significant differences between groups as determined by one-way ANOVA (F3, 35 = 8.96, p = 0.0001). Tukey post hoc testing revealed PM2.5 + dLAN (39.52±4.19) exposed mice had lower sucrose intake compared to the PM2.5 + LD mice (61.21±4.19, p = 0.004) and FA + LD groups (61.29±4.19, p = 0.0001), as did the FA + dLAN (47.82±4.42) exposed animals compared to the FA + LD group (61.29±4.19, p = 0.015) (Figure 6).
Figure 6.
Sucrose intake was reduced between groups (mean + SEM), p = 0.0001. Mice in the PM + dLAN group had less sucrose consumption compared to PM + LD exposed animals, p < 0.01. Control animals, FA + LD, had greater sucrose consumption (p < 0.01) compared to FA + dLAN and PM + dLAN exposed animals.
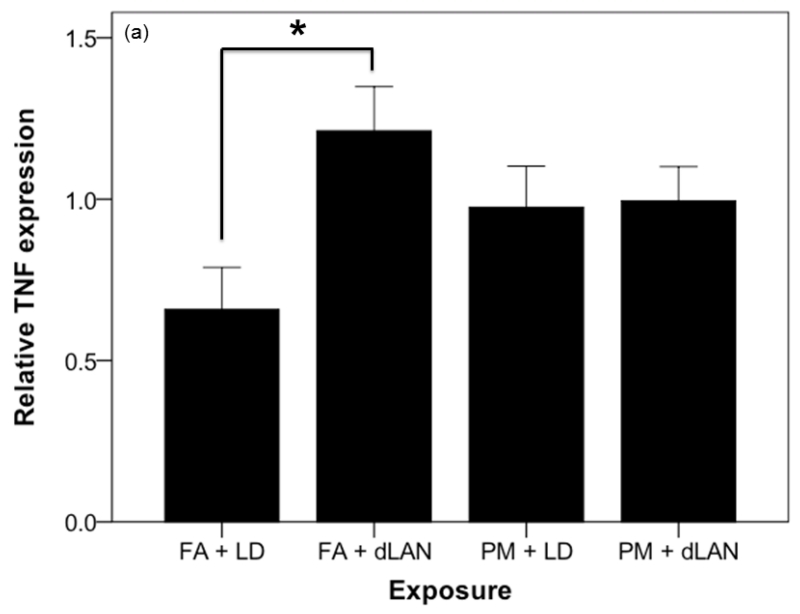
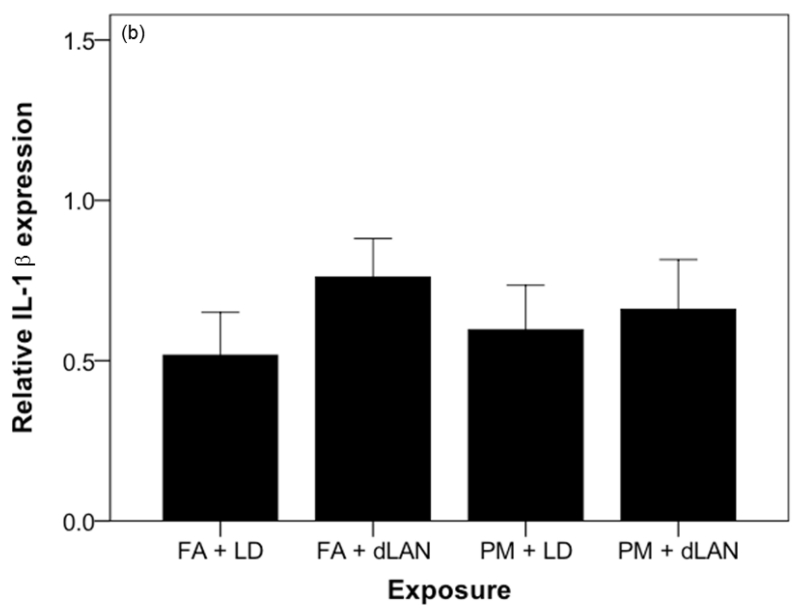
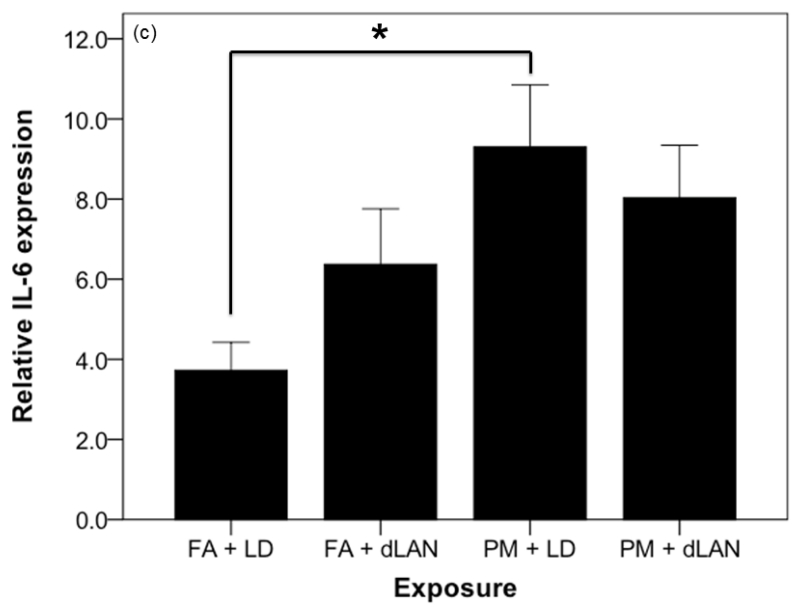
The mRNA for the proinflammatory cytokine TNF was elevated between exposure groups (F3,32 = 3.22, p = 0.035). Tukey post-hoc testing revealed that the mRNA for the proinflammatory cytokine TNF was higher in FA + dLAN (1.21 ± 0.41) exposed mice as compared with FA + LD (0.60 ±0.39, p = 0.021) exposed mice (Figure 7a). There was also a statistically significant difference between exposure groups with regards to relative gene expression of the inflammatory marker, IL6, as determined by one-way ANOVA (F3,35 = 3.70, p = 0.021). Tukey post-hoc testing revealed that the mRNA for the proinflammatory cytokine IL6 was higher in PM + LD (9.30 ± 4.89) exposed mice as compared with FA + LD (3.72 ± 2.22, p = 0.017) exposed mice (Figure 7c). Comparable elevation (p > 0.05) in IL1 cytokine expression was noted between all exposed groups and the control in these experiments, FA + LD group (Figure 7b).
Figure 7.
Effects of PM2.5 and/or dLAN on inflammatory cytokine expression in the hippocampus (mean + SEM). (a). Tumor necrosis factor (TNF) was elevated between exposure groups (p < 0.05). FA + dLAN exposed mice had higher TNF expression than control, FA + LD, mice (p = 0.05). (b). Interleukin-1 beta (IL-1β) had comparable differences between groups (p > 0.05). (c). Interleukin-6 (IL-6) was elevated between exposure groups (p = 0.05). PM + LD exposed mice had greater expression than control, FA + LD, mice (p = 0.05).
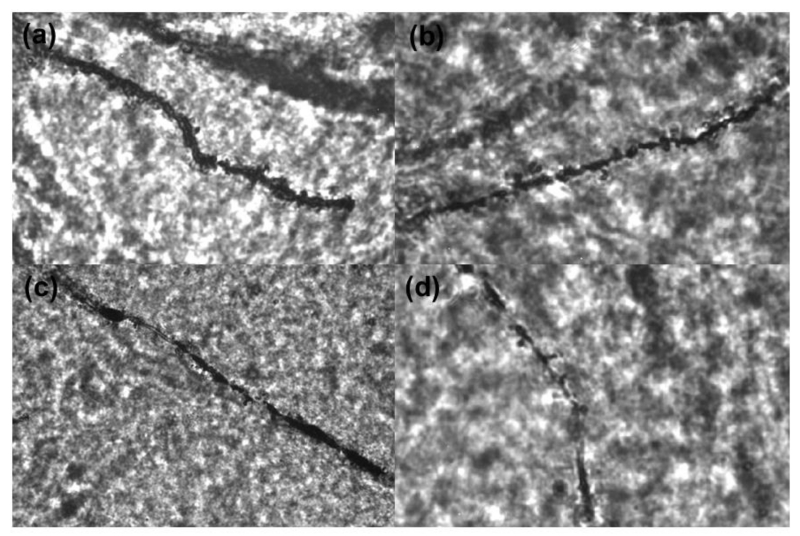
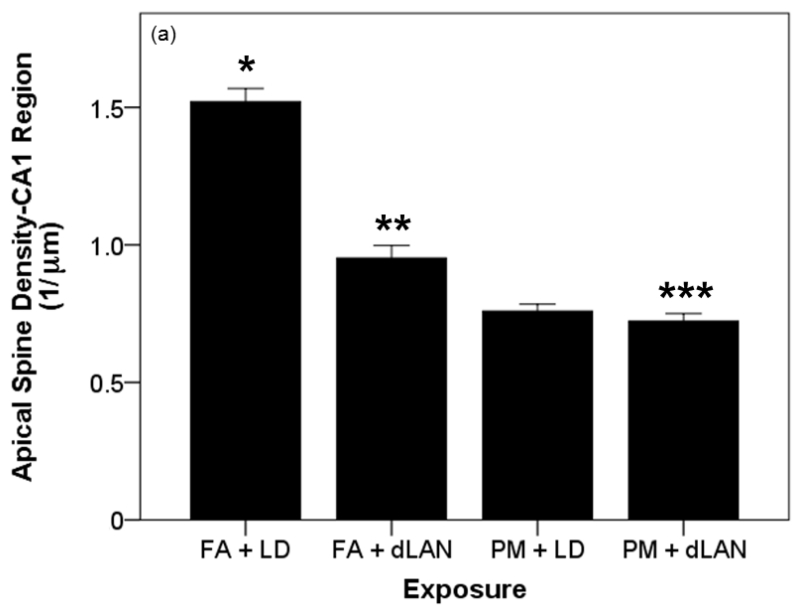
Overall, exposure to PM2.5 and/or dLAN altered apical spine density in the CA1 region of the hippocampus; such that, spine density significantly changed between exposure groups as determined by one-way ANOVA (F3,28 = 93.89, p = 0.0001) (Table 1) (Figures 1, 2). More specifically, a Tukey post-hoc test revealed apical tips of pyramidal dendrites in the CA1 region of the hippocampus in mice exposed to FA + LD (0.912 ± 0.081 μm) had significantly greater densities than those mice exposed to FA + dLAN (0.57 ± 0.08 μm, p = 0.0001), PM + LD (0.46 ± 0.04 μm, p = 0.0001), as well as PM + dLAN (0.43 ± 0.05 μm, p = 0.0001) (Figure 8a).
Table A.1.
Hippocampal neuronal characteristics in the CA1 region (mean ± SD).
| Characteristics | |||||
|---|---|---|---|---|---|
| Exposure | Apical Dendritic Length (μm) |
Basilar Dendritic Length (μm) |
Apical Spine Density (1/μm) |
Basilar Spine Density (1/μm) |
Cell Body Area (μm2) |
| FA + LD | 983.88 ± 310.64 |
880.02 ± 236.70 |
1.52 ± 0.136 |
1.47 ± 0.150 |
411.73 ± 89.81 |
| FA + dLAN | 613.31 ± 478.79 |
485.31 ± 383.32 |
0.952 ± 0.129 |
0.952 ± 0.091 |
183.76 ± 125.01 |
| PM + LD | 430.67 ± 249.20 |
953.97 ± 554.31 |
0.759 ± 0.072 |
0.887 ± 0.041 |
269.53 ± 121.07 |
| PM + dLAN |
296.25 ± 170.69 |
694.60 ± 378.93 |
0.723 ± 0.079 |
0.090 ± 0.149 |
222.06 ± 141.48 |
| p-value | 0.0001* | 0.117 | 0.0001* | 0.0001* | 0.004* |
Figure 1.
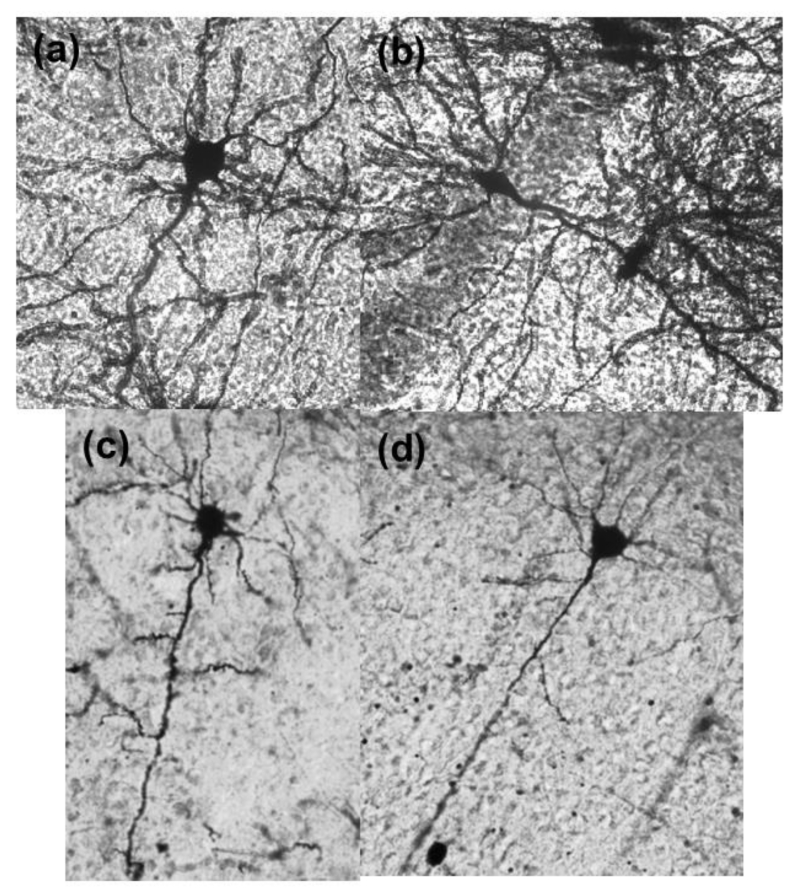
Representative CA1 neurons from each exposure group (20× objective): (a) FA + LD (b) FA + dLAN (c) PM + LD (d) PM + dLAN
Figure 2.
Representative dendrites of CA1 neurons from each exposure group (100× objective): (a) FA + LD (b) FA + dLAN (c) PM + LD (d) PM + dLAN
Figure 8.
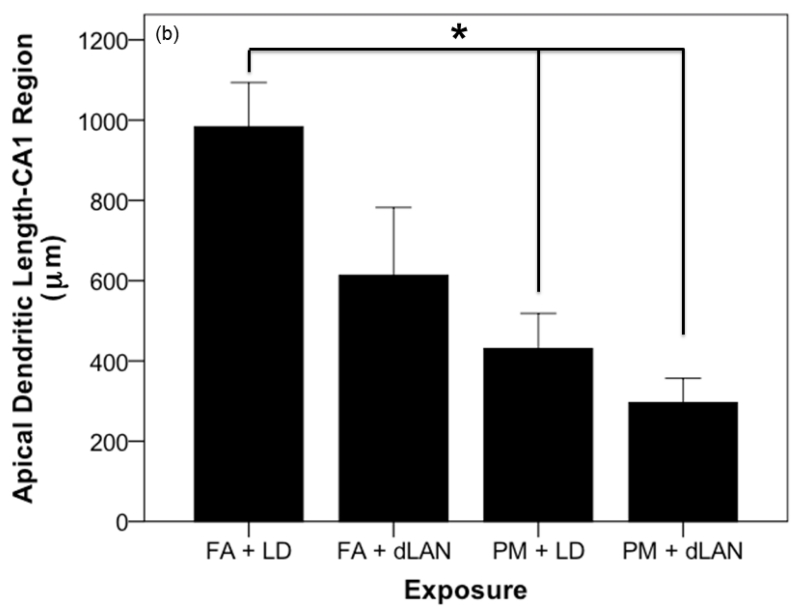
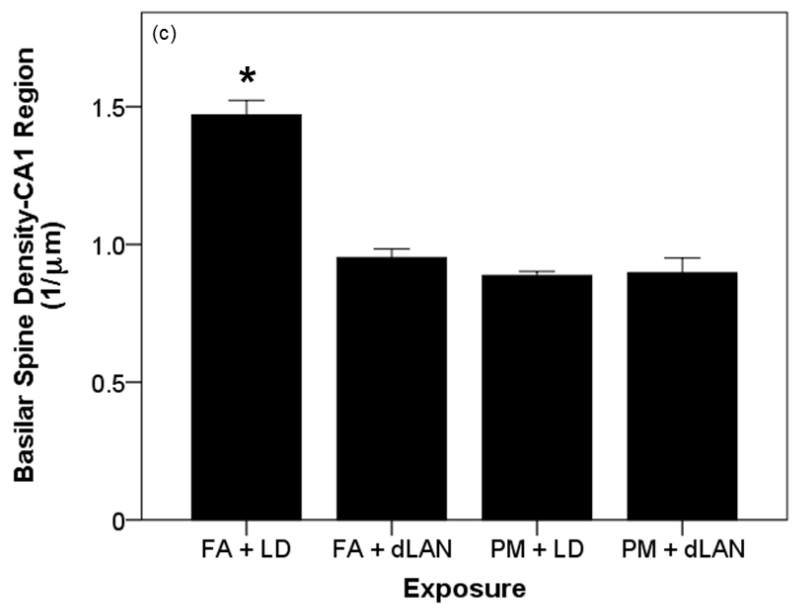
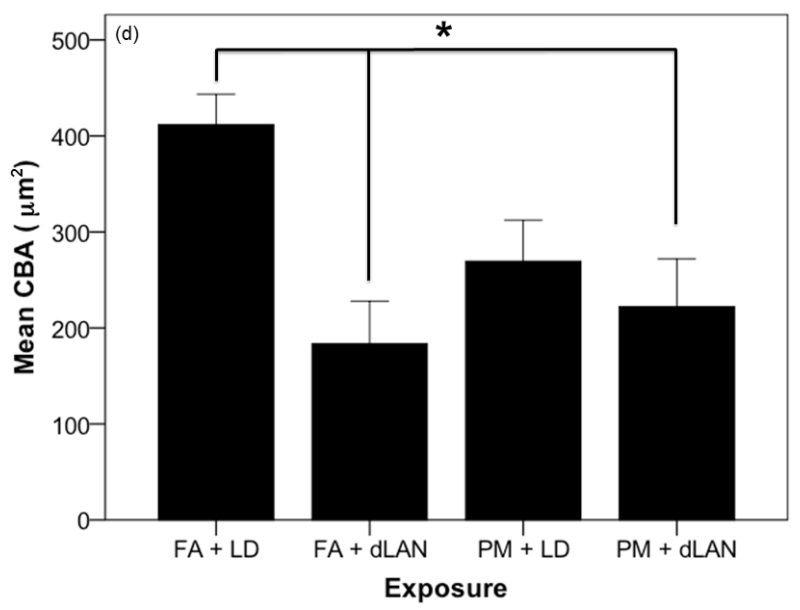
Effects of PM2.5 and/or dLAN exposure on hippocampal morphology of the CA1 region (mean + SEM). (a). Spine density of apical tips of pyramidal dendrites revealed differences between all exposed groups (p = 0.0001). FA + LD exposed mice had greater densities than the FA + dLAN (p = 0.0001), PM + LD (p = 0.0001), and PM + dLAN (p = 0.0001) exposed animals. (b). Significant differences were revealed between groups with regards to total apical dendritic length (p < 0.01). Control mice, FA + LD, had longer apical dendrites than PM + LD (p = 0.01) and PM + dLAN (p < 0.01) exposed groups. (c). All groups had significant differences with regards to basilar spinal densities (p < 0.001). Control, FA + LD, exposed mice had greater densities than FA + dLAN (p < 0.001), PM + LD (p = 0.0001), and PM + dLAN (p = 0.0001) exposed animals respectively. (d).Significant differences were revealed between groups regarding cell body area (p < 0.01). Control, FA + LD, exposed mice had a greater cell body area compared to FA + dLAN (p < 0.01) and PM + dLAN (p < 0.05) exposed animals.
Apical tips of pyramidal dendrites in the CA1 region of the hippocampus in mice exposed to FA + dLAN (0.57 ± 0.08μm) had significantly greater densities than those mice exposed to PM + LD (0.46 ± 0.04 μm, p = 0.006) and PM + dLAN (0.43 ± 0.05 μm, p =0.001), but had significantly smaller densities than those mice exposed to FA + LD (0.91 ± 0.08 μm, p = 0.0001). Furthermore, apical tips of pyramidal dendrites in the CA1 region of the hippocampus in mice exposed to PM + dLAN (0.43 ± 0.041μm) had significantly smaller densities than those mice exposed to FA + LD (0.91 ± 0.08 μm, p = 0.0001) and FA + dLAN (0.57 ± 0.07μm, p = 0.001) (Figure 8a).
Exposure to PM2.5 and/or dLAN resulted in a decreased to total apical dendritic length in the CA1 region as determined by one-way ANOVA (F3,28 = 6.83, p = 0.001). Tukey post-hoc testing revealed that those mice exposed to FA + LD (983.88 ± 310.64 μm) had significantly greater total apical dendritic length than those mice exposed to PM + LD (430.67 ± 249.20 μm, p = 0.01) and PM + dLAN (296.25 ± 170.69 μm, p = 0.001) (Figure 8b).
Basilar spine density in the CA1 region was also significantly different between exposure groups as determined by one-way ANOVA (F3,28 = 46.22, p = 0.0001). A Games-Howell post-hoc test revealed that those mice exposed to FA + LD (0.88 ± 0.09 μm) had significantly greater basilar spine densities than those mice exposed to FA + dLAN (0.57 ± 0.05 μm, p = 0.0001), PM + LD (0.53 ± 0.02 μm, p = 0.0001) as well as PM + dLAN (0.54 ± 0.09 μm, p = 0.0001) (Figure 8c).
Statistically significant differences were noted between all exposed groups with regards to cell body area as determined by one-way ANOVA (F2,27 = 4.47, p = 0.004). Tukey post-hoc testing revealed that those mice exposed to FA + LD (411.73 ± 89.81μm) had a significantly greater cell body area compared to those mice exposed to FA + dLAN (183.76 ± 125.01 μm, p = 0.004) as well as the PM +dLAN (222.06 ± 141.48 μm, p = 0.019) exposed group (Figure 8d).
There were no statistically significant differences between exposure groups with regards to basilar dendritic length in the CA1 region of the hippocampus as determined by one-way ANOVA (F(3,28) = 2.15, p = 0.117).
4. Discussion
In this study, we report that C3H/HeNHsd mice exposed to four-weeks of dLAN and PM2.5 resulted in depressive-like behaviors, upregulation of inflammatory cytokines, and morphological changes to the CA1 region of the hippocampus.
Depression and mood disorders are correlated with both circadian abnormalities22,28,29, as well as particulate matter exposure in both humans and rodents14,30,31. With regards to rodents displaying depressive-like behaviors in this study, the open field assay, an assessment of locomotor behavior and anxiety-like responses, revealed the FA + dLAN exposed group spent a greater percentage of exploratory time in the center of the open field compared to other groups. This did not agree with what was predicted, but is consistent with previous work from this laboratory32. Further tests of anxiety and depressive-like responses, the elevated plus maze and forced swim test, were employed, but yielded highly variable results. In a final measure of depressive-like responses, mice underwent a sucrose preference test. As predicted, PM + dLAN exposed mice had lower sucrose intake compared to PM + LD and the control group, FA + LD. FA + dLAN exposed mice also had less of a preference for sucrose-water compared to FA + LD exposed mice. These results correlate with previous literature14,21,28,33-35 and suggest exposure to PM2.5 and dLAN cause depressive-like behaviors in rodents and regulate mood.
The variability observed in some of the behavioral testing results were perhaps due to facility noise or odors, as testing were conducted in a satellite facility due to use of the VACES exposure chamber. Behavioral testing was conducted in an order deemed least to most demanding for the animals, so order effect would not play a role. However, the order chosen may have contributed to the variability36. It is also possible that different tests (e.g., Barnes maze, startle response, dark-light box) may be more appropriate choices in future experiments. Previous work from this laboratory14 reported upregulation in C57BL/6J mice exposed to PM2.5. Furthermore, the specific increases observed in TNF and IL-6, with regards to particulate matter exposure, have also been reported in other mouse model studies11,37,38 as well as in humans39,40. Effects of dLAN exposure on TNF and IL-6 were shown to be comparable previously by this laboratory22,41 suggesting that mice may not exhibit baseline differences in central inflammation with dLAN. However, similar work conducted on Siberian hamsters33 displayed TNF upregulation. Perhaps, with regards to results in this study, TNF and IL-6 upregulation were due to the PM2.5 exposure as opposed to dLAN. Further confirming the significant upregulation of TNF and IL-6 cytokine expression and similar numerical differences amongst the IL-1β results are the associative changes in neuronal morphology to the CA1 region of the hippocampus. Here we report reduced apical dendritic length, apical and basilar spine densities and cell body area in all groups compared to the control group, FA + LD (Table). Together, these results suggest mice exposed to dLAN and/or PM2.5 had changes to hippocampal structure in the CA1 region, which is suggestive of inflammation42 and potential cognitive changes43,44. These results also concur with previous studies conducted in this laboratory14,20. However, as with gene expression, there were significant differences between certain exposure groups, and not others, when one group was compared to each and every other group (Figure 8). Therefore, unlike what was predicted, there was not an additive effect of exposure displayed.
In conclusion, the findings in our study demonstrate that exposure to PM2.5 and/or dLAN can alter behavior, cause inflammatory, as well as neuronal morphological changes in mice. These results and previous work indicate PM2.5 and dLAN as contributing factors in depressive-like behaviors and associative mood and cognitive problems. The results reported here provide a starting point for future dual, PM2.5 and dLAN, pollutant studies, particularly involving chronicity of exposure. Perhaps, a long-term study would reveal additive results of both PM2.5 and dLAN exposure. Additionally, our results provide a foundation for further investigation into the specific mechanisms through which air and light pollution affect neuroinflammation as well as provide a correlation between these pollutants and depressive disorders in humans.
Acknowledgments
This work was supported by NIH grant RO1ES018900 (Q. Sun) and NIH grant R01ES015146 (S. Rajagopalan and RJ Nelson). We thank Drs. Laura Fonken and Taryn Aubrecht for providing insight, technical assistance and guidance in the laboratory. We also thank Taylor Kovalycsik for technical assistance.
References
- 1.Bolton JL, Smith SH, Huff NC, et al. Prenatal air pollution exposure induces neuroinflammation and predisposes offspring to weight gain in adulthood in a sex-specific manner. FASEB Journal. 2012;26(11):4743–4754. doi: 10.1096/fj.12-210989. [DOI] [PubMed] [Google Scholar]
- 2.Brook RD, Rajagopalan S, Pope CA, 3rd, Brook JR, Bhatnagar A, Diez-Roux AV, Holguin F, Hong Y, Luepker RV, Mittleman MA, Peters A, Siscovick D, Smith SC, Jr, Whitsel L, Kaufman JD. Particulate matter air pollution and cardiovascular disease: An update to the scientific statement from the American Heart Association. Circulation. 2010;121(21):2331–2378. doi: 10.1161/CIR.0b013e3181dbece1. [DOI] [PubMed] [Google Scholar]
- 3.Ying Z, Xu X, Bai Y, Zhong J, Chen M, Liang Y, Zhao J, Liu D, Morishita M, Sun Q, Spino C, Brook RD, Harkema JR, Rajagopalan S. Long-term exposure to concentrated ambient PM2.5 increases mouse blood pressure through abnormal activation of the sympathetic nervous system: a role for hypothalamic inflammation. Environmental Health Perspectives. 2014;122(1):78–86. doi: 10.1289/ehp.1307151. [DOI] [PMC free article] [PubMed] [Google Scholar]
- 4.Liu C, Fonken LK, Wang A, Maiseyeu A, Bai Y, Wang TY, Maurya S, Ko YA, Periasamy M, Dvonch T, Morishita M, Brook RD, Harkema J, Ying Z, Mukherjee B, Sun Q, Nelson RJ, Rajagopalan S. Central IKKß inhibition prevents air pollution mediated peripheral inflammation and exaggeration of type II diabetes. Particle and Fibre Toxicology. 2014;11(1):53. doi: 10.1186/s12989-014-0053-5. [DOI] [PMC free article] [PubMed] [Google Scholar]
- 5.Liu C, Bai Y, Xu X, Sun L, Wang A, Wang TY, Maurya SK, Periasamy M, Morishita M, Harkema J, Ying Z, Sun Q. Rajagopalan S. Exaggerated effects of particulate matter air pollution in genetic type II diabetes mellitus. Particle and Fibre Toxicology. 2014;11:27. doi: 10.1186/1743-8977-11-27. [DOI] [PMC free article] [PubMed] [Google Scholar]
- 6.McGeer PL, Itagaki S, Boyes BE, McGeer EG. Reactive microglia are positive for HLA-DR in the substantia nigra of parkinson’s and alzheimer’s disease brains. Neurology. 1988;38(8):1285–1291. doi: 10.1212/wnl.38.8.1285. [DOI] [PubMed] [Google Scholar]
- 7.Morgan JT, Chana G, Pardo CA, et al. Microglial activation and increased microglial density observed in the dorsolateral prefrontal cortex in autism. Biological Psychiatry. 2010;68(4):368–376. doi: 10.1016/j.biopsych.2010.05.024. [DOI] [PubMed] [Google Scholar]
- 8.Levesque S, Surace MJ, McDonald J, Block ML. Air pollution & the brain: Subchronic diesel exhaust exposure causes neuroinflammation and elevates early markers of neurodegenerative disease. Journal of Neuroinflammation. 2011;8:105. doi: 10.1186/1742-2094-8-105. [DOI] [PMC free article] [PubMed] [Google Scholar]
- 9.Elder A, Gelein R, Silva V, Feikert T, Opanashuk L, Carter J. Translocation of inhaled ultrafine manganese oxide particles to the central nervous system. Environmental Health Perspectives. 2006;114:1172–1180. doi: 10.1289/ehp.9030. [DOI] [PMC free article] [PubMed] [Google Scholar]
- 10.Hahn YK, Vo P, Fitting S, Block ML, Hauser KF, Knapp PE. Beta-chemokine production by neural and glial progenitor cells is enhanced by HIV-1 tat: Effects on microglial migration. Journal of Neurochemistry. 2010;114:97–109. doi: 10.1111/j.1471-4159.2010.06744.x. [DOI] [PMC free article] [PubMed] [Google Scholar]
- 11.Win-Shwe TT, Yamamoto S, Fujitani Y, Hirano S, Fujimaki H. Nanonparticle-rich diesel exhaust affects hippocampal-dependent spatial learning and NMDA receptor subunit expression in femal mice. Nanotoxicology. 2012;6(5):543–553. doi: 10.3109/17435390.2011.590904. [DOI] [PubMed] [Google Scholar]
- 12.Suzuki T, Oshio S, Iwata M, et al. In utero exposure to a low concentration of diesel exhaust affects spontaneous locomotor activity and monoaminergic system in male mice. Particle and Fibre Toxicology. 2010;7:7. doi: 10.1186/1743-8977-7-7. [DOI] [PMC free article] [PubMed] [Google Scholar]
- 13.Yokota S, Takashima H, Ohta R, et al. Nasal instillation of nanoparticle-rich diesel exhaust particles slightly affects emotional behavioral and learning capability in rats. The Journal of Toxicological Sciences. 2011;36(3):267–276. doi: 10.2131/jts.36.267. [DOI] [PubMed] [Google Scholar]
- 14.Fonken LK, Xu X, Weil ZM, et al. Air pollution impairs cognition, provokes depressive-like behaviors and alters hippocampal cytokine expression and morphology. Molecular Psychiatry. 2011;16(10):987–995. 973. doi: 10.1038/mp.2011.76. [DOI] [PMC free article] [PubMed] [Google Scholar]
- 15.Vyas MV, Garg AX, Iansavichus AV, et al. Shift work and vascular events: Systematic review and meta-analysis. British Medical Journal. 2012;345:e4800. doi: 10.1136/bmj.e4800. [DOI] [PMC free article] [PubMed] [Google Scholar]
- 16.Wyse CA, Selman C, Page MM, Coogan AN, Hazlerigg DG. Circadian desynchrony and metabolic dysfunction; did light pollution make us fat? Medical Hypotheses. 2011;77(6):1139–1144. doi: 10.1016/j.mehy.2011.09.023. [DOI] [PubMed] [Google Scholar]
- 17.Mohawk JA, Green CB, Takahashi JS. Central and peripheral circadian clocks in mammals. Annual Review of Neuroscience. 2012;35:445–462. doi: 10.1146/annurev-neuro-060909-153128. [DOI] [PMC free article] [PubMed] [Google Scholar]
- 18.Chen SK, Badea TC, Hattar S. Photoentrainment and pupillary light reflex are mediated by distinct populations of ipRGCs. Nature. 2011;476(7358):92–95. doi: 10.1038/nature10206. [DOI] [PMC free article] [PubMed] [Google Scholar]
- 19.Hattar S, Kumar M, Park A, et al. Central projections of melanopsin-expressing retinal ganglion cells in the mouse. Journal of Comparative Neurology. 2006;497(3):326–349. doi: 10.1002/cne.20970. [DOI] [PMC free article] [PubMed] [Google Scholar]
- 20.Bedrosian TA, Fonken LK, Walton JC, Haim A, Nelson RJ. Dim light at night provokes depression-like behaviors and reduces CA1 dendritic spine density in female hamsters. Psychoneuroendocrinology. 2011;36(7):1062–1069. doi: 10.1016/j.psyneuen.2011.01.004. [DOI] [PubMed] [Google Scholar]
- 21.Fonken LK, Kitsmiller E, Smale L, Nelson RJ. Dim nighttime light impairs cognition and provokes depressive-like responses in a diurnal rodent. Journal of Biological Rhythms. 2012;27(4):319–327. doi: 10.1177/0748730412448324. [DOI] [PubMed] [Google Scholar]
- 22.Fonken LK, Nelson RJ. Dim light at night increases depressive-like responses in male C3H/HeNHsd mice. Behavioural Brain Research. 2013;243:74–80. doi: 10.1016/j.bbr.2012.12.046. [DOI] [PubMed] [Google Scholar]
- 23.Sun Q, Wang A, Jin X, Natanzon A, Duquaine D, Brook RD, Aguinaldo JG, Fayad ZA, Fuster V, Lippmann M, Chen LC, Rajagopalan S. Long-term air pollution exposure and acceleration of atherosclerosis and vascular inflammation in an animal model. The Journal of the American Medical Association. 2005;294(23):3003–3010. doi: 10.1001/jama.294.23.3003. [DOI] [PubMed] [Google Scholar]
- 24.Xu X, Yavar Z, Verdin M, Ying Z, Mihai G, Kampfrath T, Wang A, Zhong M, Lippmann M, Chen LC, Rajagopalan S, Sun Q. Effect of early particulate air pollution exposure on obesity in mice: role of p47phox. Arteriosclerosis, Thrombosis, and Vascular Biology. 2010;30(12):2518–2527. doi: 10.1161/ATVBAHA.110.215350. [DOI] [PMC free article] [PubMed] [Google Scholar]
- 25.Ying Z, Xu X, Chen M, Liu D, Zhong M, Chen LC, Sun Q, Rajagopalan S. A synergistic vascular effect of airborne particulate matter and nickel in a mouse model. Toxicological Sciences. 2013;135(1):72–80. doi: 10.1093/toxsci/kft136. [DOI] [PMC free article] [PubMed] [Google Scholar]
- 26.Sioutas C, Koutrakis P, Burton RM. A technique to expose animals to concentrated fine ambient aerosols. Environmental Health Perspectives. 1995;103(2):172–177. doi: 10.1289/ehp.95103172. [DOI] [PMC free article] [PubMed] [Google Scholar]
- 27.Crawley JN. behavioral phenotyping of transgenic & knockout mice. 2nd A. John Wiley & Sons, Inc.; Hoboken, NJ: 2007. What’s wrong with my mouse? [Google Scholar]
- 28.Fonken LK, Nelson RJ. Illuminating the deleterious effects of light at night. F1000 Medicine Reports. 2011;3:18. doi: 10.3410/M3-18. [DOI] [PMC free article] [PubMed] [Google Scholar]
- 29.Emens J, Lewy A, Kinzie JM, Arntz D, Rough J. Circadian misalignment in major depressive disorder. Psychiatry Research. 2009;168(3):259–261. doi: 10.1016/j.psychres.2009.04.009. [DOI] [PubMed] [Google Scholar]
- 30.Kullowatz A, Rosenfield D, Dahme B, Magnussen H, Kanniess F, Ritz T. Stress effects on lung function in asthma are mediated by changes in airway inflammation. Psychosomatic Medicine. 2008;70:468–475. doi: 10.1097/PSY.0b013e31816f9c2f. [DOI] [PubMed] [Google Scholar]
- 31.de Miguel Díez J, Hernández Barrera V, Puente Maestu L, Carrasco Garrido P, Gómez García T, Jiménez García R. Psychiatric comorbidity in asthma patients. associated factors. Journal of Asthma. 2011;48:253–258. doi: 10.3109/02770903.2011.554943. [DOI] [PubMed] [Google Scholar]
- 32.Aubrecht TG, Weil ZM, Magalang UJ, Nelson RJ. Dim light at night interacts with intermittent hypoxia to alter cognitive and affective responses. American Journal of Physiology - Regulatory, Integrative and Comparative Physiology. 2013;305(1):R78–86. doi: 10.1152/ajpregu.00100.2013. [DOI] [PMC free article] [PubMed] [Google Scholar]
- 33.Bedrosian TA, Weil ZM, Nelson RJ. Chronic dim light at night provokes reversible depression-like phenotype: Possible role for TNF. Molecular Psychiatry. 2013;18(8):930–936. doi: 10.1038/mp.2012.96. [DOI] [PubMed] [Google Scholar]
- 34.Bandiera FC, Arheart KL, Caban-Martinez AJ, et al. Secondhand smoke exposure and depressive symptoms. Psychosomatic Medicine. 2010;72(3):331. doi: 10.1097/PSY.0b013e3181c6c8b5. [DOI] [PMC free article] [PubMed] [Google Scholar]
- 35.Bandiera FC, Caban-Martinez AJ, Arheart KL, et al. Secondhand smoke policy and the risk of depression. Annals of Behavioral Medicine. 2010;39(2):198–203. doi: 10.1007/s12160-010-9174-8. [DOI] [PMC free article] [PubMed] [Google Scholar]
- 36.McIlwain KL, Merriweather MY, Yuva-Paylor LA, Paylor R. The use of behavioral test batteries: Effects of training history. Physiology & Behavior. 2001;73:705–717. doi: 10.1016/s0031-9384(01)00528-5. [DOI] [PubMed] [Google Scholar]
- 37.Wilson DW, Aung HH, Lame MW, et al. Exposure of mice to concentrated ambient particulate matter results in platelet and systemic cytokine activation. Inhalation Toxicology. 2010;22(4):267–276. doi: 10.3109/08958370903278069. [DOI] [PubMed] [Google Scholar]
- 38.Campbell A, Oldham M, Becaria A, et al. Particulate matter in polluted air may increase biomarkers of inflammation in mouse brain. Neurotoxicology. 2005;26(1):133–140. doi: 10.1016/j.neuro.2004.08.003. [DOI] [PubMed] [Google Scholar]
- 39.Calderón-Garcidueñas L, Solt AC, Henríquez-Roldán C, et al. Long-termair pollutionexposure is associated with neuroinflammation, an alteredinnate immune response, disruption of the blood-brain barrier, ultrafineparticulatedeposition, and accumulation of amyloidbeta-42 and alpha-synuclein in children and young adults. Toxicologic Pathology. 2008;36(2):289–310. doi: 10.1177/0192623307313011. [DOI] [PubMed] [Google Scholar]
- 40.Calderón-Garcidueñas L, Reed W, Maronpot RR, et al. Brain inflammation and alzheimer’s-like pathology in individuals exposed to severe air pollution. Toxicologic Pathology. 2004;32(6):650–658. doi: 10.1080/01926230490520232. [DOI] [PubMed] [Google Scholar]
- 41.Fonken LK, Weil ZM, Nelson RJ. Dark nights reverse metabolic disruption caused by dim light at night. Obesity (Silver Spring) 2013;21(6):1159–1164. doi: 10.1002/oby.20108. [DOI] [PubMed] [Google Scholar]
- 42.Richwine AF, Parkin AO, Buchanan JB, et al. Architectural changes to CA1 pyramidal neurons in adult and aged mice after peripheral immune stimulation. Psychoneuroendocrinology. 2008;33(10):1369–1377. doi: 10.1016/j.psyneuen.2008.08.003. [DOI] [PubMed] [Google Scholar]
- 43.Richwine AF, Sparkman NL, Dilger RN, Buchanan JB, Johnson RW. Cognitive deficits in interleukin-10-deficient mice after peripheral injection of lipopolysaccharide. Brain, Behavior, and Immunity. 2009;23(6):794–802. doi: 10.1016/j.bbi.2009.02.020. [DOI] [PMC free article] [PubMed] [Google Scholar]
- 44.Chen J, Buchanan JB, Sparkman NL, Godbout JP, Freund GG, Johnson RW. Neuroinflammation and disruption in working memory in aged mice after acute stimulation of the peripheral innate immune system. Brain, Behavior, and Immunity. 2008;22(3):301–311. doi: 10.1016/j.bbi.2007.08.014. [DOI] [PMC free article] [PubMed] [Google Scholar]


