Abstract
In this study we developed a highly sensitive dual modal imaging system designed for gold nanoparticles (GNPs) conjugated to various fluorophores in solid phantoms. The system consists of fluorescence lifetime imaging microscopy (FLIM) for surface imaging, diffusion reflection (DR) for deep tissue imaging (up to 1cm), and metal enhanced fluorescence (MEF). We detected quenching in fluorescent intensity (FI) for the conjugation of gold nanospheres (GNS) as well as gold nanorods (GNRs) to Fluorescein, which has an excitation peak at a wavelength shorter than the surface plasmon resonance (SPR) of both types of GNPs, and enhanced FI in conjugation to Rhodamine B and Sulforhodamine B, both with excitation peaks in the GNPs' SPR. The enhanced FI was detected in solution as well as in solid phantoms from FLIM measurements. DR measurements detected GNR presence within the solid phantoms by recording dropped rates of light scattering using wavelengths corresponding to the GNRs' absorption. With the inclusion of MEF, this promising dual modal imaging technique enables efficient and sensitive molecular and functional imaging.
Keywords: Gold nanoparticles, biomolecular imaging, noninvasive detection, diffusion reflection, fluorescence lifetime imaging, metal enhanced fluorescence
1 Introduction
Gold nanoparticles (GNPs) are promising theranostic agents, relevant for fields in bio-medicine, engineering, and chemistry [1–3] due to their nontoxicity and biocompatibility [4, 5] in combination with useful optical properties, which include a large absorption cross-section [6] and tunable scattering characteristics [7]. Gold nanorods (GNRs) are especially interesting due to their extreme absorption and scattering properties in the visible and near infrared regions of the spectrum, which are enhanced by surface plasmon resonances (SPR) [8]. GNRs can be fabricated to absorb in the near infrared window between 700nm and 900nm, a range that allows relatively high photon penetration into biological tissues.
GNP-aided techniques have already been developed for X-ray, computed tomography (CT), surface-enhanced Raman scattering, and photoacoustic tomography, including in vivo and phantom experiments [9–12]. While X-ray and CT are useful for whole-body imaging with relatively high resolution, they provide risk associated with ionizing radiation. Photoacoustic tomography can use safer wavelengths, but still requires high power laser intensities (∼15mJ/cm2), which can lead to thermal damage in surrounding tissues.
Multi-modal imaging is a way to obtain a more comprehensive picture of a tissue than can be obtained from a single method. Our labs have previously reported a novel, inexpensive, and simple multi-modal imaging technique that can be used in vivo and provides deep volume imaging using diffusion reflection (DR) of tissues that contain GNPs as contrast agents, and surface imaging through fluorescence lifetime imaging microscopy (FLIM) [13].
DR spectroscopy is an optical diagnostic method that is simple, safe, and inexpensive. It is capable of revealing morphological information about tissues using low radiation intensities with low penetration depths [14–16]. In DR, the reflected light intensity profile of a tissue (I) is measured across a pre-specified range of light source-detector distances (ρ) [16, 17]. As discussed previously [18], the reflected intensity as a function of source-detector separation, I(ρ), in phantoms fits the following profile:
| (1) |
where c1 is a constant that depends on the medium and source/detector aperture sizes, and μ is the effective attenuation coefficient, which is a combined measure of absorbance and scattering. Equation (1) can be rewritten into a more comfortable form:
| (2) |
where c2 is ln(c1). From Eq. (2), it is possible to see that by measuring the expression ln(ρ2 I(ρ)) over several source-detector separation distances, it is a simple matter to obtain spectral information on the composition of the sample since the spectral properties are contained in μ - the slope of this function [17, 18]. GNPs as optical contrast agents can add specificity and sensitivity to the imaging method due to their tunable absorption and scattering properties. In previous publications, our lab proved DR's high sensitivity for tumor [18–20] and atherosclerosis [21] detection.
FLIM is an advanced spectroscopic tool, and can also provide useful information for biological and biomedical applications [22, 23]. Traditional fluorescence imaging techniques are based on the fluorescence intensity (FI), measuring the total fluorescence signal of a sample, and are mostly qualitative with limited quantitative comparison abilities for cellular function studies on the molecular level. While a stronger FI may indicate stronger activity in a specimen, it may also simply reflect a greater concentration of fluorescent molecules. However, FLIM uses the fluorescence lifetime (FLT), which is a known quantity for any fluorescent substance independent of molecule concentration. With FLIM it is possible to achieve spatial and temporal resolutions that allow for intuitive quantitative analysis [22, 23]. Image contrast for FLIM is based on FLT at each pixel rather than total intensity or fluorophore concentration, thus revealing information on processes and intracellular structures that affect the FLT. When fluorophores are within 40nm of GNPs, their FLT can change due to the through-space interaction of the fluorophore and the GNP [24–27], making GNP-fluorophore constructs useful FLIM targets.
Many studies have explored the capabilities of smart probes, which could be activated to produce a signal only upon contact with a target of interest. A large number of researchers sought the detection of enzymatic activity [28–32], and many also developed efficient probes with the help of GNPs [33–35]. Among the GNP-based probes making use of fluorescence, the majority were based on the concept of quenching, where proximity to the GNP causes a reduction in the FI, and subsequent interaction with the target (cleavage of the connection by a restriction enzyme, for example) would then return normal fluorescent behavior [29, 36–38]. However, these techniques can be improved with the help of the fluorescence enhancing capabilities of metals, and in particular GNPs. Due to surface electrons' collective oscillations, or plasmons, sub-wavelength sized metals are able to enhance their local electric field. The local field can interact with nearby fluorophores, increasing both their excitation rates and their radiative decay rates, and so produce a higher quantum yield and improved photostability with less photobleaching as compared to fluorophores alone. When the excitation light used matches both GNP and fluorophore absorption, it is possible to observe metal enhanced fluorescence (MEF) [24]. A fluorophore alone displays a FLT described by the following equation:
| (3) |
where τ is the FLT, Γ is the radiative decay rate, and Knr is the non-radiative decay rate. The quantum yield (Q) of such a molecule is given by:
| (4) |
Upon coupling to a metal particle, Eq. (3) for the FLT changes to:
| (5) |
and the quantum yield, as in Eq. (4), becomes:
| (6) |
where Γm and Km are new radiative and non-radiative decay rates that exist in the presence of the metal [24]. The implications of this ability are substantial, and indeed several studies have incorporated the MEF concept into their smart probe designs [39–43]. Two important factors should be noted: 1) the amount of MEF depends on the initial quantum yield of the fluorophore, as a quantum yield cannot be greater than 1 as can be seen in Eq. (4) and Eq. (6), and 2) the nearer the fluorophore is to the particle the greater the possible enhancement, but this enhancement coincides with other nearby effects of which resonance energy transfer is most notable and leads to overall significant quenching close to the particle surface [22]. By choosing a particle of the correct size, fluorophore of the correct absorption peak, and linker of correct length, we can create efficient imaging probes within tissues.
In this paper we introduce dual-modal probes containing a metal-to-dye spacer a few nanometers long designed to reduce near-distance quenching and allow MEF. We performed DR and FLIM measurements with various GNPs geometries, gold nanospheres (GNSs) and GNRs of two aspect ratios, each conjugated to 1 of either Fluorescein (Flu) (absorption maximum around 470nm, Q=0.9), Rhodamine B (RhB) (absorption maximum around 554nm, Q=0.3) or Sulforhodamine B (SRD) (absorption maximum around 564nm, Q=0.8), the latter 2 of which exhibit excitation peaks in the GNP SPR, and so are better suited both for in vivo imaging as well as for MEF. We measured the probes' fluorescent lifetime in solution as well as in solid phantoms to simulate biological tissue. While our dual-modal method previously proved highly sensitive in phantoms, it was based on quenching and sought areas of reduced fluorescence for targets. In this paper, we demonstrate a highly sensitive dual-modal imaging system that uses enhanced – rather than quenched – FI in combination with FLT, and DR.
2 Results and Discussion
2.1 Gold Nanoparticle fabrication
For the purposes of this work, we fabricated and measured 3 types of GNPs: GNSs and GNRs with 2 aspect ratios. The GNSs were of 20nm diameter, and the GNR sizes were 12nm×30nm (GNR690) and 12nm×40nm (GNR760). Each particle type was bound to Flu, RhB, and SRD separately. Separation distance between the fluorophores and GNPs was controlled using a polyethylene glycol (PEG) linker of molecular weight 1kDa, which can be estimated to be 10nm long. Figure 1 depicts the preparation and conjugation of the particles schematically. Figure 2(a) displays the normalized absorption spectra of each GNP alone, as well as each fluorophore alone, and Fig. 2(b)-(d) show the transmission electron microscope (TEM) images corresponding to the GNSs and both GNRs produced in these processes. From the spectra, it is notable that the absorption of RhB and SRD are very close to, but at a longer wavelength than, the absorption peak corresponding to the SPR associated with the short side of the GNRs, while the absorption of Flu is at a shorter wavelength. The Methods section (3.1) describes the fabrication process in detail.
Figure 1.
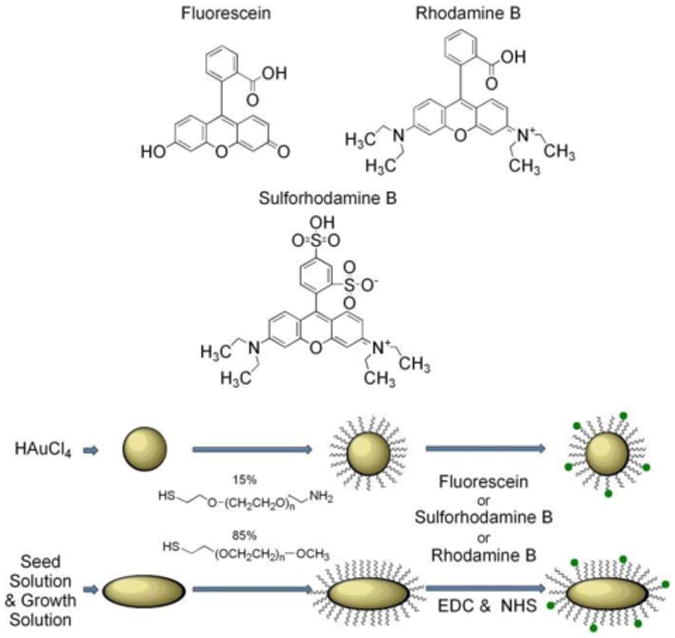
Schematic representation of gold nanospheres (GNSs) and gold nanorods (GNRs) preparation and subsequent conjugation to fluorophores.
Figure 2.
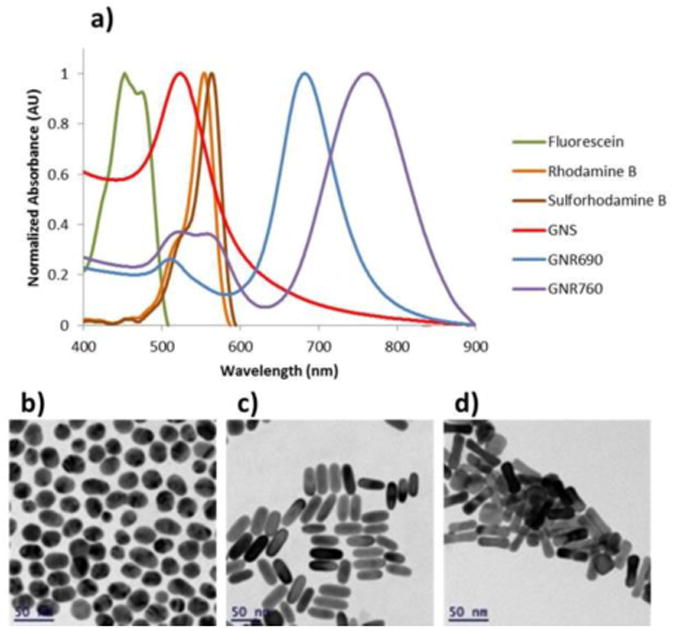
Particle characteristics. (a) Normalized absorption spectra of GNS, GNR690, and GNR760 alongside that of Fluorescein, Rhodamine B, and Sulforhodamine B, and transmission electron microscope (TEM) images of synthesized (b) GNS, (c) GNR690, and (d) GNR760.
2.2 Fluorescence measurement of solutions
FLIM was used to image the GNP-fluorophore constructs as described in the Methods section (3.3). Figure 3 presents FI measurements taken from solutions of each GNP-fluorophore construct after being diluted to a total fluorophore concentration of 1μM in each solution. As references, the FI measurements of each unbound dye are presented at the same concentration.
Figure 3.
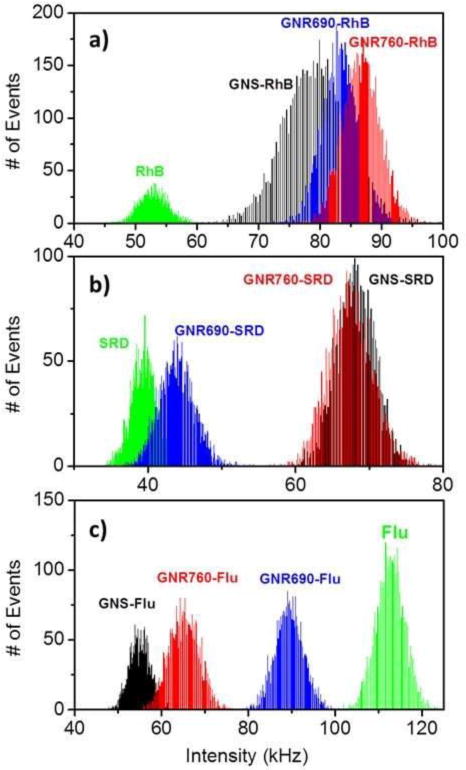
Fluorescence Intensity (FI) enhancement and quenching due to GNP conjugation in solution. FI is depicted in photon counts/msec, or kHz. (a) Count rate histograms of GNS, GNR690 and GNR760 conjugated to Rhodamine B (RhB). FI of RhB solution without GNPs is also included in the panel for comparison. (b) Count rate histograms of GNS, GNR690 and GNR760 conjugated to Sulforhodamine B (SRD). FI of SRD is included in the panel for comparison. (c) Count rate histograms of GNS, GNR690 and GNR760 conjugated to Fluorescein (Flu). FI of Flu is included in the panel for comparison. All solutions contained a fluorophore concentration of 1μM. All measurements for a given fluorophore were obtained under the same conditions, same set-up, and same excitation power.
It is possible to see from Fig. 3 the effects of GNPs conjugation to each fluorophore. For both RhB and SRD – the 2 dyes with absorption peak in the SPR – it is possible to see that GNPs conjugation, regardless of the geometries selected here, allowed for an increased FI compared to the fluorophores alone. Thus, the image displays the concept of MEF with an enhanced fluorescence signal following GNPs conjugation. Meanwhile, the peak for Flu lies below the plasmon resonance, and we observe a reduction in the FI, or quenching, for all 3 geometries.
2.3 FLIM measurement of solid phantoms
To image fluorescent construct localization in samples, phantoms containing the conjugated GNP-fluorophores were also imaged with scanning confocal FLIM. Figure 4 displays FLT curves detected from solid phantoms containing RhB alone (a), and GNPs-RhB constructs (b)-(d), as well as representative FLT histograms of (e) GNR690-RhB and (f) GNR780-RhB. Figure 5 presents FLIM images of solid phantoms containing RhB alone (a) and (c), as well as GNP-RhB constructs (b), and (d)-(f). In Fig. 5, the FLIM images are shown as FI only (a) and (b), and as a combination of FI, shown as brightness, and FLT, shown as color (c)-(f). The consistent green color indicates a similar FLT measured for all 4 phantoms. As seen by the increased apparent brightness, it is evident from these images that the conjugation of RhB to the 3 GNPs greatly increases the detectable FI in a phantom environment. With the help of MEF, it is possible to image a sample and detect the GNP-fluorophore conjugation by finding the bright areas. Figure 6 shows the FLIM images for SRD and Flu conjugated to each of the 3 GNPs types. Again, as in Fig. 5, the images are shown as a combination of FI (shown as brightness) and FLT (shown as color). Figure 6 shows that it is possible to image regions containing the constructs very well since their localization in the phantoms results in bright spots for FLIM imaging.
Figure 4.
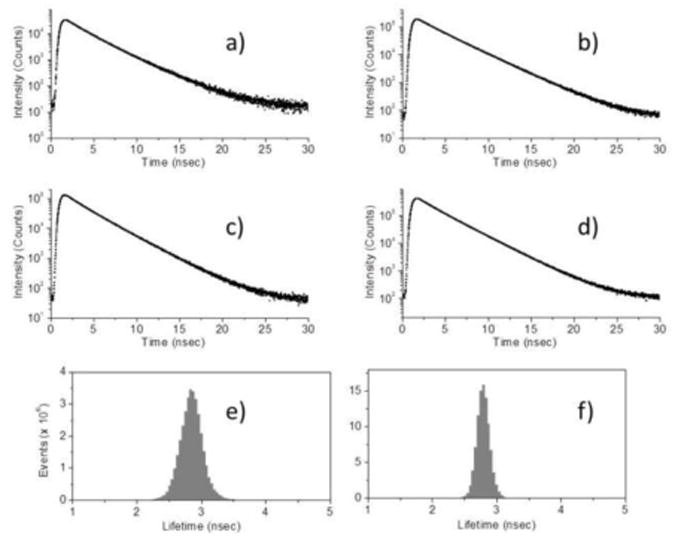
Representative fluorescent lifetime (FLT) curves obtained from FLT imaging microscopy (FLIM) for phantoms with RhB base containing (a) RhB only, (b) GNS-RhB, (c) GNR690-RhB, and (d) GNR780-RhB. Representative FLT histograms for the same phantoms containing (e) GNR690-RhB and (f) GNR780-RhB. All curves were obtained under the same conditions, same set-up, and same excitation power.
Figure 5.
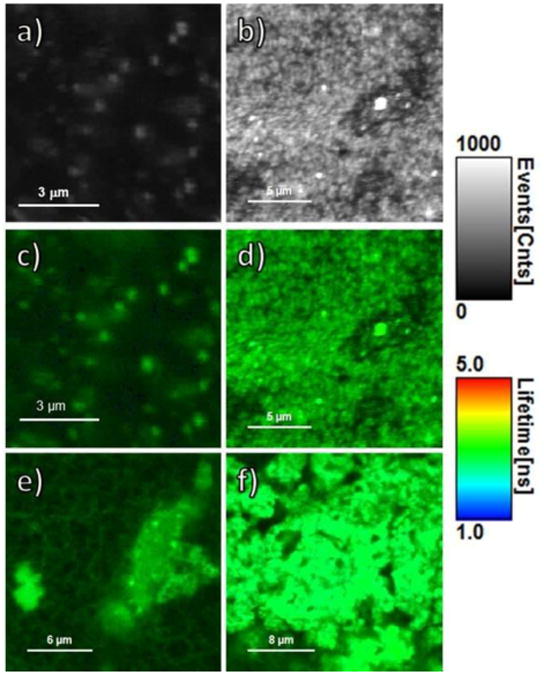
FLIM images of phantoms with RhB base. Depicting only FI (shown in counts of fluorescence events), the images show phantoms containing (a) RhB only and (b) GNS-RhB. Combining FI (shown as brightness) and FLT (shown as color), the images show phantoms containing (c) RhB only, (d) GNS-RhB, (e) GNR690-RhB and (f) GNR760-RhB. For all 6 images, the gray, brightness scale bar represents FI in counts/msec. The color scale bar displays the FLT range in nsec. All images were obtained under the same conditions, same set-up, and same excitation power.
Figure 6.
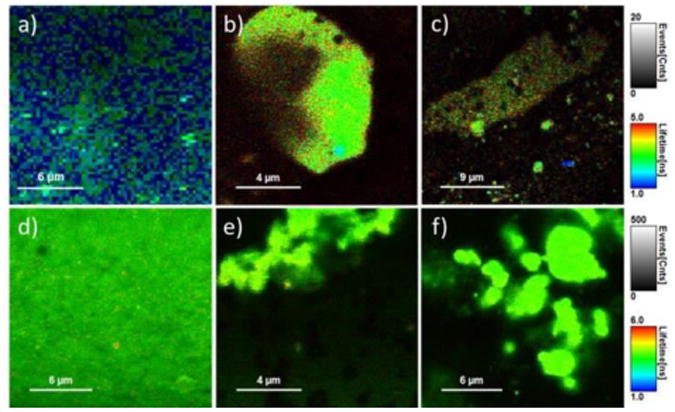
FLIM images of phantoms containing (a) GNS-SRD, (b) GNR690-SRD, (c) GNR760-SRD, (d) GNS-Flu, (e) GNR690-Flu and (f) GNR760-Flu. Each gray scale bar applies to all images in a given row, and represents FI in counts/msec. Each color scale bar applies to all images in a given row, and displays the FLT range in nsec. All images for a given fluorophore were obtained under the same conditions, same set-up, and same excitation power.
2.4 Diffusion Reflection measurements of solid phantoms
DR was used to detect GNP presence in the same solid phantoms also measured through FLIM, following the procedure described in the Methods section (3.4). By measuring the intensity of reflected light from the phantom (denoted by I(ρ)) over varying separation distances between the light source and detector (denoted by ρ), the slope of ln(ρ2 I(ρ)) versus ρ was calculated for phantoms containing only water, GNS, and each type of GNRs. As explained in the Introduction section, Eq. (2), the slope of this line directly describes the spectral properties (absorbance and scattering) of the sample, or phantom in this case. Figure 7 shows results for each of these types of phantoms using a light source of 780nm. In such DR figures, a more pronounced slope indicates greater particle absorption. As expected, Fig. 7 indicates that the GNRs with a peak at 760nm absorbed the source light most efficiently, and the shorter GNRs absorbed less efficiently. Meanwhile, the GNS and water phantoms performed in a similar manner, due to the very low absorption of the GNSs at 780nm (see Fig. 2(a)). Since none of the fluorophores considered absorb at this wavelength, the DR system only differentiates between the different GNPs geometries. For this reason, only 4 phantoms are presented in Fig. 7: a phantom without GNPs, a phantom with GNS, a phantom with GNR690, and a phantom with GNR760, where each GNP was conjugated to RhB. It can be seen that by tuning the probing light used by the DR system, we are able to efficiently test for the presence of corresponding particles within the volume of a sample.
Figure 7.
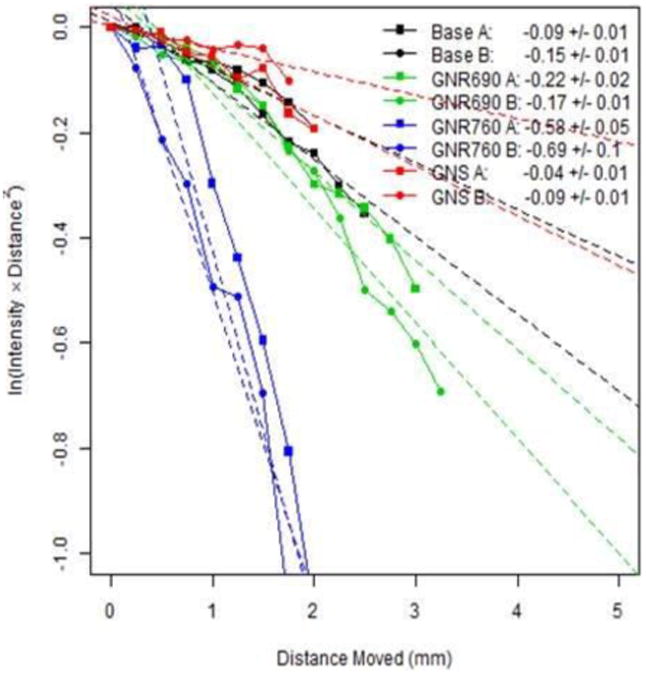
Diffusion Reflection (DR) measurements of scattered light intensity as a function of distance from 4 different phantoms, each denoted by a different color: a water-only base (black), GNR690 (green), GNR760 (blue), and GNS (red). Each phantom was measured 2 times, as denoted by the marker shapes. The light source had wavelength 780nm, and the concentration of the particles in the phantoms was set so that they would contain a fluorophore concentration of 5μM. The legend depicts the slope ± standard error to the slope of a fitted line to the corresponding curve. As explained in Eq. (2), this slope is an indication of the spectral properties of the sample.
2.5 Discussion
In this work, we demonstrated that FLIM and DR measurements can sensitively indicate GNPs presence in tissue-like phantoms. The highlight of the technique is the use of fluorescence enhancement through the proper choice of fluorophore and a simple control of the separation distance between fluorophores and GNPs. We achieved MEF with 2 different dyes, each having different excitation peaks but both at wavelengths longer than the GNPs SPR. Furthermore, we witnessed the phenomenon both in solution as well as in solid phantoms. The implications include the ability to create efficient optical GNP-based probes, even over a span of excitation wavelengths. However, the degree of enhancement depends on the original quantum yield of the imaged fluorophore, meaning that a dye that initially exhibits bright fluorescence will not be greatly affected by conjugation to GNPs. Despite its sensitivity, FLIM only provided fluorescence information from sample surfaces. Meanwhile, DR provided a degree of deep-tissue imaging, revealing GNP presence within phantoms by detecting a change in tissue phantom optical properties.
With our efficient GNP-fluorophore constructs, we were able to produce enhanced fluorescence images with FLIM and detect GNPs presence with DR in the same phantoms. Through the use of phantoms, we were able to gain insight into tissue behavior in similar imaging situations. Both of these detection methods are non-invasive, simple to perform, and very sensitive, making their combination with MEF a very promising imaging tool for medical diagnostics.
3 Methods
3.1 Nanoparticle Fabrication and Coating
For the purposes of this study we created 3 shapes of GNPs: GNSs and GNRs of 2 aspect ratios. The method of Enüstün and Turkevich was used to assemble GNSs with a diameter of about 20nm [44]. For the process, 414μL of 50% HAuCl4 was mixed into 200mL distilled water, and then boiled. Upon boiling, 4.04mL 10% sodium citrate was added, and the solution was stirred with heat for 5 minutes. Then the mixture was left at room temperature until it cooled down. The nanoparticles were collected through repeated centrifugation.
GNRs were constructed using a modified version of the Seed-Mediated Growth Method [45, 46]. Gold seeds were created by mixing 250μL HAuCl4 (0.01M) with 9.75mL CTAB (0.1M), and left to stir. Then 600μL NaBH4 (0.01M) was added, and the solution was left to stir for 10 minutes. After 10 minutes the mixture was removed from stirring, and allowed to sit for at least 1 hour. In a flask, 95mL CTAB (0.1M) was mixed with 5 mL HAuCl4 (0.01M). Silver nitrate (0.01M) was added, with 0.6mL to create shorter rods, and 1.2mL for longer rods. Afterwards, 550μL of ascorbic acid (0.1M) was added, turning the solution clear. From the seed created previously, 120μL was added to the flask, and the solution was allowed to sit overnight. The following day, the particles were concentrated through centrifugation until reaching clear suspensions.
All nanoparticles were coated with 15% PEG-NH2 (MW 1000 gr/mol) (Creative PEGWorks, Winston Salem, USA) and 85% methoxy-PEG-SH (MW 1000 gr/mol) (Creative PEGWorks), by allowing them to stir with the PEG particles for at least 3 hours. Afterwards, each type of particle was divided into 4 groups. One group was left with only the PEG coating, and each of the other 3 was mixed with a different fluorophore, with the number of moles of fluorophore equal to the number of moles of PEG-NH2. The 3 fluorophores used were Flu, RhB, and SRD (Sigma-Aldrich, Israel). In addition to the fluorophores, also EDC (1-Ethyl-3-(3-dimethylaminopropyl) carbodiimide HCl) and NHS (N-Hydroxysulfosuccinimide sodium salt) were added in similar concentrations, as activating agents to help form proper bonds between the fluorophores and PEG chains by creating good leaving groups. The particles were left to stir with the fluorophores overnight, and then centrifuged up to a point of clear suspension. Dilutions were made of all particles so that the final concentration of fluorophores present in each sample was around 10μM.
3.2 Solid Phantom Construction
Solid phantoms were created by mixing 10% Intralipid (Lipfundin MCT/LCT 20%, B. Braun Melsungen AG, Germany) for scattering, 3% India ink (0.1%) for absorption, and the other 87% of the volume completed either with distilled water, nanoparticle solution, or fluorophore solution. Agarose powder (SeaKem LE Agarose, Lonza, USA) was added as 1.2% in order to solidify the solution. The components were stirred together while heated until even mixing was achieved, and then poured into wells capable of holding the volume. The wells were placed into a vacuum to help cool and solidify over a few hours.
A total of 27 phantoms were assembled. Three phantoms were created as controls, as phantoms of volume 4mL containing no GNP at all. One of these completed the last 87% of volume with distilled water only, 1 control had 10μM RhB, and the last control had 5μM RhB. The other 24 phantoms were all composed of a 400μL inner phantom that contained GNP, and a 4mL outer base phantom for contrast. With an outer base of water phantoms, a phantom was created for each particle type, and each fluorophore, once with a fluorophore concentration equal to the prepared solutions of 10 μM, and once with half of the concentration (5μM), for a total of 18 phantoms with a water base (3 particle types × 3 fluorophores × 2 concentrations = 18 phantoms). In addition, a phantom was created for each particle type bound to RhB at 10μM with a 10μM RhB base, and for each particle type bound to RhB at 5μM with a 5μM RhB base (3 types of particles with RhB at 10μM each + 3 types at 5μM each = 6 phantoms with RhB base). First the inner phantoms were created and solidified to form cylindrical phantoms of about 5mm diameter, and then they were placed in 15mm wells, and the base phantom solutions were poured around them and allowed to solidify.
3.3 FLIM measurements – FI and FLT
Fluorescence measurements were obtained through a scanning confocal PicoQuant MicroTime 200 microscope (PQ MT200) with time-correlated single-photon counting abilities. The psec pulsed excitation laser (473nm or 510nm, 20-MHz repetition rate, 80-ps FWHM) was reflected by a dichroic mirror into an inverted microscope (Olympus, IX71). A water immersion objective (Olympus 60×, 1.2 numerical aperture (NA)) was used for focusing the laser light onto the sample and for collecting the FI emission from the sample. The FI signal that passed through the dichroic mirror and band-pass filter was focused through a 75μm pinhole to single-photon avalanche photodiode (SPAD) (SPCM-AQR-14, Perkin Elmer Inc) detectors. The samples containing Flu were excited by a 473nm laser, using a 473/10nm excitation laser clean up filter, dichroic filter Z476RDC, and collection 520/40 bandpass filter (500-540nm). RhB and SRD samples were excited by a 510nm laser, using a 510/10nm excitation laser clean up filter, dichroic filter ZT514RDC, and collection 550 LP filter. FLIM images, including both FLT and FI information, were recorded by raster scanning the samples through the excitation light focused by means of a linearized piezo scanner. All the analyses were performed using PQ Symphotime software.
3.4 Diffusion Reflection Measurements
DR measurements were conducted on the same phantoms as used for FLIM, using a device designed for the noninvasive optical imaging technique (NEGOH-OP TECHNOLOGIES, Israel), and the method has been previously described [18, 19]. Two laser diodes, of wavelengths 650nm and 780nm, served as excitation sources, and a 125μm diameter optical fiber was used for irradiation. A photodiode was placed in contact with a phantom's surface to detect scattered light while minimizing ambient light and potential losses due to the phantom's edges. The light source was moved on a micrometer plate in steps of 250μm so that the light intensity reaching the photodiode could be measured at varying distances between the source and detector (ρ), with an initial separation of approximately 1mm, and a final separation of about 5 or 6mm. The reflected light intensity at the photodiode, I(ρ), was measured using a digital scope (Agilent Technologies, Mso7034a, Santa Clara, CA, USA), and data was processed using LabView.
Acknowledgments
This work was partially supported by the U.S. National Institutes of Health (grant No. AI087968, NIGMS R01GM117836 (K.R.)). The authors thank Dr. J. Lakowicz for access to the Fluorescent Lifetime Imaging Microscopy (FLIM) facility at the Center for Fluorescence Spectroscopy.
References
- 1.Cao YC, Jin R, Mirkin CA. Nanoparticles with Raman spectroscopic fingerprints for DNA and RNA detection. Science. 2002;297:1536–1540. doi: 10.1126/science.297.5586.1536. [DOI] [PubMed] [Google Scholar]
- 2.Rosi NL, Mirkin CA. Nanostructures in biodiagnostics. Chem Rev. 2005;105:1547–1562. doi: 10.1021/cr030067f. [DOI] [PubMed] [Google Scholar]
- 3.Nie S, Xing Y, Kim GJ, Simons JW. Nanotechnology applications in cancer. Annu Rev Biomed Eng. 2007;9:257–288. doi: 10.1146/annurev.bioeng.9.060906.152025. [DOI] [PubMed] [Google Scholar]
- 4.Eghtedari M, Liopo AV, Copland JA, Oraevsky AA, Motamedi M. Engineering of hetero-functional gold nanorods for the in vivo molecular targeting of breast cancer cells. Nano Lett. 2009;9:287–291. doi: 10.1021/nl802915q. [DOI] [PMC free article] [PubMed] [Google Scholar]
- 5.Von Maltzahn G, Park J, Agrawal A, Bandaru NK, Das SK, Sailor MJ, Bhatia SN. Computationally guided photothermal tumor therapy using long-circulating gold nanorod antennas. Cancer Res. 2009;69:3892–3900. doi: 10.1158/0008-5472.CAN-08-4242. [DOI] [PMC free article] [PubMed] [Google Scholar]
- 6.El-Sayed MA. Some interesting properties of metals confined in time and nanometer space of different shapes. Acc Chem Res. 2001;34:257–264. doi: 10.1021/ar960016n. [DOI] [PubMed] [Google Scholar]
- 7.Jain PK, Lee KS, El-Sayed IH, El-Sayed MA. Calculated absorption and scattering properties of gold nanoparticles of different size, shape, and composition: applications in biological imaging and biomedicine. J Phys Chem B. 2006;110:7238–7248. doi: 10.1021/jp057170o. [DOI] [PubMed] [Google Scholar]
- 8.Zhang Y, Yu J, Birch DJS, Chen Y. Gold nanorods for fluorescence lifetime imaging in biology. J Biomed Opt. 2010;15:020504. doi: 10.1117/1.3366646. [DOI] [PubMed] [Google Scholar]
- 9.Copland JA, Eghtedari M, Popov VL, Kotov N, Mamedova N, Motamedi M, Oraevsky AA. Bioconjugated gold nanoparticles as a molecular based contrast agent: implications for imaging of deep tumors using optoacoustic tomography. Mol Imaging Biol. 2004;6:341–349. doi: 10.1016/j.mibio.2004.06.002. [DOI] [PubMed] [Google Scholar]
- 10.Qian X, Peng XH, Ansari DO, Yin-Goen Q, Chen GZ, Shin DM, Yang L, Young AN, Wang MD, Nie S. In vivo tumor targeting and spectroscopic detection with surface-enhanced Raman nanoparticle tags. Nat Biotechnol. 2008;26:83–90. doi: 10.1038/nbt1377. [DOI] [PubMed] [Google Scholar]
- 11.Robinson JT, Welsher K, Tabakman SM, Sherlock SP, Wang H, Luong R, Dai H. High performance in vivo near-IR (>1 μm) imaging and photothermal cancer therapy with carbon nanotubes. Nano Res. 2010;3:779–793. doi: 10.1007/s12274-010-0045-1. [DOI] [PMC free article] [PubMed] [Google Scholar]
- 12.Reuveni T, Motiei M, Romman Z, Popovtzer A, Popovtzer R. Targeted gold nanoparticles enable molecular CT imaging of cancer: an in vivo study. Int J Nanomedicine. 2011;6:2859–2864. doi: 10.2147/IJN.S25446. [DOI] [PMC free article] [PubMed] [Google Scholar]
- 13.Fixler D, Nayhoz T, Ray K. Diffusion reflection and fluorescence lifetime imaging microscopy study of fluorophore-conjugated gold nanoparticles or nanorods in solid phantoms. ACS Photonics. 2014;1:900–905. doi: 10.1021/ph500214m. [DOI] [PMC free article] [PubMed] [Google Scholar]
- 14.Subhash N, Mallia JR, Thomas SS, Mathews A, Sebastian P, Madhavan J. Oral cancer detection using diffuse reflectance spectral ratio R540/R575 of oxygenated hemoglobin bands. J Biomed Opt. 2006;11:014018. doi: 10.1117/1.2165184. [DOI] [PubMed] [Google Scholar]
- 15.McMurdy J, Jay G, Suner S, Crawford G. Photonics-based in vivo total hemoglobin monitoring and clinical relevance. J Biophotonics. 2009;2:277–287. doi: 10.1002/jbio.200910019. [DOI] [PubMed] [Google Scholar]
- 16.Ankri R, Taitelbaum H, Fixler D. Reflected light intensity profile of two-layer tissues: phantom experiments. J Biomed Opt. 2011;16:085001. doi: 10.1117/1.3605694. [DOI] [PubMed] [Google Scholar]
- 17.Ankri R, Taitelbaum H, Fixler D. On phantom experiment of the photon migration model in tissues. Open Opt J. 2011;5:28–32. [Google Scholar]
- 18.Ankri R, Duadi H, Motiei M, Fixler D. In-vivo tumor detection using diffusion reflection measurements of targeted gold nanorods - a quantitative study. J Biophotonics. 2012;5:263–273. doi: 10.1002/jbio.201100120. [DOI] [PubMed] [Google Scholar]
- 19.Ankri R, Peretz V, Motiei M, Popovtzer R, Fixler D. A new method for cancer detection based on diffusion reflection measurements of targeted gold nanorods. Int J Nanomedicine. 2012;7:449–455. doi: 10.2147/IJN.S28424. [DOI] [PMC free article] [PubMed] [Google Scholar]
- 20.Fixler D, Ankri R. Subcutaneous gold nanorods [corrected] detection with diffusion reflection measurement. J Biomed Opt. 2013;18:61226. doi: 10.1117/1.JBO.18.6.061226. [DOI] [PubMed] [Google Scholar]
- 21.Ankri R, Leshem-Lev D, Fixler D, Popovtzer R, Motiei M, Kornowski R, Hochhauser E, Lev EI. Gold nanorods as absorption contrast agents for the noninvasive detection of arterial vascular disorders based on diffusion reflection measurements. Nano Lett. 2014;14:2681–2687. doi: 10.1021/nl500573d. [DOI] [PubMed] [Google Scholar]
- 22.Lakowicz JR. Principles of Fluorescence Spectroscopy. Springer; New York, NY: 2006. [Google Scholar]
- 23.Becker W. Fluorescence lifetime imaging--techniques and applications. J Microsc. 2012;247:119–136. doi: 10.1111/j.1365-2818.2012.03618.x. [DOI] [PubMed] [Google Scholar]
- 24.Lakowicz JR. Radiative decay engineering 5: metal-enhanced fluorescence and plasmon emission. Anal Biochem. 2005;337:171–194. doi: 10.1016/j.ab.2004.11.026. [DOI] [PMC free article] [PubMed] [Google Scholar]
- 25.Ray K, Szmacinski H, Enderlein J, Lakowicz JR. Distance dependence of surface plasmon-coupled emission observed using Langmuir-Blodgett films. Appl Phys Lett. 2007;90:251116. doi: 10.1063/1.2751125. [DOI] [PMC free article] [PubMed] [Google Scholar]
- 26.Ray K, Badugu R, Lakowicz JR. Polyelectrolyte layer-by-layer assembly to control the distance between fluorophores and plasmonic nanostructures. Chem Mater. 2007;19:5902–5909. doi: 10.1021/cm071510w. [DOI] [PMC free article] [PubMed] [Google Scholar]
- 27.Ray K, Zhang J, Lakowicz JR. Fluorescence lifetime correlation spectroscopic study of fluorophore-labeled silver nanoparticles. Anal Chem. 2008;80:7313–7318. doi: 10.1021/ac8009356. [DOI] [PMC free article] [PubMed] [Google Scholar]
- 28.Kobayashi H, Choyke PL. Target-cancer-cell-specific activatable fluorescence imaging probes: rational design and in vivo applications. Acc Chem Res. 2011;44:83–90. doi: 10.1021/ar1000633. [DOI] [PMC free article] [PubMed] [Google Scholar]
- 29.Drake CR, Miller DC, Jones EF. Activatable optical probes for the detection of enzymes. Curr Org Synth. 2011;8:498–520. doi: 10.2174/157017911796117232. [DOI] [PMC free article] [PubMed] [Google Scholar]
- 30.Li X, Gao X, Shi W, Ma H. Design strategies for water-soluble small molecular chromogenic and fluorogenic probes. Chem Rev. 2014;114:590–659. doi: 10.1021/cr300508p. [DOI] [PubMed] [Google Scholar]
- 31.Lavis LD, Raines RT. Bright building blocks for chemical biology. ACS Chem Biol. 2014;9:855–866. doi: 10.1021/cb500078u. [DOI] [PMC free article] [PubMed] [Google Scholar]
- 32.Prost M, Hasserodt J. “Double gating” - a concept for enzyme-responsive imaging probes aiming at high tissue specificity. Chem Commun (Camb) 2014;50:14896–14899. doi: 10.1039/c4cc07147f. [DOI] [PubMed] [Google Scholar]
- 33.Razgulin A, Ma N, Rao J. Strategies for in vivo imaging of enzyme activity: an overview and recent advances. Chem Soc Rev. 2011;40:4186–4216. doi: 10.1039/c1cs15035a. [DOI] [PubMed] [Google Scholar]
- 34.Hutter E, Maysinger D. Gold-nanoparticle-based biosensors for detection of enzyme activity. Trends Pharmacol Sci. 2013;34:497–507. doi: 10.1016/j.tips.2013.07.002. [DOI] [PubMed] [Google Scholar]
- 35.Zhang J, Li C, Zhang X, Huo S, Jin S, An FF, Wang X, Xue X, Okeke CI, Duan G, et al. In vivo tumor-targeted dual-modal fluorescence/CT imaging using a nanoprobe co-loaded with an aggregation-induced emission dye and gold nanoparticles. Biomaterials. 2015;42:103–111. doi: 10.1016/j.biomaterials.2014.11.053. [DOI] [PMC free article] [PubMed] [Google Scholar]
- 36.Cheng W, Chen Y, Yan F, Ding L, Ding S, Ju H, Yin Y. Ultrasensitive scanometric strategy for detection of matrix metalloproteinases using a histidine tagged peptide-Au nanoparticle probe. Chem Commun (Camb) 2011;47:2877–2879. doi: 10.1039/c0cc04441e. [DOI] [PubMed] [Google Scholar]
- 37.Park SY, Lee SM, Kim GB, Kim YP. Gold nanoparticle-based fluorescence quenching via metal coordination for assaying protease activity. Gold Bull. 2012;45:213–219. [Google Scholar]
- 38.Tira DS, Focsan M, Ulinici S, Maniu D, Astilean S. Rhodamine B-coated gold nanoparticles as effective “turn-on” fluorescent sensors for detection of Zinc II ions in water. Spectrosc Lett. 2013;47:153–159. [Google Scholar]
- 39.Mohamed MB, Volkov V, Link S, El-sayed MA. The “lightning” gold nanorods : fluorescence enhancement of over a million compared to the gold metal. Chem Phys Lett. 2000;317:517–523. [Google Scholar]
- 40.Geddes CD, Lakowicz JR. Metal-enhanced fluorescence. J Fluoresc. 2002;12:121–129. [Google Scholar]
- 41.Ming T, Zhao L, Yang Z, Chen H, Sun L, Wang J, Yan C. Strong polarization dependence of plasmon-enhanced fluorescence on single gold nanorods. Nano Lett. 2009;9:3896–3903. doi: 10.1021/nl902095q. [DOI] [PubMed] [Google Scholar]
- 42.Abadeer N, Brennan M, Wilson W, Murphy C. Distance and plasmon wavelength dependent fluorescence of molecules bound to silica-coated gold nanorods. ACS Nano. 2014;8:8392–8406. doi: 10.1021/nn502887j. [DOI] [PubMed] [Google Scholar]
- 43.Kang KA, Wang J. Smart dual-mode fluorescent gold nanoparticle agents. Wiley Interdiscip Rev Nanomed Nanobiotechnol. 2014;6:398–409. doi: 10.1002/wnan.1267. [DOI] [PubMed] [Google Scholar]
- 44.Enüstün BV, Turkevich J. Coagulation of colloidal gold. J Am Chem Soc. 1963;85:3317–3328. [Google Scholar]
- 45.Nikoobakht B, El-Sayed MA. Preparation and growth mechanism of gold nanorods (NRs) using seed-mediated growth method. Chem Mater. 2003;15:1957–1962. [Google Scholar]
- 46.Sau TK, Murphy CJ. Seeded high yield synthesis of short Au nanorods in aqueous solution. Langmuir. 2004;20:6414–6420. doi: 10.1021/la049463z. [DOI] [PubMed] [Google Scholar]


