Abstract
Objectives:
To evaluate the association between dental service utilization and mental health in an adult population in the context of the socioeconomic status of the participants.
Subjects and Methods:
Multi-stage cluster random sampling was performed in Tehran, Iran, in 2011. Data were collected on dental service utilization, barriers of dental visit, self-perceived oral health, mental health, age, gender, education, and wealth status. The complex sample analysis method in SPSS and the survey data analysis menu in STATA were employed for statistical evaluation.
Results:
Of 20,320 participants, 25–36% suffered from disorders in at least one of the domains of somatization, anxiety, social dysfunction, and depression. Only 56% of the participants visited a dentist at least once during the last year. The main barriers to a dental visit were “no perceived need” and “high costs.” Females, the richest participants, subjects aged 25–64-year-old, and those with poor self-perceived oral health, mental health disorders, and higher education had more visits. The participants who perceived the need but did not visit a dentist due to some reasons mostly comprised females, those aged 25–44-year-old, those with a poor perceived oral health, disordered people in all domains of mental health, and poorer participants.
Conclusion:
Dental service utilization was influenced by socioeconomic factors and the mental health status of the adult population after controlling for multiple confounders. Reducing financial hardship and providing health education on the importance of preventive visits may decrease barriers to regular visits in countries with developing oral health systems.
Keywords: Dental service utilization, mental health, socioeconomic status, Urban Health Equity Assessment and Response Tool
INTRODUCTION
Improvement in the oral health status by the early detection of active disease is an important achievement of regular dental visits.[1] One of the commonly used indices to assess dental service utilization is the percentage of the population attending a dental visit in the previous year.[2] In developing countries, people only visit the dentist for pain relief rather than preventive care, compared to developed countries where about 40–80% of the adults visit a dentist within 1-year.[3] It is notable that some psychosocial and perceptional factors may interfere with service utilization.[4,5]
Mental disorders affect about 450 million people at all socioeconomic levels around the world.[6] In Iran, about 40% of the adult population suffers from mental disorders.[7] Few studies examining the relationship between dental services utilization and mental disorders have revealed controversial results.[5] Some have indicated that women with depressive symptoms have lower tendency to visit the dentist[8] while some other studies have reported that patients with mental disorders attend dental clinics more frequently compared to their normal counterparts.[9,10] Several other investigations have not found a lower likelihood of health service use or receiving routine health care among persons with mental health disorders compared to healthy individuals.[11,12] Besides, socioeconomic inequalities in mental health have been shown in a number of populations but the evidence for such relationships is limited in developing countries.[13,14,15] Therefore, more related research is warranted to improve the current knowledge and policy regarding socioeconomic inequalities in mental health.
The aim of the present survey was to investigate the association of dental service utilization with mental health measures in the context of socioeconomic status (SES) of the Iranian adult population.
SUBJECTS AND METHODS
Participants
Tehran is the capital of Iran and the largest city in Western Asia. With a population of around 8.4 million, the main provider of oral health care services is the private sector where more than 80% of the dentists are working. About 83% of the insured people in Iran have public insurance, but it covers only basic oral health care services. The dentist-population ratio is 1:5500 in Iran and 1:1800 in Tehran (Medical Council of Iran, 2007).[16] For conducting the present study, multi-stage cluster random sampling was used in 368 neighborhoods within all 22 districts of Tehran in 2011, during the second round of Urban Health Equity Assessment and Response Tool-2 (Urban HEART-2) survey, by the Municipality of Tehran.[17] Based on the population size of each neighborhood, a number of blocks were approached and eight systematic randomly selected households were included in each block for the purpose of this survey. Totally, a random sample of over 32,000 adults completed the oral health part of the questionnaire, among which a gender-balanced random sample of 21,039 adults, aged 15–64 years, were selected for the analysis. We excluded cases with missing data on age, gender, education, and frequency of dental visit, and eventually reached a population of 20,320 individuals with no missing data on these variables. The study was approved by the Ethics Committee of Tehran University of Medical Sciences. The adults provided their informed written consent to participate in the study.
QUESTIONNAIRES OF THE STUDY
Dental service utilization
The frequency of dental visits was inquired as an indicator of dental service utilization. The participants were asked the following question: How often did you visit a dentist during the last year? The possible answers were: “(1) Once, (2) twice, (3) 3 times, (4) 4 times and more, (5) no dental visit in the last year, (6) forgot whether I had a dental visit, and (7) no dental visit at all.” Then, we categorized the possible answers into three groups: No visit (items 5–7), 1–2 visits, and three or more visits during the last year.
Those with no dental visit during the last year were asked to select the most important reasons among the following choices: (1) Perceived no need, (2) lack of time, (3) dental fear, (4) costs of dental services, (5) unavailability of a dental clinic, (6) no trustful dentist, (7) fear of contagious diseases, and (8) other reasons. Later, the answers were dichotomized into those with no perceived need and those with perceived need but no visit due to other reasons.
Mental health assessment
The mental health status of the population was assessed by the General Health Questionnaire (GHQ-28). The participants’ status in each of the four domains of the GHQ-28, including somatization, anxiety, social dysfunction, and depression, was separately measured by seven questions. Each item was rated on a four-point scale that indicated whether the respondent recently experienced a particular symptom or behavior (1) less than usual, (2) no more than usual, (3) slightly more than usual, and (4) much more than usual. Scoring the items was done in a dichotomous approach (zero and one), based on the previous clinical validation of this sophisticated scoring system in a large population study. The answers that indicated positive or healthy behaviors according to the context of the question received a score of 0 and negative answers received a score of 1. A sum variable of each domain was calculated for each person with a minimum possible score of 0 and a maximum score of 7. Individuals, who gained a score of 2 and higher in each domain or six and higher for all 28 questions were considered as suspicious to have some mental disorders (disordered) while others were considered normal.[18]
Sociodemographic characteristics of the study population
Socioeconomic status
To determine the economic status, information about the living place was inquired: (1) The average living area in square per person which was then categorized according to the median of the data (smaller than the median (23 m2), the same as the median, and larger than the median), (2) room capitation per person (less than one room, one room, and more), and (3) type of residence (owned-rented). We also asked about the possession of 11 assets (yes/no): (1) Landline, (2) mobile phone, (3) bathroom, (4) kitchen, (5) toilet, (6) car, (7) motorcycle, (8) refrigerator, (9) microwave oven, (10) computer, and (11) dishwasher. A wealth index was produced by the principal component analysis (PCA) method.[19] Accordingly, these 14 variables were entered into a matrix of correlations; then, according to the correlation values, a specific coefficient was assigned to each variable as its weight in making the wealth index. After that, by multiplying the related coefficients by the 14 items, a sum variable of wealth index was produced. According to the quintiles, the wealth index was classified into the poorest, poor, middle, rich, and the richest individuals.
Level of education
The individuals’ level of education was asked in nine ordinal levels from illiterate to the highest education. Then, we categorized them into three groups: (1) Under high school, (2) high school, and (3) academic education.
Self-perceived oral health
Self-perceived oral health was assessed by using the following question: How would you describe your oral health? with five Likert scale alternatives of (1) very good, (2) good, (3) average, (4) bad, and (5) very bad; which was then dichotomized to (1) poor (average, bad, and very bad) and (2) good (very good and good) for further analysis.
Statistical analysis
To consider the effect of sampling (clusters and stratums), we performed the analyses in the context of complex sample analysis by SPSS (IBM SPSS Statistics for Windows, Version 20.0. Armonk, NY: IBM Corp, 2011). For this purpose, an analysis plan was created. First, according to the census information of the Statistical Center of Iran (2011), the distribution of population in 22 districts of Tehran by gender, age, and district was extracted. The same data from our sample population was also extracted. Then, to calculate the weight of our dataset, we divided the data of the whole population by the data of the sample population to construct the related weights. Finally, by considering the district as the first stratum, neighborhood as the second stratum, and block as a cluster in preparing the analysis plan and application of the constructed weight, the complex sample analysis was run. Chi-square test was used for comparing the frequency and a general linear model was used for comparing the mean visit values. Binary logistic regression was applied to reveal associating factors of no dental vist despite perceived need vs no dental visit due to no percieved need. In addition, since multinomial logistic regression does not exist in the complex sample analysis of the SPSS, we applied STATA (Stata Statistical Software: Release 11 College Station, TX: StataCorp LP, 2009) to perform multinomial logistic regression models for categorical dependent variable of dental visit to control the association for all factors.
RESULTS
Among 20,320 individuals, 50% were men and about 50% were between 25- and 44-year-old. One-third of the respondents had an academic education. The sociodemographic characteristics, mental health measures, self-perceived oral health, and dental service utilization of the study population are described in Table 1. About 25–36% of the population was considered to be disordered with respect to the mental health status in at least one of the domains of somatization, anxiety, social dysfunction, and depression. More than half (56%) of the 15–64-year-old participants perceived their oral health as poor. In the entire population, 56% had visited a dentist for any reason at least once in the last year while 44% had no dental visit. The first two most common reasons for no dental service utilization during the last year were perceiving no need (41.8%) and the costs of dental services (35.4%) [Figure 1].
Table 1.
Sociodemographic characteristics, mental health measures, self-perceived oral health, and dental service utilization in 15-64-year-old (n=20,320) in Tehran, Iran
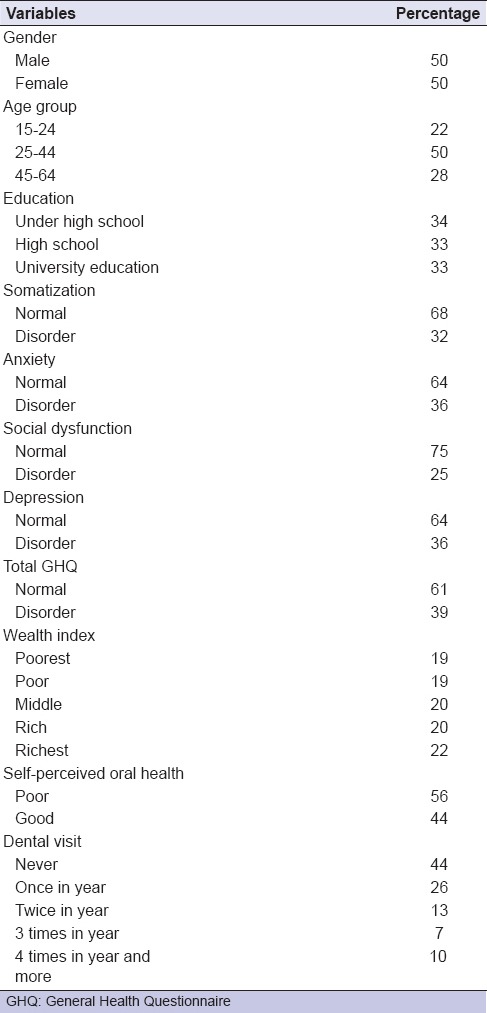
Figure 1.
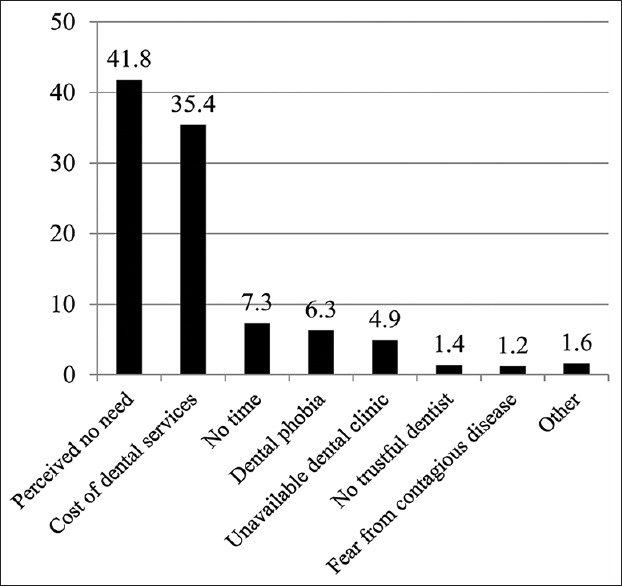
The reasons for no dental service utilization during the last year in 15–64-year-old (n = 10533) in Tehran, Iran (%)
Table 2 demonstrates dental service utilization by sociodemographic characteristics and self-perceived oral health of the study population. Comparison of the mean dental visits during the last year by the general linear model showed that the frequency of dental visits was the highest in females; participants aged 25–44-year-old, participants with higher education, the richest people, and those who had poor self-perceived oral health (P < 0.05). The percentage of the men having one or two visits during the last year was 39.2% versus 38.3% in women, and for three and more visits, it was 16.3 versus 17.9 with no significant difference (P = 0.051).
Table 2.
Dental service utilization among 15-64-year-old (n=20,320) according to sociodemographic subgroups and self-perceived oral health
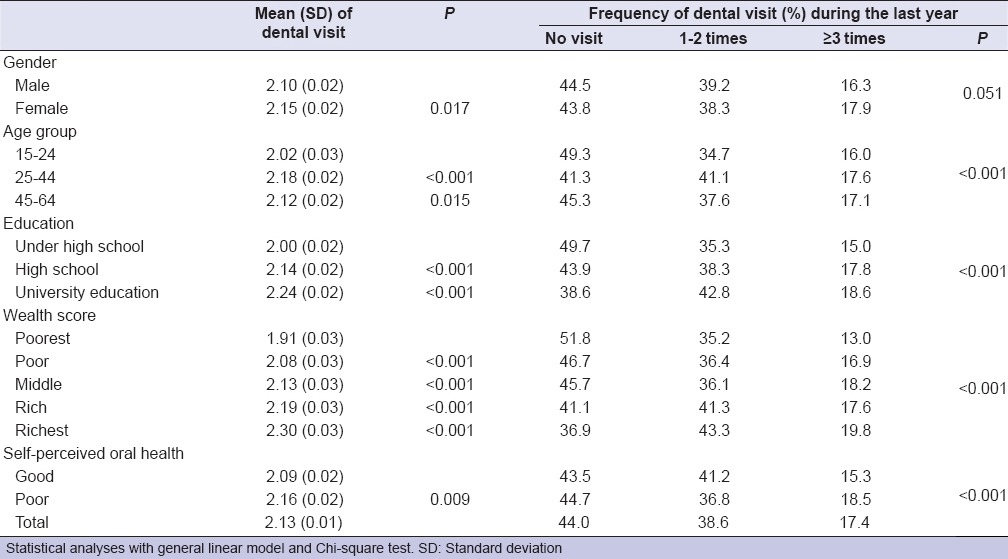
Among the participants aged 25–44-year-old, 41.3% had no dental visit. This figure was 45.3% for 45–64-year-old and 49.3% for 15–24-year-old (P < 0.001). The percentage of those with no visit was 49.7% among those with under high school education and 38.6% among those with academic education (P < 0.001). No visit was also significantly more common among the poorest group of the population compared to the richest (51.8% vs. 36.9%: P < 0.001). Attending one or two visits during the last year was more common among those with good perceived oral health but three and more visits was more common in those with poor perceived oral health (P < 0.001).
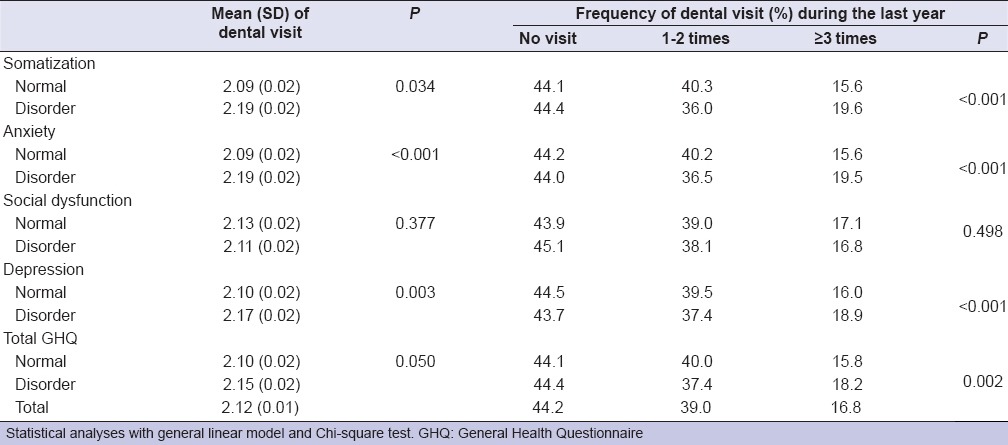
Table 3 compares the frequency of dental visits among different domains of the mental health status of the participants. According to Table 3, except for the social dysfunction domain (P = 0.377), the mean dental visits and the percentage of three or more visits during the last year were significantly higher in disordered people (P < 0.05).
Table 3.
Dental service utilization among 15-64-year-old (n=20,320) according to different aspects of mental health
After controlling for sociodemographic characteristics, self-perceived oral health, and mental health status [Table 4], the multinomial logistic regression revealed that one to two visits during the last year (vs. no visit) was associated with being richer (odds ratio [OR] = 1.5; 95% CI: 1.3–1.8: P < 0.001), older (OR = 1.4: P < 0.001 and OR = 1.3: P = 0.001), and having higher education (OR = 1.4; 95% CI: 1.3–1.6: P < 0.001). There were no significant associations between the mental health status and having one to two dental visits during the last year (P = 0.964).
Table 4.
Multinomial logistic regression analysis of the effect of sociodemographic variables, self-perceived oral health, and mental health status on last year dental visit (no visit, 1-2 times, and ≥3 times dental visit)
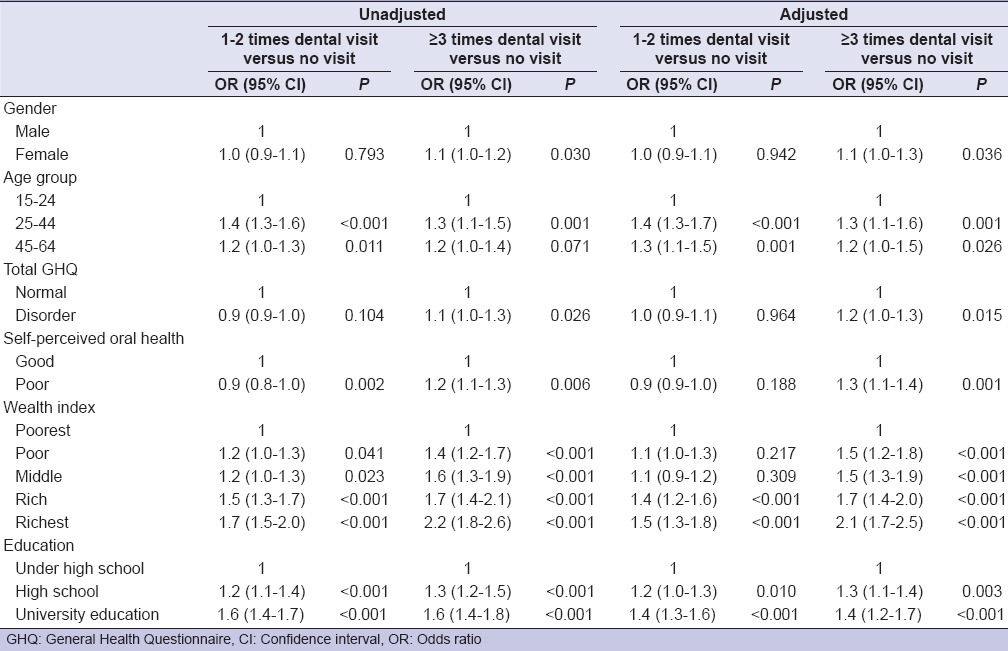
Considering the factors associated with more service utilization (3 times or more) versus no utilization during the previous year, the model revealed that females (OR = 1.1; 95% CI: 1.0–1.3: P = 0.036), the richest ones (OR = 2.1; 95% CI: 1.7–2.5: P < 0.001), those aged 25–64-year-old (OR = 1.2: P = 0.026 and OR = 1.3: P = 0.001), those with poor self-perceived oral health (OR = 1.3; 95% CI: 1.1–1.4: P = 0.001), participants with higher education (OR = 1.4; 95% CI: 1.2–1.7: P < 0.001), and those suspected to have mental disorders (OR = 1.2; 95% CI: 1.0–1.3: P = 0.015) used dental services more frequently in the last year.
The regression model showed that compared to those who perceived no need to visit a dentist, those who felt the need but did not visit the dentist due to high costs, lack of time, and other reasons mostly comprised females (OR = 1.4; 95% CI: 1.2–1.6: P < 0.001), those aged 25–44-year-old (OR = 1.6; 95% CI: 1.3–2.1: P < 0.001), those perceiving poor oral health (OR = 5.6; 95% CI: 4.8–6.5: P < 0.001), mentally disordered people (OR = 2.0; 95% CI: 1.7–2.3: P < 0.001), and poorer people (OR = 1.6; 95% CI: 1.3–2.1: P < 0.001).
DISCUSSION
The results of the present study on a representative sample[20] of Tehran inhabitants revealed that socioeconomic and psychological factors influenced the dental service utilization profile of the population. The strongest association was observed between the wealth of the community-dwelling adults and dental service utilization. It emphasizes a deep inequality in the oral health status of the population as the main consequence of poor service utilization by individuals with high perceived treatment need.
Approximately, half of the adults in our study used dental services in the last year, which was higher than Spain (34.3%)[21] and Turkey (40.4%),[22] but lower than Denmark and Finland, where 64% and 56% of the people had dental visits in the previous year, respectively.[23,24] In our study, after controlling for multiple factors, dental attendance was more frequent in females. It is in accordance with the findings of a number of studies in some developed countries that claim females are the most frequent users of dental care and attribute it to their tendency to gain better health.[25,26] Our results are compatible with a former study in Iran reporting more dental attendance among women,[2,27] which indicates that despite incomplete insurance coverage and a developing oral health system, gender might be considered as a determinant of service utilization.
While some studies have found no significant relationship between age and the frequency of dental visits, others suggest that the number of dental visits decreases with age among the elderly.[26,28] In accordance with these studies, our results showed that the mean visit frequency increased with age until 25–44 years of age and then decreased among the older population (aged 45–64-year-old) although it was still higher than the participants who were 15–24-year-old, which could be attributed to increased treatment requirements with aging. In contrast, two other studies reported that younger age groups visited the dentist more regularly in comparison with the older counterparts, which could be explained by more knowledge and fewer barriers.[2,29]
We used the GHQ-28 as a screening, self-reporting tool for mental health disorders in our study which showed that 36% of the study population met the criteria for depressive disorders and 36% had anxiety; totally, 39% of the respondents had mental disorders. This finding is in accordance with the result of a study by Noorbala et al. that reported about 40% of the Iranian adult population suffered from mental disorders.[7] A review of 27 studies found that 27% of the European adults[30] and 26% of the U.S. population[28] were affected by at least one mental disorder in the past 12 months. In this study, after controlling for sociodemographic characteristics and self-perceived oral health, more frequent service utilization was reported among mentally disordered people which agrees with some other reports on dental attendance of such populations.[5,9,31] Some other studies have reported a lower rate of visits among depressed people.[5,8] In general, several mental disorders reduce occupational productivity and regular attendance resulting in lowered income or unemployment.[32] Thus, in the short term, financial problems inhibit routine dental visits leading to overall health neglect. Consequently, these people may encounter increased pain and urgent dental treatment needs enforcing them to have more dental service utilization.
Several studies have shown that an unfavorable pattern of dental attendance is more frequent among adults with a lower SES.[25,33] Some studies have used income as a measure of SES; however, it is influenced by short-term changes in the occupation while wealth (or net worth) indicates lifelong accumulation of economic resources that is less sensitive to recent economic changes. More wealth has been shown to be associated with better health in a number of studies.[13,34] In our study, by using an inclusive wealth index as one of the proxies for the SES, the richest people with the highest score of the wealth index had utilized dental services twice more as compared to the poorest. This casts light on the inequality and social gradient in the oral health of the population which mandates the attention of policy makers and health managers. In line with our study, groups with higher education in Ireland make more use of dental services than the less educated people.[25] This finding is confirmed by several other studies.[22,24,35] According to some studies, education may be correlated with high health consciousness, which in turn leads to awareness of the importance of preventative dental hygiene and the urgency of addressing dental problems (such as regular visits).[25,28]
In the present study, the two most prevalent reasons for not using dental services during the last year were “no perceived need” and “high costs of dental services.” This finding is in accordance with the results of some studies indicating that the high costs of oral health care and lack of perceived need are the major barriers to seek oral health care.[3,36] The expensive nature of dental care and the limited coverage of dental services by public insurance have consistently remained as highly rated barriers to the utilization of oral health services worldwide, particularly in developing countries.[2,4,26] Some studies have shown that despite the need for treatment, less than half of the adult population visits the dentist in a year mainly due to “no perceived need to visit a dentist."[37] The present results also revealed that after controlling for all probable confounders, those who perceived the need but did not utilize dental services during the last year mainly consisted of vulnerable populations such as females, older age groups with more treatment needs, those with mental disorders, and poorer individuals with poor self-perceived oral health. These inequalities should be largely considered in the health promotion plans in Iran as well as most developing countries.
Our study had some limitations. First, data collection through a self-reported questionnaire may be subject to recall and social desirability biases. Second, although several confounders were adjusted in our analyses, we were unable to examine some other factors such as dental insurance, oral hygiene practices, and medications. Finally, longitudinal studies are required to assess the long-term impact of the mental health on oral health and their mutual interaction.
CONCLUSION
Dental service utilization is influenced by the low SES and mental disorders in the population. The point that the main barriers to dental attendance were “no perceived need” and “high costs” should prompt the policymakers to provide these people with education on oral healthcare in mental health settings to improve their concepts on the necessity of preventive dental visits. Facilitating service utilization through universal insurance coverage or subsidized services may be of great importance to decrease the patients’ costs in developing countries.
Financial support and sponsorship
The municipality of Tehran.
Conflicts of interest
There are no conflicts of interest.
Acknowledgement
The authors wish to thank the Municipality of Tehran to support and implement the survey. We greatly appreciate efforts of professor Ahmad Ali Noorbala and professor Mohammad Reza Vaez-Mahdavi who majorly contributed to the study. Our thanks go to all the respondents of the study for their valuable co-operation.
REFERENCES
- 1.Okunseri C, Born D, Chattopadhyay A. Self-reported dental visits among adults in Benin City, Nigeria. Int Dent J. 2004;54:450–6. doi: 10.1111/j.1875-595x.2004.tb00303.x. [DOI] [PubMed] [Google Scholar]
- 2.Bayat F, Vehkalahti MM, Zafarmand AH, Tala H. Impact of insurance scheme on adults’ dental check-ups in a developing oral health care system. Eur J Dent. 2008;2:3–10. [PMC free article] [PubMed] [Google Scholar]
- 3.Varenne B, Petersen PE, Fournet F, Msellati P, Gary J, Ouattara S, et al. Illness-related behaviour and utilization of oral health services among adult city-dwellers in Burkina Faso: Evidence from a household survey. BMC Health Serv Res. 2006;6:164. doi: 10.1186/1472-6963-6-164. [DOI] [PMC free article] [PubMed] [Google Scholar]
- 4.Ajayi DM, Arigbede AO. Barriers to oral health care utilization in Ibadan, South West Nigeria. Afr Health Sci. 2012;12:507–13. doi: 10.4314/ahs.v12i4.17. [DOI] [PMC free article] [PubMed] [Google Scholar]
- 5.Okoro CA, Strine TW, Eke PI, Dhingra SS, Balluz LS. The association between depression and anxiety and use of oral health services and tooth loss. Community Dent Oral Epidemiol. 2012;40:134–44. doi: 10.1111/j.1600-0528.2011.00637.x. [DOI] [PubMed] [Google Scholar]
- 6.Petersen PE. The World Oral Health Report 2003: Continuous improvement of oral health in the 21st century – The approach of the WHO Global Oral Health Programme. Community Dent Oral Epidemiol. 2003;31(Suppl 1):3–23. doi: 10.1046/j..2003.com122.x. [DOI] [PubMed] [Google Scholar]
- 7.Noorbala AA, Bagheri-Yazdi SA, Vaez-Mahdavi MR, Asadi-Lari M, Faghihzadeh S, Mohammad K, et al. Mental health changes in Tehran during 12 years: Comparing national health and disease survey (1999) and urban HEART-2 project (2011) Sci Res J Shahed Univ. 2014;113:37–42. [Google Scholar]
- 8.Anttila S, Knuuttila M, Ylöstalo P, Joukamaa M. Symptoms of depression and anxiety in relation to dental health behavior and self-perceived dental treatment need. Eur J Oral Sci. 2006;114:109–14. doi: 10.1111/j.1600-0722.2006.00334.x. [DOI] [PubMed] [Google Scholar]
- 9.Marques-Vidal P, Milagre V. Are oral health status and care associated with anxiety and depression?. A study of Portuguese health science students. J Public Health Dent. 2006;66:64–6. doi: 10.1111/j.1752-7325.2006.tb02553.x. [DOI] [PubMed] [Google Scholar]
- 10.Miyachi H, Wake H, Tamaki K, Mitsuhashi A, Ikeda T, Inoue K, et al. Detecting mental disorders in dental patients with occlusion-related problems. Psychiatry Clin Neurosci. 2007;61:313–9. doi: 10.1111/j.1440-1819.2007.01657.x. [DOI] [PubMed] [Google Scholar]
- 11.Patten SB, Williams JV, Lavorato DH, Eliasziw M. The effect of major depression on participation in preventive health care activities. BMC Public Health. 2009;9:87. doi: 10.1186/1471-2458-9-87. [DOI] [PMC free article] [PubMed] [Google Scholar]
- 12.Pearson WS, Dhingra SS, Strine TW, Liang YW, Berry JT, Mokdad AH. Relationships between serious psychological distress and the use of health services in the United States: Findings from the behavioral risk factor surveillance system. Int J Public Health. 2009;54(Suppl 1):23–9. doi: 10.1007/s00038-009-0003-4. [DOI] [PubMed] [Google Scholar]
- 13.Carter KN, Blakely T, Collings S, Imlach Gunasekara F, Richardson K. What is the association between wealth and mental health? J Epidemiol Community Health. 2009;63:221–6. doi: 10.1136/jech.2008.079483. [DOI] [PubMed] [Google Scholar]
- 14.Morasae EK, Forouzan AS, Majdzadeh R, Asadi-Lari M, Noorbala AA, Hosseinpoor AR. Understanding determinants of socioeconomic inequality in mental health in Iran's capital, Tehran: A concentration index decomposition approach. Int J Equity Health. 2012;11:18. doi: 10.1186/1475-9276-11-18. [DOI] [PMC free article] [PubMed] [Google Scholar]
- 15.Reisine ST, Psoter W. Socioeconomic status and selected behavioral determinants as risk factors for dental caries. J Dent Educ. 2001;65:1009–16. [PubMed] [Google Scholar]
- 16.Bayat F. Impact of Dental Insurance on Adults Oral Health Care in Tehran, Iran [PhD Thesis]: University of Helsinki, Finland. 2010 [Google Scholar]
- 17.Asadi-Lari M, Vaez-Mahdavi MR, Faghihzadeh S, Cherghian B, Esteghamati A, Farshad AA, et al. Response-oriented measuring inequalities in Tehran: Second round of urbanhealth equity assessment and response tool (Urban HEART-2), concepts and framework. Med J Islam Repub Iran. 2013;27:236–48. [PMC free article] [PubMed] [Google Scholar]
- 18.Noorbala A, Mohammad K. The validation of general health questionnaire-28 as a psychiatric screening tool. Hakim Res J. 2009;11:47–53. [Google Scholar]
- 19.Cheraghian B, Asadi-Lari M, Mansournia MA, Majdzadeh R, Mohammad K, Nedjat S, et al. Prevalence and associated factors of self-reported hypertension among Tehran adults in 2011: A population-based study (Urban HEART-2) Med J Islam Repub Iran. 2014;28:105. [PMC free article] [PubMed] [Google Scholar]
- 20.Asadi-Lari M, Vaez-Mahdavi M. Tehran: World Health Organization Report; 2008. [Last accessed on 2015 Jul 15]. An overview on Urban-Heart Tehran Experience [Internet] Available from: http://www.who.int/kobe_centre/measuring/urbanheart/tehran_urbanheart_city_report.pdf/ [Google Scholar]
- 21.Pizarro V, Ferrer M, Domingo-Salvany A, Benach J, Borrell C, Pont A, et al. The utilization of dental care services according to health insurance coverage in Catalonia (Spain) Community Dent Oral Epidemiol. 2009;37:78–84. doi: 10.1111/j.1600-0528.2008.00439.x. [DOI] [PubMed] [Google Scholar]
- 22.Mumcu G, Sur H, Yildirim C, Soylemez D, Atli H, Hayran O. Utilisation of dental services in Turkey: A cross-sectional survey. Int Dent J. 2004;54:90–6. doi: 10.1111/j.1875-595x.2004.tb00261.x. [DOI] [PubMed] [Google Scholar]
- 23.Christensen LB, Petersen PE, Steding-Jessen M. Consumption of dental services among adults in Denmark 1994-2003. Eur J Oral Sci. 2007;115:174–9. doi: 10.1111/j.1600-0722.2007.00453.x. [DOI] [PubMed] [Google Scholar]
- 24.Suominen-Taipale AL, Widström E. A longitudinal study of young Finnish adults’ use of subsidized, private sector dental care, 1986-1997. Community Dent Oral Epidemiol. 2000;28:365–72. doi: 10.1034/j.1600-0528.2000.028005365.x. [DOI] [PubMed] [Google Scholar]
- 25.Guiney H, Woods N, Whelton H, Morgan K. Predictors of utilisation of dental care services in a nationally representative sample of adults. Community Dent Health. 2011;28:269–73. [PubMed] [Google Scholar]
- 26.Kadaluru UG, Kempraj VM, Muddaiah P. Utilization of oral health care services among adults attending community outreach programs. Indian J Dent Res. 2012;23:841–2. doi: 10.4103/0970-9290.111290. [DOI] [PubMed] [Google Scholar]
- 27.Bayat F, Vehkalahti MM, Heikki T, Zafarmand HA. Dental attendance by insurance status among adults in Tehran, Iran. Int Dent J. 2006;56:338–44. doi: 10.1111/j.1875-595x.2006.tb00338.x. [DOI] [PubMed] [Google Scholar]
- 28.Wu B, Tran TV, Khatutsky G. Comparison of utilization of dental care services among Chinese- and Russian-speaking immigrant elders. J Public Health Dent. 2005;65:97–103. doi: 10.1111/j.1752-7325.2005.tb02793.x. [DOI] [PubMed] [Google Scholar]
- 29.Syrjälä AM, Knuuttila ML, Syrjälä LK. Reasons preventing regular dental care. Community Dent Oral Epidemiol. 1992;20:10–4. doi: 10.1111/j.1600-0528.1992.tb00665.x. [DOI] [PubMed] [Google Scholar]
- 30.Wittchen HU, Jacobi F. Size and burden of mental disorders in Europe – A critical review and appraisal of 27 studies. Eur Neuropsychopharmacol. 2005;15:357–76. doi: 10.1016/j.euroneuro.2005.04.012. [DOI] [PubMed] [Google Scholar]
- 31.Klages U, Weber AG, Wehrbein H. Approximal plaque and gingival sulcus bleeding in routine dental care patients: Relations to life stress, somatization and depression. J Clin Periodontol. 2005;32:575–82. doi: 10.1111/j.1600-051X.2005.00716.x. [DOI] [PubMed] [Google Scholar]
- 32.Afonso-Souza G, Nadanovsky P, Chor D, Faerstein E, Werneck GL, Lopes CS. Association between routine visits for dental checkup and self-perceived oral health in an adult population in Rio de Janeiro: The Pró-Saúde Study. Community Dent Oral Epidemiol. 2007;35:393–400. doi: 10.1111/j.1600-0528.2006.00343.x. [DOI] [PubMed] [Google Scholar]
- 33.Ellershaw A. Dental attendance patterns of Australian adults. Aust Dent J. 2014;59:129–34. doi: 10.1111/adj.12151. [DOI] [PubMed] [Google Scholar]
- 34.Bertoldi C, Lalla M, Pradelli JM, Cortellini P, Lucchi A, Zaffe D. Risk factors and socioeconomic condition effects on periodontal and dental health: A pilot study among adults over fifty years of age. Eur J Dent. 2013;7:336–46. doi: 10.4103/1305-7456.115418. [DOI] [PMC free article] [PubMed] [Google Scholar]
- 35.Thomson WM, Williams SM, Broadbent JM, Poulton R, Locker D. Long-term dental visiting patterns and adult oral health. J Dent Res. 2010;89:307–11. doi: 10.1177/0022034509356779. [DOI] [PMC free article] [PubMed] [Google Scholar]
- 36.Marin GH, Urdampilleta P, Zurriaga O. Determinants of dental care utilization by the adult population in Buenos Aires. Med Oral Patol Oral Cir Bucal. 2010;15:e316–21. doi: 10.4317/medoral.15.e316. [DOI] [PubMed] [Google Scholar]
- 37.Reisine S. A path analysis of the utilization of dental services. Community Dent Oral Epidemiol. 1987;15:119–24. doi: 10.1111/j.1600-0528.1987.tb00497.x. [DOI] [PubMed] [Google Scholar]


