Abstract
The aim of this study is to reduce antinutritional factors and to improve the nutritional properties of Kutukutu during fermentation with Lactic Acid Bacteria (LAB). For that, Kutukutu (700 g) was prepared in the laboratory and inoculated with pure cultures of LAB (109 CFU/mL). Then, preparation was incubated for 120 h. Every 24 h, Kutukutu were collected, dried at 45°C for 24 h, and analyzed. The results showed that Lactobacillus brevis G25 increased reducing sugars content to 80.7% in Kutukutu after 96 h of fermentation. Lactobacillus fermentum N33 reduced the starch content to 73.2%, while Lactobacillus brevis G11, L. brevis G25, and Lactobacillus cellobiosus M41 rather increased the protein content to 18.9%. The bioavailability of Mg and Fe increased, respectively, to 50.5% and 70.6% in the Kutukutu fermented with L. brevis G25. L. plantarum A6 reduced the tannin content to 98.8% and L. buchneri M11 reduced the phytate content to 95.5%. The principal component analysis (PCA) shows that, for a best reduction of antinutrients factors and improvement of protein content and minerals, Kutukutu must be fermented by L. brevis G25 and L. fermentum N33, respectively. These starter cultures could be used to ameliorate nutritional proprieties of Kutukutu during the fermentation.
1. Introduction
The production of fermented corn paste by natural fermentation of grains soaked in water and ground is an artisanal transformation process of maize commonly used in Africa [1]. Such fermented corn paste can take many denominations in different countries. In Nigeria, for example, the fermented paste is called “Ogi” while in South Africa the term commonly used is “Mawe” [2]. In Cameroon, particularly in North Region, they call it “Kutukutu” [3]. This Kutukutu has an important place in the sociocultural and nutritional plan. In the sociocultural plan, Kutukutu is taken regularly during fast periods and is frequently used as complementary foods for infants [4]. In Cameroon, 70% of mothers give porridge prepared with Kutukutu to infants during the weaning period [5]. Moreover, it is a major source of proteins, carbohydrates, and calories in the diets of large number of population [6]. However Kutukutu contains many antinutritional factors such as phytic acid, polyphenols, and tannins which reduce bioavailability and digestibility of proteins and carbohydrates through formation of complex with minerals and inhibition of enzymes [7]. The technological processes such as mechanical, thermal, chemical, and biological processes are used to reduce antinutritional factors content and to improve the bioavailability of nutriments. Unlike thermal, chemical, and mechanical processes which can deteriorate quality of food, fermentation is one of the processes that decreases the level of antinutrients in food grains and increases the starch digestibility, protein digestibility, and nutritive value [4]. Among the microorganisms used in food fermentation, the LAB represents the principal group found on various substrates [8]. LAB are a large group of closely related bacteria that have similar properties such as lactic acid production, which is an end product of the fermentation. This LAB group includes Lactobacillus, Lactococcus, Streptococcus, and Leuconostoc species. Lactic fermentation is a common way of preparing traditional fermented food in Africa like maize porridge, alcoholic beverages, and dairy products. Several studies reported that LAB improve the nutritional quality of foods during fermentation by increasing the protein content, reducing sugar content, reducing the antinutritional factors (phytates, tannins, and polyphenols), improving the bioavailability of minerals [9], and increasing the energy density by hydrolyzing starch into simpler compounds such as glucose and fructose [10]. Although natural fermentation improves nutritional value and organoleptic qualities of foods [9], it has a major problem of fluctuation in the quality of different foods obtained [11]. Indeed, the spontaneous fermentation process that is carried out by the development of epiphytic microflora can lead to undesirable products on the organoleptic, microbiological, or toxicological quality [11]. That is why the natural fermentation is often the main cause of diarrhea and malnutrition in children [12].
To solve this problem, there is a crucial need to isolate and identify LAB with specific physiological and metabolic properties, which can be used as starters in view to improve general food quality and nutritional value as suggested by few authors [13–17]. The aim of this study is to reduce antinutritional factors and to improve the nutritional properties of Kutukutu during fermentation with L. brevis G11, L. brevis G25, L. buchneri M11, L. cellobiosus M41, L. fermentum N33, Lactobacillus fermentum N25, and L. plantarum A6.
2. Materials and Methods
2.1. Starters
The Kutukutu was obtained after individual fermentation with seven LAB under laboratory conditions. The strains like L. brevis G11, L. brevis G25, L. buchneri M11, L. cellobiosus M41, L. fermentum N33, and L. fermentum N25 were isolated from fermented corn and Kutukutu sampled in Northern Cameroon (Maroua, Garoua, and Ngaoundere). L. plantarum A6 was kindly provided by the Microbiology Laboratory of CIRAD Montpelier, France.
These lactic starters stored at 4°C on agar slants were cultured by streaks on MRS agar and incubated anaerobically at 30°C for 72 h. The perfectly insulated colonies were inoculated in test tubes containing 10 mL of MRS broth and incubated at 30°C for 16 h. The resulting preparation was centrifuged at 3000 rpm for 10 min and the resulting pellet was washed in 10 mL of physiological peptone water (peptone 1 g in saline solution (0.85% NaCl), pH 7.2) and centrifuged again. The pellet obtained was suspended in 10 mL saline water. The concentration of viable cells was adjusted at 109 CFU/mL using McFarland Standard tube number 4.
2.2. Production of Kutukutu
In order to evaluate the influence of LAB on the nutritional properties of the Kutukutu during fermentation with starters, the Kutukutu was produced under laboratory conditions following the traditional process with some modifications. Dry corn purchased from a local market in Ngaoundere (Adamaoua, Cameroon) was decontaminated in sterile distilled water containing benzoic acid 6% (w/v) (E210) for 24 h at room temperature. Then sterile corn was soaked in sterile distilled water for 48 h at room temperature. Grinding was proceeded after the determination of the water content (39.6%) using a metallic grinding mill. The paste obtained was mixed (1/3 w/v) with sterile distilled water and sieved through a sieve of mesh 200 μm. After decantation for 24 h at room temperature, the paste was collected (water content 73%) in a sterile container and kept for inoculation and fermentation.
2.3. Fermentation of Kutukutu
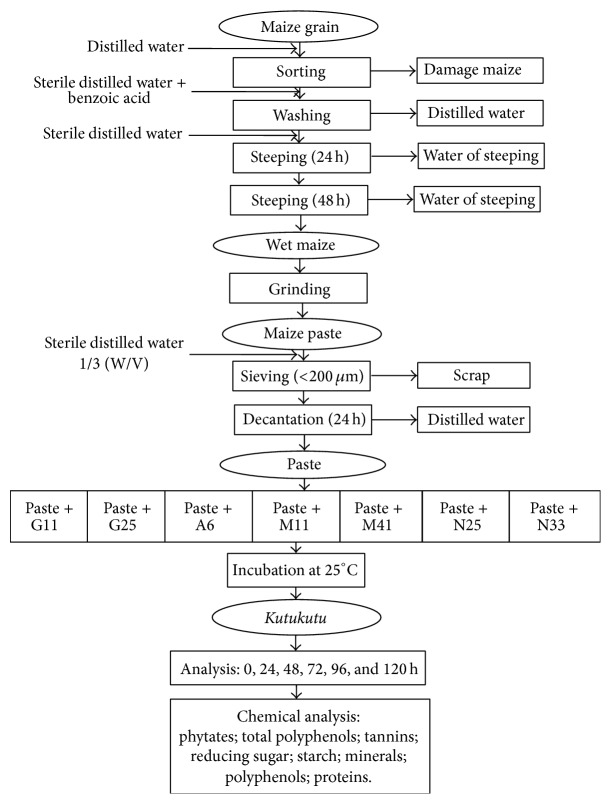
Flasks containing 700 g of previously described paste were inoculated separately with 1 mL containing 109 CFU of L. brevis G11, L. brevis G25, L. buchneri M11, L. cellobiosus M41, L. fermentum N11, L. fermentum N25, and L. plantarum A6. These flasks were covered and kept at 25°C for 120 h. The preparations were then homogenized on daily basis to enhance the distribution of bacteria in the medium. Aliquots were collected every 24 h, dried at 45°C for 24 h, and analyzed. The control sample was the same paste without LAB. Diagram of inoculation of Kutukutu with LAB in laboratory is reported in Figure 1.
Figure 1.
Diagram of inoculation of Kutukutu with LAB (G11 = L. brevis G11; G25 = L. brevis G25; A6 = L. plantarum A6; M11 = L. buchneri M1; M41 = L. cellobiosus M41; L. fermentum N33; L. fermentum N25).
2.4. Changes of Physicochemical Parameters in Kutukutu
To assess the physicochemical parameters, the pH was measured according to the method described by Afoakwa et al. [18]. The lactic acid content was determined by titration according to Obadina et al. [19] and was expressed in grams of lactic acid per 100 g of sample.
Reducing sugar was determined by the method described by Fischer and Stein [20] and the optical densities were read at 540 nm. The standard curve was drawn using a prepared aqueous solution of maltose.
The starch was determined by Jarvis and Walker method [21]. The optical densities were read at 580 nm. Standard curve was obtained using an aqueous solution of starch.
The total nitrogen content (N × 6.25) was determined after digestion of the samples according to the Kjeldahl method described by AFNOR [22] and the coloration was determined by the method of Devani et al. [23]. Standard curve was obtained using a solution of ammonium sulfate.
Minerals like iron (Fe), potassium (K), manganese (Mn), magnesium (Mg), zinc (Zn), copper (Cu), calcium (Ca), and sodium (Na) were determined by atomic absorption spectroscopy (Benton et al.) [24]. The phosphorus was determined using ammonium molybdate complex method described by Murphy and Riley [25].
The phytates content was determined by the colorimetric method described by Vaintraub and Lapteva [26], modified by Gao et al. [27], and the optical densities were read at 500 nm using a spectrophotometer. Standard curve was obtained using a solution of phytic acid.
The total polyphenols content and tannins were determined by the method of Marigo [28]. The optical densities were read at 725 nm. The formula below was used to determine the tannin content:
| (1) |
2.5. Statistical Analysis
The results were analyzed using Statgraphics 5.0 (1998) software for the analysis of variance (ANOVA), calculation of averages, and standard deviations. Differences between means were tested using the Duncan Multiple Range Test. Sigma plot 11.0 software was used to draw the curves.
3. Results and Discussion
3.1. Changes in pH
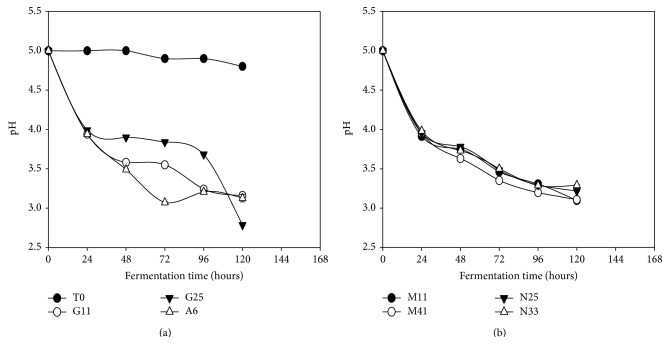
Generally, the pH of Kutukutu fermented with the different LAB trains decreased with time compared to the control (Figure 2). However, Kutukutu fermented with L. brevis G25 had the lowest pH (2.7) after 120 h. The decrease of pH is due to hydrolysis of carbohydrates during the fermentation which was followed by the production of organic acids [11]. Studies made by Ali and Mustafa [29] showed a similar reduction of pH from 4.3 to 3.4 in the sorghum dough fermented with the lactobacilli strains (L. fermentum, L brevis, and Lactobacillus amylovorus) after 6 h at 37°C.
Figure 2.
Evolution of pH in the Kutukutu during fermentation by the various LAB at 25°C (T0 = control; G11 = L. brevis G11; G25 = L. brevis G25; A6 = L. plantarum A6; M11 = L. buchneri M1; M41 = L. cellobiosus M41; N33 = L. fermentum N33; N25 = L. fermentum N25).
3.2. Changes in Lactic Acid
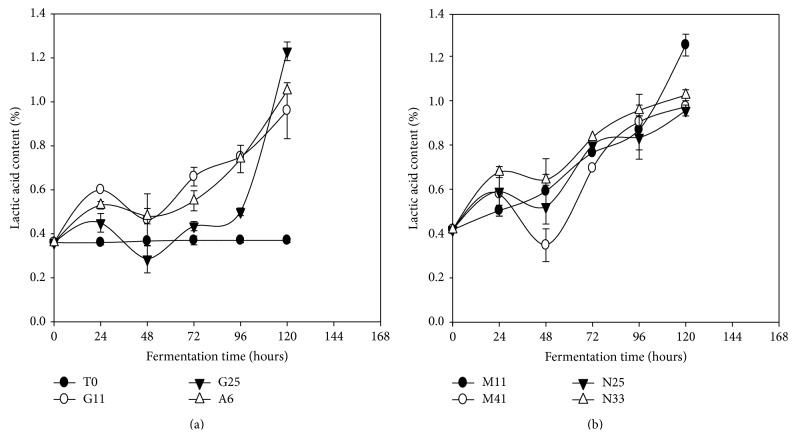
Contrarily to pH, acidity of Kutukutu increased significantly with time (P < 0.05) compared to the control (Figure 3). It was noted that L. brevis G25 had the highest acidity range (from 0.3 to 1.2%) during fermentation of Kutukutu. The increase of the acidity reflects the metabolism of sugars by LAB during fermentation [30]. From the organoleptic point of view, the acidity of Kutukutu makes it more appetizing for anorexic children and may also reduce bacterial contamination [31, 32]. This result is in agreement with the study of Wedad et al. [33] who showed increase in acidity of sorghum cultivar “Mugud” and cultivar “Karamaka” from 0.36 to 1.6% and from 0.36 to 1.8%, respectively, after 16 h of spontaneous fermentation at 28°C. The work of Hounhouigan et al. [34] also showed similar increase in acidity (88%) of corn flour after 72 h of fermentation.
Figure 3.
Evolution of the Lactic acid content in the Kutukutu during fermentation by the various LAB at 25°C (T0 = control; G11 = L. brevis G11; G25 = L. brevis G25; A6 = L. plantarum A6; M11 = L. buchneri M1; M41 = L. cellobiosus M41; N33 = L. fermentum N33; N25 = L. fermentum N25).
3.3. Reducing Sugar
The quantity of reducing sugars increased from 0 to 48 h of fermentation and then decreased after 48 h (Table 1). An increase of 130% in reducing sugars (from 168.2 to 387.6 mg/100 g DM) of Kutukutu fermented with L. buchneri M11 after 48 h was observed. Contrarily to other LAB species, the reducing sugars were produced by L. brevis G25 over a long period (96 h). According to Osman [35], the increase of sugars during fermentation could be explained by the hydrolysis of starch due to amylases produced by the LAB. Osman [35] showed an increase of glucose in millet flour from 6.8 to 11.35 g/100 g after 20 h of fermentation at 30°C. Osman also portrayed an increase in fructose ranging from 1.17 to 1.20 g/100 g after 20 h of fermentation at 30°C. Reducing sugars can equally be used during the fermentation by LAB for the synthesis of various organic acids [36]. This justifies the decrease of sugars in Kutukutu fermented with L. brevis G25 (304.9 to 131.5 mg/100 g DM) after 96 h and L. brevis G11 (282.9 to 246.3 mg/100 g DM), L. plantarum A6 (263.5 to 247.6 mg/100 g DM), L. buchneri (387.5 to 250.7 mg/100 g DM), L. cellobiosus (314.1 to 210.0 mg/100 g DM), L. fermentum N25 (321.7 to 236.1 mg/100 g DM), and L. fermentum N33 (353.9 to 215.7 mg/100 g DM) after 48 h. These results corroborate with those of Osman [35] who showed reduction of glucose and fructose from 11.35 to 7.3 g/100 g and 1.2 to 0.6/100 g, respectively, for fermented millet flour between 20 and 24 h.
Table 1.
Evolution of reducing sugars in the Kutukutu during fermentation by the various LAB at 25°C.
| Evolution of reducing sugar during fermentation (mg/100 g DM) | ||||||||
|---|---|---|---|---|---|---|---|---|
| Time (h) | Control | G11 | G25 | A6 | M11 | M41 | N25 | N33 |
| 0 | 168.2 ± 0.0d | 168.2 ± 0.0b | 168.2 ± 0.0b | 168.2 ± 0.0a | 168.2 ± 0.0a | 168.2 ± 0.0a | 168.2 ± 0.0a | 168.2 ± 0.0a |
| 24 | 168.0 ± 0.0d | 154.3 ± 3.5a | 189.5 ± 2.5c | 261.7 ± 10.5cd | 381.7 ± 6.2b | 277.6 ± 15.5b | 307.0 ± 2.5b | 286.0 ± 18.7b |
| 48 | 160.3 ± 1.0c | 282.9 ± 2.2e | 291.4 ± 11.8d | 263.6 ± 10.3d | 387.6 ± 7.0c | 314.2 ± 13.8c | 321.8 ± 7.6c | 354.0 ± 17.3c |
| 72 | 160.2 ± 1.3c | 270.5 ± 4.8d | 296.1 ± 10.9e | 254.3 ± 7.9cd | 377.5 ± 5.2d | 309.3 ± 12.9d | 313.7 ± 5.2d | 267.1 ± 17.3d |
| 96 | 157.1 ± 2.1b | 250.6 ± 0.6c | 305.0 ± 9.9ed | 234.5 ± 11.9b | 321.3 ± 7.4e | 287.0 ± 4.6e | 280.9 ± 6.8e | 218.2 ± 8.0e |
| 120 | 149.3 ± 2.4a | 246.4 ± 5.7c | 131.6 ± 6.9a | 247.7 ± 4.1bc | 250.8 ± 0.0f | 210.0 ± 8.8f | 236.2 ± 9.3f | 215.8 ± 2.5f |
The values followed by the same letter on the same column are not significantly different (P > 0.05).
T0 = control; G11 = L. brevis G11; G25 = L. brevis G25; A6 = L. plantarum A6; M11 = L. buchneri M11; M41 = L. cellobiosus M41; L. fermentum N33; L. fermentum N25.
3.4. Starch
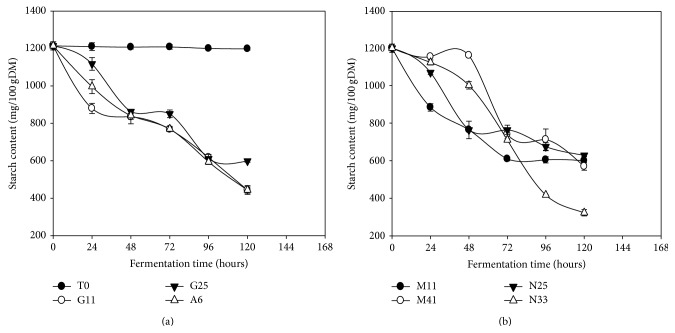
The majority of starchy compounds in the Kutukutu decreased significantly (P < 0.05) during fermentation as compared to the control (Figure 4). After 120 h of fermentation, we observed reduction of starch ranging from 1213.9 to 325.1 mg/100 g DM (73.2%) in the Kutukutu fermented with L. fermentum N33. The hydrolysis of starch by the LAB during fermentation reduces swelling of the starch granules and viscosity of the flours during the preparation of porridge [37]. The decrease of starch content in Kutukutu during fermentation could be due to the hydrolysis of starch due to amylases produced by the LAB into simple sugars [36]. Agati et al. [38] showed that LAB isolated from fermented maize could have a strong amylolytic activity. Hama et al. [39] showed a decrease of starch from 65.6 to 23.6 g/100 g (64.0%) after 72 h of spontaneous fermentation of Dégué.
Figure 4.
Evolution of the starch content in the Kutukutu during fermentation by the various LAB at 25°C (T0 = control; G11 = L. brevis G11; G25 = L. brevis G25; A6 = L. plantarum A6; M11 = L. buchneri M1; M41 = L. cellobiosus M41; N33 = L. fermentum N33; N25 = L. fermentum N25).
3.5. Crude Proteins Content
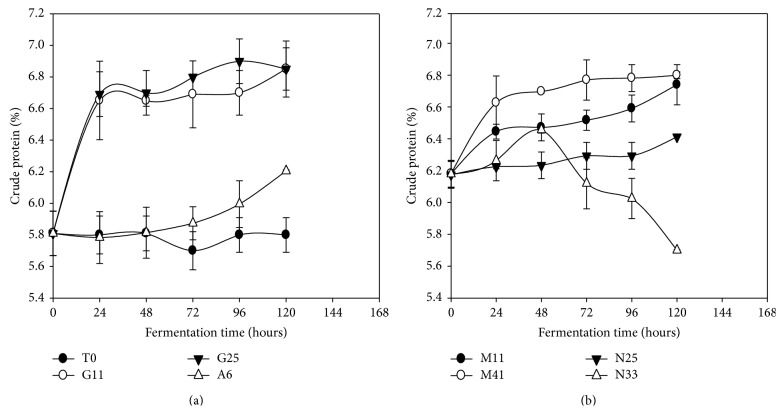
A slight increase of the crude proteins content was observed during the fermentation of Kutukutu with all selected strains excepted for L. fermentum N33 (Figure 5). After 120 h of fermentation, crude proteins content in Kutukutu fermented with L. brevis G11, L. brevis G25, and L. cellobiosus M41 increased from 5.8 to 6.9 g/100 g DM (18.9%) for each one. However, L. fermentum N33 has a different behavior from the other bacteria. Initially, an increase in proteins content ranging from 5.8 to 6.3 g/100 g DM (8.6%) was observed after 48 h of fermentation, followed by a drop from 6.3 to 5.0 g/100 g DM (20%) after 120 h of fermentation.
Figure 5.
Evolution of the crude proteins content in Kutukutu during fermentation by the various LAB at 25°C (T0 = control; G11 = L. brevis G11; G25 = L. brevis G25; A6 = L. plantarum A6; M11 = L. buchneri M1; M41 = L. cellobiosus M41; N33 = L. fermentum N33; N25 = L. fermentum N25).
The increase of crude proteins content could be attributed to the use of carbohydrates by LAB [35]. These results are in agreement with those of Awade et al. [40], who showed an increase in crude proteins content by 14.63% after 14 h of fermentation of corn flour.
However the decrease in proteins content observed in L. fermentum N33 fermented Kutukutu may be explained by the fact that the LAB used these proteins for their metabolic activities during fermentation [41]. Osman [35] observed a similar reduction of protein content by 4.5% after 20 h of fermentation of millet flour at 30°C.
3.6. Minerals Availability
During the fermentation of Kutukutu, a significant increase (P < 0.05) in minerals was observed (Table 2), but minerals content was different between all the tested bacteria strains. The highest content of Mg, Fe, and Na was registered in Kutukutu fermented with L. brevis G25 varying between 25.9 and 39 mg/100 g DM (50.5%), 9.2 and 15.7 mg/100 g DM (70.6%), and 1.2 and 1.3 mg/100 g DM (8.3%), respectively. There was also an increase in the K and P from 82.6 to 118.8 mg/100 g DM (43.8%) and from 95.1 to 138.1 mg/100 g DM (45.2%), respectively, in Kutukutu fermented with L. brevis G11. L. fermentum N33 and L. brevis G25 increased the Zn content in Kutukutu with values ranging from 1.1 to 1.3 mg/100 g DM (18.2%). L. brevis G25, L. brevis G11, and L. buchneri increased the Cu content in Kutukutu from 0.1 to 0.2 mg/100 g DM (100%), while only L. brevis G25 and L. brevis G11 increased the Mn content in Kutukutu from 0.2 to 0.4 mg/100 g DM (100%). The increment in minerals could be explained by the reduction of antinutritional substances such as phytates and phenolic compounds which form complexes with minerals [10, 42]. Eltayeb et al. [43] observed an increase of Fe and Zn from 5.8 to 5.9 mg/100 g and from 2.9 to 3 mg/100 g, respectively, in fermented millet flour of “Garira” variety after 24 h of spontaneous fermentation at 37°C. They also noticed an increase in P, Zn, and Fe content from 183.4 to 205.3 mg/100 g, 2.9 to 3.1 mg/100 g, and 6.5 to 10.2 mg/100 g, respectively, in the fermented millet flour variety “Gadarif” after 12 h of fermentation at 37°C [43].
Table 2.
Total minerals content in Kutukutu fermented with various LAB at 25°C after 120 h.
| LAB | Time (hours) | Macronutrients (mg/100 g DM) | Micronutrients (mg/100 g DM) | |||||||
|---|---|---|---|---|---|---|---|---|---|---|
| Ca | Mg | K | Na | P | Zn | Cu | Mn | Fe | ||
| 0 | 1.2 ± 0.0 | 25.9 ± 0.1 a | 82.6 ± 0.0 a | 1.2 ± 0.0 c | 95.1 ± 0.0 a | 1.1 ± 0.0 b | 0.1 ± 0.0 a | 0.2 ± 0.0 a | 9.2 ± 0.0 a | |
|
| ||||||||||
| G11 | 120 | 1.2 ± 0.0a | 33.6 ± 0.1d | 118.9 ± 8.1e | 0.5 ± 0.0a | 138.1 ± 0.0b | 1.2 ± 0.0cd | 0.2 ± 0.0b | 0.4 ± 0.0c | 12.9 ± 0.1e |
| G25 | 1.2 ± 0.0a | 39.0 ± 2.2e | 102.1 ± 0.0bc | 1.3 ± 0.1c | 110.7 ± 0.0c | 1.3 ± 0.0e | 0.2 ± 0.0b | 0.4 ± 0.0c | 15.7 ± 0.0g | |
| A6 | 1.2 ± 0.0a | 33.8 ± 1.1d | 112.1 ± 0.6d | 0.8 ± 0.5b | 132.4 ± 0.1d | 1.2 ± 0.0cd | 0.1 ± 0.0a | 0.2 ± 0.0a | 12.4 ± 0.0d | |
| M11 | 1.2 ± 0.0a | 34.1 ± 1.1d | 106.6 ± 2.1c | 0.5 ± 0.1a | 131.0 ± 1.0e | 1.1 ± 0.0bc | 0.2 ± 0.0b | 0.3 ± 0.0b | 11.7 ± 0.1c | |
| M41 | 1.2 ± 0.0a | 31.7 ± 0.2c | 105.1 ± 0.1c | 0.4 ± 0.0a | 118.9 ± 0.1f | 1.0 ± 0.0a | 0.1 ± 0.0a | 0.2 ± 0.0a | 14.8 ± 0.0f | |
| N25 | 1.2 ± 0.0a | 31.1 ± 0.4c | 98.1 ± 0.1b | 0.8 ± 0.0b | 100.5 ± 0.5g | 1.2 ± 0.0d | 0.1 ± 0.0a | 0.1 ± 0.0a | 12.4 ± 0.0d | |
| N33 | 1.2 ± 0.0a | 28.0 ± 0.1b | 86.0 ± 0.0a | 0.8 ± 0.0b | 114.3 ± 0.6h | 1.3 ± 0.0e | 0.1 ± 0.0a | 0.1 ± 0.0a | 12.1 ± 0.0b | |
The values followed by the same letter on the same column are not significantly different (P > 0.05).
3.7. Total Polyphenols
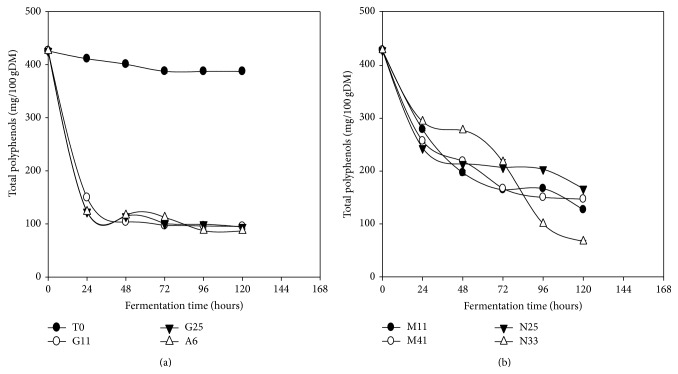
The evolution of total polyphenols content in Kutukutu during fermentation is shown in Figure 6. After 120 h of fermentation, the total polyphenols content was reduced from 425.8 to 66.3 mg/100g DM (84.5%) and from 425.8 to 86.8 mg/100g DM in the Kutukutu fermented with L. fermentum N33 and L. plantarum A6, respectively. The reduction in polyphenols content during fermentation could be attributed to the production of polyphenol oxidases by LAB [40]. Many studies on the improvement of nutritional quality of fermented grains such as millet showed a significant reduction of the levels of polyphenols [44, 45]. Adam et al. [46] observed a reduction in polyphenols content ranging from 120.4 to 111.08 mg/100 g and from 125.1 to 107.2 mg/100 g, respectively, in millet cultivar “Ugandi” and “Dembi yellow” after 14 h of fermentation at 37°C.
Figure 6.
Evolution of total polyphenols in Kutukutu during fermentation by the various LAB at 25°C (T0 = control; G11 = L. brevis G11; G25 = L. brevis G25; A6 = L. plantarum A6; M11 = L. buchneri M1; M41 = L. cellobiosus M41; N33 = L. fermentum N33; N25 = L. fermentum N25).
3.8. Tannins
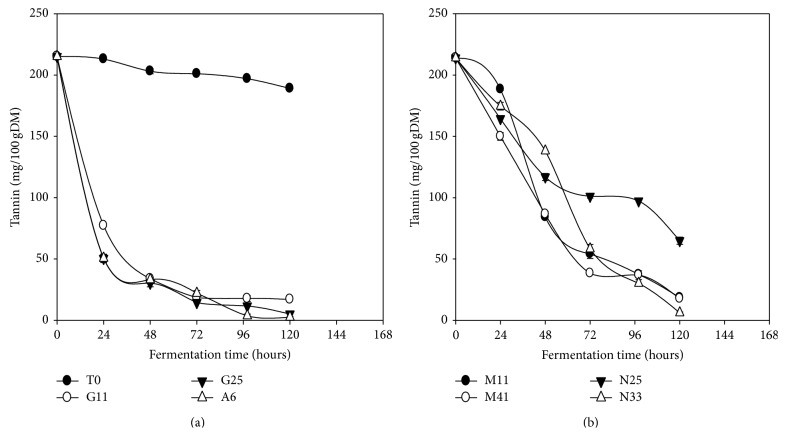
Tannins content was reduced significantly (P < 0.05) during the fermentation of Kutukutu compared to the control (Figure 7). L. plantarum A6 and L. fermentum N33 reduced the tannins content in Kutukutu from 215.1 to 2.5 mg/100 g DM (98.8%) and 215.1 to 4.6 mg/100 g DM (97.9%), respectively, after 120 h of fermentation. Indeed, some LAB such as L. plantarum, L. pentosus, and L. paraplantarum are able to degrade tannins through their acylhydrolase tannin activity [47]. This ability is often associated with the vegetable products and confers an ecological advantage to the LAB [47]. Antony and Chandra [48] showed 52% reduction of tannins in millet flour during fermentation. In the same way Onyango et al. [49] reported a significant (P < 0.05) reduction of tannins content after 8 days of fermentation of red sorghum flour, white sorghum and millet at 25°C.
Figure 7.
Evolution of the tannin content in Kutukutu during fermentation by the various LAB at 25°C (T0 = control; G11 = L. brevis G11; G25 = L. brevis G25; A6 = L. plantarum A6; M11 = L. buchneri M1; M41 = L. cellobiosus M41; N33 = L. fermentum N33; N25 = L. fermentum N25).
3.9. Phytates
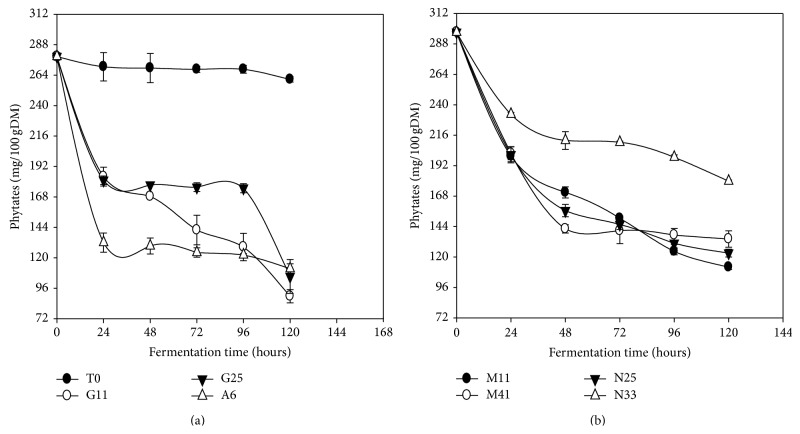
The entire selected LAB reduced the phytates content after 120 h of fermentation (Figure 8). Phytates content in Kutukutu fermented with L. buchneri M11 was reduced from 278.7 to 12.4 mg/100g DM (95.5%). This observed reduction of phytates can be due to phytases and phosphatases produced by LAB which hydrolyze phytates to inositol and orthophosphates [50]. Studies made by Ejigui et al. [50] also illustrated a reduction in phytates levels ranging from 9.87 to 3.8 mg/100 g in corn flour after 96 h of fermentation at 30°C. Similarly, Onyango et al. [49] reported a significant (P < 0.05) reduction of phytates in red sorghum flour, white sorghum, and millet after 8 days of fermentation at room temperature. Cui et al. [51] presented a decrease of phytates to 24.3% in 4 corn cultivars during the fermentation.
Figure 8.
Evolution of phytates content in Kutukutu during fermentation by the various LAB at 25°C (T0 = control; G11 = L. brevis G11; G25 = L. brevis G25; A6 = L. plantarum A6; M11 = L. buchneri M1; M41 = L. cellobiosus M41; N33 = L. fermentum N33; N25 = L. fermentum N25).
4. Principal Component Analysis (PCA)
The variables used to evaluate the improvement of the nutritional quality of Kutukutu with LAB were attached to a principal component analysis (Figure 9). That helped to visualize correlations and to select among the 07 bacteria studied, ones who give the best results. These variables are organized in two principal components which express 79.4% of total variability. The axis F1 explains 47.29% of information and the second axis F2 explains 32.13% of information.
Figure 9.
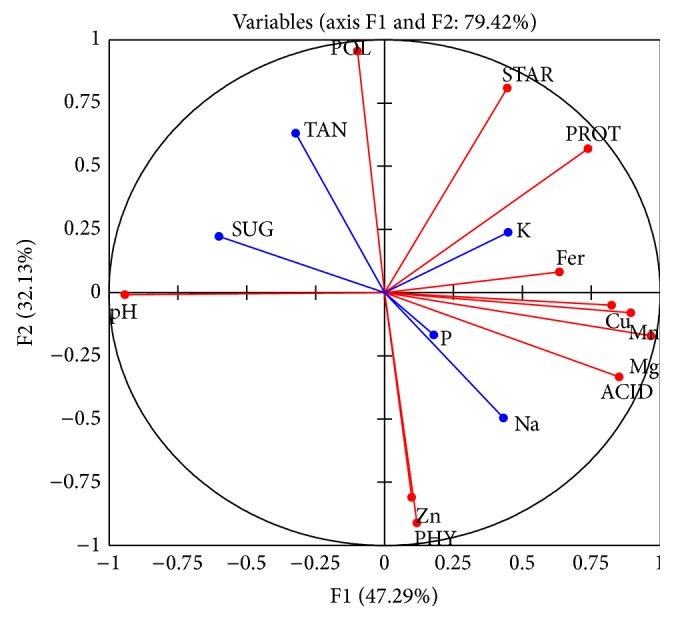
Correlation circle of the variables of Kutukutu in the principal component analysis axis (TAN: tannins; PHY: phytates; POL: polyphenols; PROT: proteins, ACID: lactic acid; STRA: starch; SUG: sugar) analyzed during fermentation of Kutukutu by LAB.
The analysis of the correlations between the different variables and the principal axis shows that the variables such as minerals (Mg (0.95), Mn (0.89), iron (0.63), and Cu (0.82)), proteins (0.73), lactic acid (0.85), and pH (−0.94) contribute significantly to the formation of the F1 axis, while variables such as polyphenols (0.95), phytates (−0.91), starch (0.80), and some minerals like Zn (−0.81) contribute mainly to the formation of the F2 axis. The supplementary variables (reducing sugars (−0.60)) that are classified on the axis F1 also show a significant contribution on this axis.
When LAB are also represented in the axis system F1 × F2 (Figure 10), axis F1 corresponds to the variables induced by L. brevis G25, L. fermentum N25, while the F2 axis variables are induced by L. plantarum A6, L. buchneri M11, L. fermentum N33, and L. cellobiosus M41. However, L. brevis G25 (55.3%) and L. fermentum N33 G25 (33%) are those LAB that contribute most to the formation of this axis system (F1 × F2).
Figure 10.
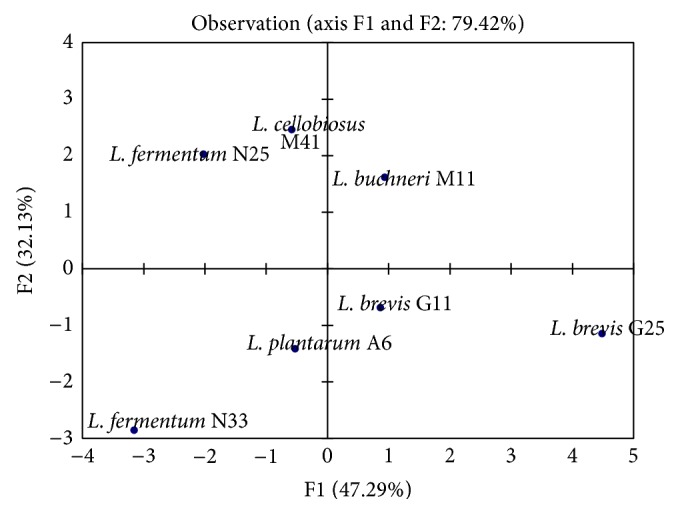
Distribution of LAB selected for the fermentation of Kutukutu on the axis system (F1 × F2).
This arrangement of variables and observations on F1 and F2 axis shows that L. fermentum N33 helps to reduce antinutrients factors such as phytates and polyphenols, while L. brevis G25 contributes to increased bioavailability of minerals (Mg, Mn, Cu, and Fe), lactic acid, and protein contents.
5. Conclusions
The fermentation of the Kutukutu by selected LAB induced many changes in nutritional properties as well as antinutritional factors. L. brevis G25 increased (80.7%) reducing sugars content and increased the proteins content to 18.9%. It also increases availability of Mg and Fe, respectively, to 50.5% and 70.6%. L. plantarum A6 reduced the tannins content to 98.8% in Kutukutu and L. buchneri M11 reduced the phytates content (95.5%) in the Kutukutu, while, for a best reduction of phytates and polyphenols, Kutukutu must be fermented by L. brevis G25. To improve protein content and minerals (Mg, Mn, Cu, and Fe), Kutukutu must be fermented by L. fermentum N33. Both of these bacteria can be used for improving the nutritional quality of Kutukutu during fermentation.
Acknowledgment
Authors are grateful to the University of Ngaoundere (Cameroon) for support in the form of infrastructural facilities made available for undertaking the present study.
Conflict of Interests
The authors declare that there is no conflict of interests regarding the publication of this paper.
References
- 1.Louembé D., Kéléké S., Kobawila S. C., Nzouzi J. P. Bactéries lactiques de la pâte fermentée de maïs au Congo. Tropicultura. 2003;21(1):3–9. [Google Scholar]
- 2.Wakil S. M., Daodu A. A. Physiological properties of a microbial community in spontaneous fermentation of maize (Zea mays) for Ogi production. International Research Journal of Microbiology. 2011;2(3):109–115. [Google Scholar]
- 3.Etoa F. X., Mbofung C. M. V., Ndjouenkeu R. Céréales en Régions Chaudes, AUPELF-UREF. Paris, France: John Libbey Enmtext; 1989. Profil bactériologique du kutukutu à température ambiante; pp. 151–156. [Google Scholar]
- 4.Haydersah J. Etude de la fermentation lactique de plantes amylacées tropicales [Thèse de Doctorat] Université des Antilles et de la Guyane; 2010. [Google Scholar]
- 5.Nyamen T. Unité de fabrication d'aliment de sevrage au Cameroun. Agridoc. 2003:p. 6. [Google Scholar]
- 6.Alka S., Neelam Y., Shruti S. Effect of fermentation on physicochemical properties & in vitro starch and protein digestibility of selected cereals. International Journal of Agriculture and Food Science. 2012;2(3):66–70. [Google Scholar]
- 7.Muyanja C., Birungi S., Ahimbisibwe M., Semanda J., Namugumya B. S. Traditional processing, microbial and physicochemical changes during fermentation of malwa. African Journal of Food, Agriculture, Nutrition and Development. 2010;10(10):4124–4128. doi: 10.4314/ajfand.v10i10.62891. [DOI] [Google Scholar]
- 8.Olusegun A. O., Iniobong G. N. Spoilage and preservation of meat: a general approsial and potential of LAB as biological preservations. International Journal of Biotechnology. 2011;2:33–46. [Google Scholar]
- 9.Opere B., Aboaba O. O., Ugoji E. O., Iwalokun B. A. Estimation of nutritive value, organoleptic properties and consumer acceptability of fermented cereal gruel (OGI) Advance Journal of Food Science and Technology. 2012;4(1):1–8. [Google Scholar]
- 10.Songré-Ouattara L. T., Mouquet-Rivier C., Icard-Vernière C., Humblot C., Diawara B., Guyot J. P. Enzyme activities of lactic acid bacteria from a pearl millet fermented gruel (ben-saalga) of functional interest in nutrition. International Journal of Food Microbiology. 2008;128(2):395–400. doi: 10.1016/j.ijfoodmicro.2008.09.004. [DOI] [PubMed] [Google Scholar]
- 11.Yao A. A., Egounlety M., Kouame L. P., Thonart P. Les bactéries lactiques dans les aliments ou boissons amylacés et fermentés de l’Afrique de l’Ouest : leur utilisation actuelle. Annales de Médecine Vétérinaire. 2009;153:54–65. [Google Scholar]
- 12.Oyetayo V. O., Adetuyi F. C., Akinyosoye F. A. Safety and protective effect of Lactobacillus acidophilus and Lactobacillus casei used as probiotic agent in vivo . African Journal of Biotechnology. 2003;2(11):448–452. [Google Scholar]
- 13.Agarray O. O., Nkama I., Akoma O. Production of Kunni zaki (A Nigerian fermented cereal beverage) using starter culture. International Research Journal of Microbiology. 2010;1(2):18–25. [Google Scholar]
- 14.Ogunbanwo S. T., Ogunsanya B. T. Quality assessment of oti-oka like beverage produced from pearl millet. Journal of Applied Biosciences. 2012;51:3608–3617. [Google Scholar]
- 15.Sharma N., Handa S., Gupta A. Comprehensive study of different traditional fermented foods/beverages of himachal pradesh to evaluate their nutrition impact on health and rich biodiversity of fermenting microorganisms. International Journal of Research in Applied Natural and Social Sciences. 2013;1:19–28. [Google Scholar]
- 16.Ogunbanwo S. T., Adewara A. O., Patience T. F. Effect of fermentation by pure cultures of Lactobacillus fermentum I and Saccharomyces cerevisiae as starter cultures in the production of burukutu. New York Science Journal. 2013;6(1):73–81. [Google Scholar]
- 17.Wakil S. M., Ayenuro O. T., Oyinlola K. A. Microbiological and nutritional assessment of starter-developed fermented tigernut milk. Food and Nutrition Sciences. 2014;5(6):495–506. doi: 10.4236/fns.2014.56059. [DOI] [Google Scholar]
- 18.Afoakwa E. O., Sefa-Dedeh S., Budu A. S., Sakyi-Dawson E., Asomaning J. Influence of spontaneous fermentation on some quality characteristics of maize-based cowpea-fortified nixtamalized foods. African Journal of Food Agriculture Nutrition and Development. 2007;7(1):1–18. [Google Scholar]
- 19.Obadina A. O., Oyewole O. B., Sanni L. O., Tomlins K. I., Westby A. Improvement of the hygienic quality of wet ‘fufu’ produced in South West Nigeria. Food Control. 2010;21(5):639–643. doi: 10.1016/j.foodcont.2009.09.009. [DOI] [Google Scholar]
- 20.Fischer E., Stein E. A. DNS colorimetric determination of available carbohydrates in foods. Biochemical Preparation. 1961;8:30–37. [Google Scholar]
- 21.Jarvis C. E., Walker J. R. L. Simultaneous, rapid; spectrophotometric determination of total starch, amylase and amylopectine. Journal of the Science of Food and Agriculture. 1993;63:53–57. doi: 10.1002/jsfa.2740630109. [DOI] [Google Scholar]
- 22.Agence Française de Normalisation (AFNOR) Recueil de normes françaises. Produits agricoles alimentaires: directives générales pour le dosage de l'azote avec minéralisation selon la méthode de Kjedahl. Paris, France: AFNOR; 1984. [Google Scholar]
- 23.Devani M. B., Shishoo J. C., Shal S. A., Suhagia B. N. Spectrophotometrical method for determination of nitrogen in Kjeldahl digest. Journal of the Association of Official Analytical Chemists. 1989;72:953–956. [Google Scholar]
- 24.Benton J., Jones J., Vernon W. C. Sampling, handling and analyzing plant tissue samples. In: Westerman R. L., editor. Soil Testing and Plant Analysis. 3rd. 1990. (SSSA Book Series no. 3). [Google Scholar]
- 25.Murphy J., Riley J. P. A modified single solution method for the determination of phosphate in natural waters. Analytica Chimica Acta. 1962;27:31–36. doi: 10.1016/s0003-2670(00)88444-5. [DOI] [Google Scholar]
- 26.Vaintraub I. A., Lapteva N. A. Colorimetric determination of phytate in unpurified extracts of seeds and the products of their processing. Analytical Biochemistry. 1988;175(1):227–230. doi: 10.1016/0003-2697(88)90382-X. [DOI] [PubMed] [Google Scholar]
- 27.Gao Y., Shang C., Maroof M. A. S., et al. A modified colorimetric method for phytic acid analysis in soybean. Crop Science. 2007;47(5):1797–1803. doi: 10.2135/cropsci2007.03.0122. [DOI] [Google Scholar]
- 28.Marigo G. Sur une méthode de fractionnement et d'estimation des composés phénoliques chez les végétaux. Analusis. 1973;2:106–110. [Google Scholar]
- 29.Ali A. A., Mustafa M. M. Use of starter cultures of lactic acid bacteria and yeasts in the preparation of kisra, a Sudanese fermented food. Pakistan Journal of Nutrition. 2009;8(9):1349–1353. doi: 10.3923/pjn.2009.1349.1353. [DOI] [Google Scholar]
- 30.Jay M. J., Loessner M. J., Golden A. D. Modern Food Microbiology. 7th. New York, NY, USA: Springer Science and Business Media; 2005. [Google Scholar]
- 31.Tomkins A., Alnwick D., Haggerty P. Pour améliorer l'alimentation des jeunes enfants en Afrique orientale et australe: une technologie a la portée des ménages. Ontario, Canada: IDRG-256f; 1989. L'emploi des produits ferment& pour l'alimentation des enfants d'Afrique australe et orientale; pp. 156–192. [Google Scholar]
- 32.Mensah P., Tomkins A. M., Drasar B. S., Harrison T. J. Antimicrobial effect of fermented Ghanaian maize dough. Journal of Applied Bacteriology. 1991;70(3):203–210. doi: 10.1111/j.1365-2672.1991.tb02925.x. [DOI] [PubMed] [Google Scholar]
- 33.Wedad W., Abdelhaleem H., El Tinay A. H., Mustafa A. I., Babiker E. E. Effect of fermentation, malt-pretreatment and cooking on antinutritional factors and protein digestibility of sorghum cultivars. Pakistan Journal of Nutrition. 2008;7(2):335–341. doi: 10.3923/pjn.2008.335.341. [DOI] [Google Scholar]
- 34.Hounhouigan D. J., Nout M. J. R., Nago C. M., Houben J. H., Rombouts F. M. Changes in the physico-chemical properties of maize during natural fermentation of mawè. Journal of Cereal Science. 1993;17(3):291–300. doi: 10.1006/jcrs.1993.1027. [DOI] [Google Scholar]
- 35.Osman M. A. Effect of traditional fermentation process on the nutrient and antinutrient contents of pearl millet during preparation of Lohoh. Journal of the Saudi Society of Agricultural Sciences. 2011;10(1):1–6. doi: 10.1016/j.jssas.2010.06.001. [DOI] [Google Scholar]
- 36.Rojan P. J., Nampoothiri K. M., Nair A. S., Pandey A. L(+)-lactic acid production using Lactobacillus casei in solid-state fermentation. Biotechnology Letters. 2005;27(21):1685–1688. doi: 10.1007/s10529-005-2731-8. [DOI] [PubMed] [Google Scholar]
- 37.Asnwortn A., Draper A. The Potential of Traditional Technologies for Increasing the Energy Density of Weaning Foods. London, UK: Center for Human Nutrition; 1990. [Google Scholar]
- 38.Agati V., Guyot J. P., Morlon-Guyot J., Talamond P., Hounhouigan D. J. Isolation and characterization of new amylolytic strains of Lactobacillus fermentum from fermented maize doughs (mawè and ogi) from Benin. Journal of Applied Microbiology. 1998;85(3):512–520. doi: 10.1046/j.1365-2672.1998.853527.x. [DOI] [Google Scholar]
- 39.Hama F., Savadogo A., Ouattara C. A. T., Traore A. S. Biochemical, microbial and processing study of Dèguè a fermented food (from pearl millet dough) from Burkina Faso. Pakistan Journal of Nutrition. 2009;8(6):759–764. doi: 10.3923/pjn.2009.759.764. [DOI] [Google Scholar]
- 40.Awada S. H., Abedel H., Hassan A. B., Ali M. I., Babiker E. E. Antinutritional factors content and availability of protein, starch and mineral of maize (Zeamays linnaus) and lentil (Lens culinaris) as influenced by domestic processing. Journal of Food Technology. 2005;3(4):523–528. [Google Scholar]
- 41.Elenga M., Massamba J., Kobawila S. C., Makosso V. G., Silou T. Evaluation et amélioration de la qualité nutritionnelle des pâtes et des bouillies de maïs fermenté au Congo. International Journal of Biological and Chemical Sciences. 2010;3(6):1274–1285. doi: 10.4314/ijbcs.v3i6.53146. [DOI] [Google Scholar]
- 42.Rodríguez H., Curiel J. A., Landete J. M., et al. Food phenolics and lactic acid bacteria. International Journal of Food Microbiology. 2009;132(2-3):79–90. doi: 10.1016/j.ijfoodmicro.2009.03.025. [DOI] [PubMed] [Google Scholar]
- 43.Eltayeb M. M., Hassan A. B., Mohamed G. A., Babiker E. E. Effect of processing followed by fermentation on HCl extractability of Ca, P, Fe and Zn of pearl millet (Pennisetum glaucum L.) cultivars. International Journal of Agricultural Research. 2008;3(5):349–356. doi: 10.3923/ijar.2008.349.356. [DOI] [Google Scholar]
- 44.Elyas S. H. A., El Tinay A. H., Yousif N. E., Elsheikh E. A. E. Effect of natural fermentation on nutritive value and in vitro protein digestibility of pearl millet. Journal of Food Chemistry. 2002;78(1):75–79. doi: 10.1016/s0308-8146(01)00386-7. [DOI] [Google Scholar]
- 45.Tou E. H., Guyot J. P., Mouquet-Rivier C., et al. Study through surveys and fermentation kinetics of the traditional processing of pearl millet (Pennisetum glaucum) into ben-saalga, a fermented gruel from Burkina Faso. International Journal of Food Microbiology. 2006;106(1):52–60. doi: 10.1016/j.ijfoodmicro.2005.05.010. [DOI] [PubMed] [Google Scholar]
- 46.Adam I. A., Abdalla A. A., Khalid A. I., El-Tinay A. H. Effect of traditional processing on phosphorus content and some anti nutritional factors of pearl millet (Pennisetum glaucum L.) Research Journal of Agriculture and Biological Sciences. 2010;6(3):176–180. [Google Scholar]
- 47.Osawa R., Kuroiso K., Goto S., Shimizu A. Isolation of tannin-degrading lactobacilli from humans and fermented foods. Applied and Environmental Microbiology. 2000;66(7):3093–3097. doi: 10.1128/AEM.66.7.3093-3097.2000. [DOI] [PMC free article] [PubMed] [Google Scholar]
- 48.Antony U., Chandra T. S. Antinutrient reduction and enhancement in protein, starch, and mineral availability in fermented flour of finger millet (Eleusine coracana) Journal of Agricultural and Food Chemistry. 1998;46(7):2578–2582. doi: 10.1021/jf9706639. [DOI] [Google Scholar]
- 49.Onyango C. A., Ochanda S. O., Mwasaru M. A., Ochieng J. K., Mathooko F. M., Kinyuru J. N. Effects of malting and fermentation on anti-nutrient reduction and protein digestibility of red sorghum, white sorghum and pearl millet. Journal of Food Research. 2013;2(1):41–49. doi: 10.5539/jfr.v2n1p41. [DOI] [Google Scholar]
- 50.Ejigui J., Savoie L., Marin J., Desrosiers T. Beneficial changes and drawbacks of a traditional fermentation process on chemical composition and antinutritional factors of yellow maize (Zea mays) Journal of Biological Sciences. 2005;5(5):590–596. doi: 10.3923/jbs.2005.590.596. [DOI] [Google Scholar]
- 51.Cui L., Li D.-J., Liu C.-Q. Effect of fermentation on the nutritive value of maize. International Journal of Food Science & Technology. 2012;47(4):755–760. doi: 10.1111/j.1365-2621.2011.02904.x. [DOI] [Google Scholar]


