Abstract
Replica exchange molecular dynamics has emerged as a powerful tool for efficiently sampling free energy landscapes for conformational and chemical transitions. However, daunting challenges remain in efficiently getting such simulations to scale to the very large number of replicas required to address problems in state spaces beyond two dimensions. The development of enabling technology to carry out such simulations is in its infancy, and thus it remains an open question as to which applications demand extension into higher dimensions. In the present work, we explore this problem space by applying asynchronous Hamiltonian replica exchange molecular dynamics with a combined quantum mechanical/molecular mechanical potential to explore the conformational space for a simpleribonucleoside , using a newly developed software framework capable of executing >3,000 replicas with only enough resources to run 2,000 simultaneously, which may not be possible with traditional synchronous replica exchange approaches.
Our results demonstrate 1.) the necessity of high dimensional sampling simulations for biological systems, even as simple as as a single ribonucleoside, 2.) the utility of asynchronous exchange protocols in managing simultaneous resource requirements expected in high dimensional sampling simulations. It is expected that more complicated systems will only increase in computational demand and complexity and thus the reported asynchronous approach may be increasingly beneficial in order to make such applications available to a broad range of computational scientists.
1 Introduction
In the past few decades replica exchange molecular dynamics (REMD) has become one of the primary tools with which to improve the accuracy and efficiency of molecular simulations. 1 Examples of REMD now encompass a broad class of schemes ranging from temperature (including novel integration approaches), 2 to Hamiltonian (including alchemical and coordinate biasing) 3 and pH spaces, 4 as well as multidimensional combinations thereof. 5
Nevertheless, the computational resource requirements of multidimensional replica exchange simulations quickly becomes unattainable. This is because the replica count generally increases as ND , where N is the number of replicas per dimension, D. For traditional synchronous replica exchange schemes, this implies that at least ND sets of CPUs must be available simultaneously. For example, it would be impossible to perform a synchronous replica exchange simulation with 3,000 replicas while only 2,000 CPUs are available at any time.
A common approach is to avoid directly tackling a multidimensional problem by approximating it as several independent low dimensional problems in order to reduce the number of replicas needed. A typical example is the free energy profiles defined in multidimensional conformational spaces. While it is apparently necessary to search in a multidimensional conformational space to appropriately identify the transition paths, usually only one or two a priori progress variables are defined when constructing the relevant free energy profiles. This approach clearly assumes a priori knowledge of the progress variables and could thus be problematic if other hidden variables interfere. This potential difficulty is seemingly obvious, yet has not been demonstrated by a reported multidimensional simulation to date; this is likely because such simulations are difficult to perform in the first place. As a result, it is still a common practice to use one- or two-dimensional replica exchange simulations even in a multidimensional environment.
Herein we present results from multidimensional replica exchange umbrella sampling (REUS) simulations of a single uracil ribonucleoside, applying localized biasing potentials to the key geometric coordinates that dictate the conformation of the ribose ring of the sugar-phosphate backbone (i.e. sugar pucker coordinates), and the orientation of the nucleobase about the glycosidic bond (i.e. χ torsion angle). The results are used to reconstruct the conformational free energy landscape that reveals a complex topology with a large number of minima subtly connected by correlated pathways.
The core of this letter is to demonstrate the exploration of 3D free energy profiles of a simple yet realistic biological system, where the correlations between three conformation variables are non-obvious a priori and non-trivial (or impossible) to recapitulate from lower dimensional surfaces. The lower dimensional surfaces display significant artifacts and bias toward lower energy states, even when the higher energy states should be appreciably populated and/or have biological relevance. Although the large number of replicas (3432) in this simulation represent a considerable expense, this is clearly justified in order to correctly characterize the targeted processes.
In addition, we demonstrate that multidimensional replica exchange simulations with a large number of replicas, on the order of 103 replicas or more, can be handled through an asynchronous replica exchange framework, even with a limited computational resource. The software is agnostic to the underlying molecular dynamics (MD) engine but is demonstrated here with the AMBER 6 package in order to utilize recent developments in quantum mechanical/molecular mechanical (QM/MM) models for accurately modeling sugar puckering modes. 7,8 Taken together, the present work provides compelling support for the need to address free energy problems within a multidimensional framework, produces benchmark simulation results for the conformational free energy landscape of a fundamental nucleic acid building block, and demonstrates that asynchronous exchange is a promising route for taking on this challenge.
2 Computational Methods
2.1 Molecular Dynamics
Each replica was realized as an instance of AMBER 14 6 describing a single, neutral uracil ribonucleoside solvated in a truncated octahedron composed of 1735 TIP4P-Ew rigid water molecules 9 and using periodic boundary conditions with the particle mesh Ewald method. 10 The QM region (uracil) was described by the AM1/d-PhoT Hamiltonian 7 along with a recently developed sugar pucker correction 8 and Lennard-Jones parameters from the AMBER force field. 11 Langevin dynamics was performed at 300 K with a friction coefficient of 5 ps− and a 1 fs time step.
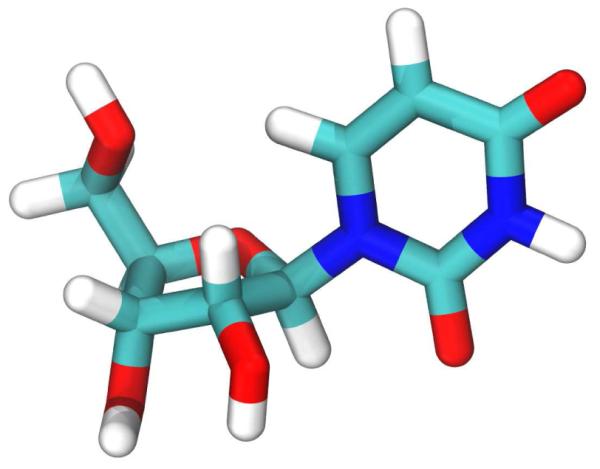
Replicas were defined by three separate harmonic biases on the χ and ν1/ν3 at 30° and 10° intervals, respectively (see fig. 1). This coordinate basis has been shown to be convenient for applying stable, well-defined constraints in quantum chemical calculations, while an alternate basis using linear combinations produces coordinates more recognizably aligned with traditional sugar pucker coordinates. 8 Although 3,432 replicas were run in total, the full simulation used only 2,000 CPU cores on the Stampede cluster at the Texas Advanced Computing Center. In aggregate, >100 ns of simulation were produced roughly uniformly amongst the replicas, with each replica cycle (i.e. the time between exchange attempts) consisting of 500 fs. Thus, each individual replica ran for ~30 ps with ~60 chances to exchange. Although 30 ps is not very long but should be enough to average out most of fast motion modes as the main conformational variables are constrained via umbrella biasing potentials.
Figure 1.

Schematic of dihedral angles used as bias coordinates during umbrella sampling. The proper dihedrals ν1 and ν3 are more recognizable as traditional sugar puckering coordinates when taken as the linear combinations Zx and Zy as described in Ref. 8 (inset).
2.2 Asynchronous Replica Exchange
It is important to describe the different modes of synchronicity. In the present algorithm, both the MD and exchange protocols are asynchronous across replicas. 12 That is, these processes occur for different replicas at different times and never for all replicas at all times (a replica can run MD or exchange, but not both). However, the initiation of these processes is executed synchronously. That is, the controlling process concertedly submits replicas for MD and then coordinates exchanges amongst those that are not running. Since the latter process can be increasingly time consuming at large replica counts, we find it useful to oversubscribe replicas so that resources are taken up as they become available, even if the main process is busy coordinating exchanges.
Finally, although conventional nearest neighbor-type exchange schemes require that all replicas be available for exchange at all times, the protocol here requires the exact opposite scenario. Such an approach is a straightforward extension of recently reported algorithms which view the exchange protocol not as a pairwise procedure, but rather as a direct sampling of replica permutations. 13,14 Briefly, this requires computing acceptance probabilities of all possible exchanges amongst a group of replicas (i.e. those not performing MD). From these probability weights, the distribution of exchanges between a selected replica and all other replicas can be sampled directly; 14 iterating through the replicas one or more times can lead to an effectively independent sample of all possible replica permutations. 13
The primary conceptual advance underlying our implementation is the decoupling of the replica exchange algorithm details from the execution details of the replicas on high-performance resources. 15 This enables the efficient execution of a range of replica exchange schemes. An early prototype of the software system used for performing current simulations using the current asynchronous protocol has been described in Ref. 12. Significant performance enhancements and improvements continue to be made; these enhancements and updated software are (and will be) publicly available online. 16
3 Results and Discussion
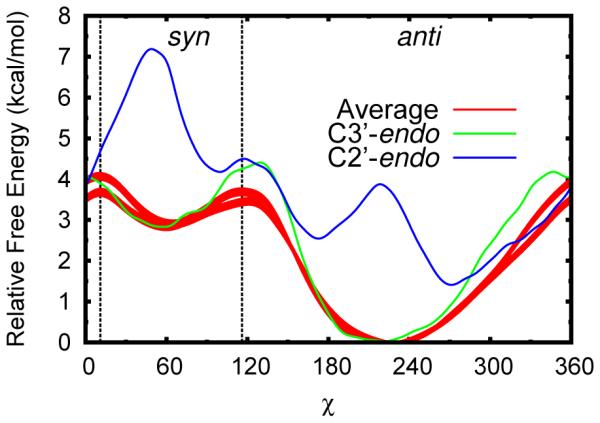
Umbrella sampling simulations in multiple dimensions are considerably complex, and analysis of the data required to construct a free energy manifold must be done carefully. We apply the multistate Bennett acceptance ratio 17 (MBAR) method in tandem with a three-dimensional Gaussian kernel density estimator (see Ref. 18 for details) along the χ, Zx, and Zy coordinates shown in figs. 1 and 2. Due to the large amount of data and memory restrictions (a full calculation required >20 GB of memory), the data was divided into two non-overlapping sets of states by taking every other χ value (i.e. they are segregated by placement of the biasing potential). These sets are not rigorously statistically independent, 20 but the fact that the results from both data sets along this coordinate agree within statistical error (see fig. 3) provides some degree of confirmation of convergence. For simplicity, in the discussion that follows, data presented after fig. 3 are from only one of these data sets.
Figure 2.
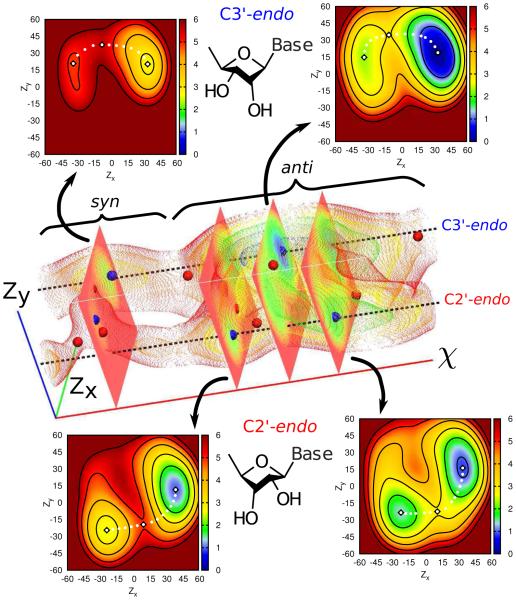
Three-dimensional free energy manifold for solvated uracil along the Zx, Zy, and χ coordinates (see 1). Cross-sections in the Zx,Zy-plane are shown for multiple local minima (blue spheres) and indicate that many minima are connected out-of-plane by one or more saddle points (red spheres). Energies are in kcal/mol and axes are in degrees.
Figure 3.

Free energy profiles for solvated uracil along its χ torsion using multiple schemes to reduce dimensionality. The whole data set can be used by taking the Boltzmann weighted average for all sugar pucker values (red, two curves corresponding to two statistically equivalent data sets with 95% confidence intervals). Conversely, fixed pairs of Zx and Zy can be followed, in this case corresponding to the average C2′-endo (blue) and C3′-endo (green) minima (see 4).
3.1 Low Dimensional Free Energy Profiles Give Inadequate Representations
A general assumption used in the analysis of data from free energy simulations is that all degrees of freedom orthogonal to the chosen coordinate(s) are not strongly coupled to the process under investigation. If this is not true, significant artifacts can be encountered in the interpretation of the results. Generally it is assumed that the conformational states of a nucleoside can be enumerated as four discrete states based on a binary distinction between the sugar pucker mode (C3′ -endo or C2′ -endo) and the nucleobase orientation (syn or anti). A weak coupling between the coordinates connecting these states would imply that transitions between states are affected by, but do not directly involve, the orthogonal coordinate(s).
As an example, consider the univariate free energy profile obtained from the process of rotating the χ torsion between the syn and anti conformations (fig. 3), red filled curves). The average result, obtained from sampling in all possible states, is to be contrasted with those obtained in a localized sugar puckering mode, comparable to sample sets in which the sugar puckering mode never changes (fig. 3, blue and green curves). It is evident, even from brief inspection of fig. 3, that the one-dimensional chi profile depends considerably on the sugar pucker state. However, the average profile is dominated by contributions from the lower energy (by <2 kcal/mol) C3′-endo state, as borne out by the high degree of similarity between these two curves (fig. 3, red and green lines). The profile from the higher energy, but still significant, C2′-endo state has very different minima and maxima, and splits the main anti basin into two states that are nearly energetically degenerate.
Thus, straightforwardly averaging along the single χ degree of freedom clearly removes a considerable amount of information from the full free energy profile. This may be considerably problematic, as the energetically low lying, but geometrically different, states in a C2′-endo sugar pucker could be of significant interest when studying larger questions concerning RNA conformation. Also of note is that the relative shifts between the pucker-dependent χ profiles cannot be determined from separate simulations in those sugar pucker modes alone. This information is only available here because the sugar pucker coordinates were extensively sampled and connected by (and subsequently extracted from) a three-dimensional free energy manifold. Obtaining the two profiles separately could lead to erroneous interpretation.
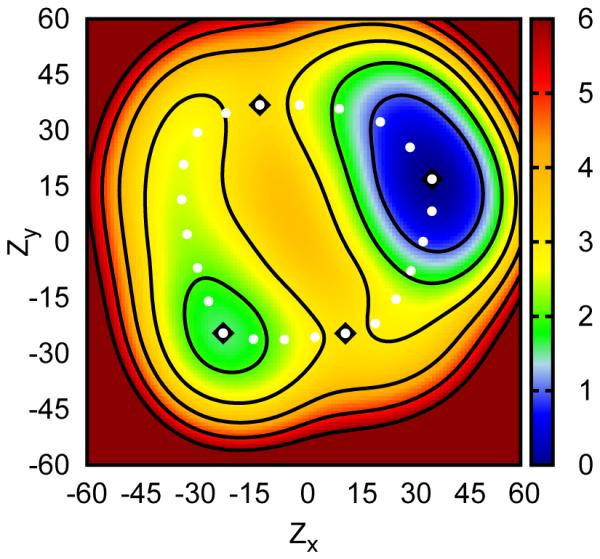
A similar situation is encountered when analyzing the two-dimensional profile for sugar pucker coordinates alone. In this case the average profile contains two minima broadly recognizable as C2′-endo and C3′-endo states. These minima are connected by two transition states in a periodic fashion along the pseudorotation angle (fig. 4). However, as above, these minima and transition states only describe the full transformations in a coarse sense. If multiple two-dimensional surfaces are obtained departing from a specific conformation for the orthogonal χ coordinate (and subsequently not visiting other conformations within the time scale of the simulations), this average surface would look quite different. This is because the syn states, while clearly of interest in larger nucleic acid systems, are high enough in energy that their contributions to the sugar pucker profiles are small compared to the anti states.
Figure 4.

Boltzmann weighted average free energy surface for solvated uracil along the Zx and Zy sugar pucker coordinates (see 1). Two minima are observed roughly corresponding to C3′-endo and C2′-endo pucker states (black diamonds, also marking saddle points). An apparently periodic transition between these states along the pseudorotation angle is also observed (white dots). Energies are in kcal/mol and axes are in degrees.
3.2 Three-Dimensional Free Energy Manifold Unveils “Hidden” Pathways
Lastly, the complete results for a three-dimensional free energy manifold for a ribonucleoside are discussed in detail. The most distinctive (and perhaps most unexpected) result is the presence of five, not four, stable minima in the complete coordinate space (fig. 2, blue spheres). is the presence of five, not four, stable minima in the complete coordinate space (fig. 2, blue spheres). This is because there are two anti /C2′-endo states, where only one might be expected based on a binary segregation of conformations. Interestingly, both of these degenerate minima are directly accessible from the anti /C3′-endo global minimum, but via different transition states (fig. 2, red spheres). Furthermore, in order to reach a true minimum, all of these transitions require motion in both the sugar pucker and χ coordinates and in potentially different orders. For example, the global minimum (anti /C3′-endo) can transition to the next lowest energy minimum (anti /C3′-endo) either by a rotation in χ followed by a pseudorotation of the ring or vice versa.
An aspect of the free energy analysis that is meant to be especially emphasized here is that the extra “hidden” minimum and the accompanying pathways are not at all evident from the low dimensional analysis described above. Proper identification and characterization of the conformational transitions can only be performed with an exhaustive search of the collective coordinate spaces. The alternative is to make the, in this instance, quite incorrect assumption that these coordinates are uncorrelated. In general then, an attractive strategy is to expand the dimensionality of the coordinate search and determine uncorrelated degrees of freedom a posteriori. Since the only significant drawback to this approach is the potentially immense cost increase (in terms of processor hours), techniques that decrease that cost are of significant value. The asynchronous protocol described and used here provides such a tool for performing multidimensional replica exchanges with only limited computational resources available and in future work will be extended and optimized for load balancing and multiple resource management.
4 Conclusion
REMD simulations are potentially powerful tools for improving the accuracy of molecular simulations. Nevertheless, low dimensional REMD simulations for a fundamentally simple nucleic acid system, a single uracil ribonucleoside, are seen to provide an incomplete and hence potentially problematic picture of the free energy landscape. Moving to higher dimensions reveals subtle correlations between the fundamental nucleic acid backbone and base orientation coordinates. The significant additional cost due to this multidimensional simulation is addressed by an asynchronous exchange framework, which provides a general approach for tackling multidimensional REMD on arbitrary software platforms. This software tool is readily extendable to other problems of conformational transitions as well as those addressing chemical reactions.
Acknowledgement
The authors are grateful for financial support provided by the National Science Foundation (CHE-1125332 to DMY and SJ) and National Institutes of Health (GM62248 to DMY). Computational resources were made available by the Extreme Science and Engineering Discovery Environment (TACC and SDSC, TG-MCB110101 to DMY, TG-CHE100072 and TG-MCB090174 to SJ). BKR also acknowledges additional computational resources from a Peter Kollman Graduate Award in Supercomputing through the American Chemical Society Division of Computers in Chemistry and the National Institute for Computational Sciences.
Notes and References
- 1.(a) Lei H, Duan Y. Curr. Opin. Struct. Biol. 2007;17:187–191. doi: 10.1016/j.sbi.2007.03.003. [DOI] [PubMed] [Google Scholar]; (b) Mitsutake A, Mori Y, Okamoto Y. Methods Mol. Biol. 2013;924:153–195. doi: 10.1007/978-1-62703-017-5_7. [DOI] [PubMed] [Google Scholar]
- 2.(a) Sugita Y, Okamoto Y. Chem. Phys. Lett. 1999;314:141–151. [Google Scholar]; (b) Gallicchio E, Levy RM. Curr. Opin. Struct. Biol. 2011;21:161–166. doi: 10.1016/j.sbi.2011.01.010. [DOI] [PMC free article] [PubMed] [Google Scholar]; (c) Wu X, Hodoscek M, Brooks BR. J. Chem. Phys. 2012;137:044106. doi: 10.1063/1.4737094. [DOI] [PMC free article] [PubMed] [Google Scholar]
- 3.(a) Fajer M, Swift RV, McCammon JA. J. Comput. Chem. 2009;30:1719–1725. doi: 10.1002/jcc.21285. [DOI] [PMC free article] [PubMed] [Google Scholar]; (b) Jiang W, Hodoscek M, Roux B. J. Chem. Theory Comput. 2009;5:2583–2588. doi: 10.1021/ct900223z. [DOI] [PMC free article] [PubMed] [Google Scholar]; (c) Meng Y, Dashti D, Roitberg AE. J. Chem. Theory Comput. 2011;7:2721–2727. doi: 10.1021/ct200153u. [DOI] [PMC free article] [PubMed] [Google Scholar]; (d) Arrar M, de Oliveira CAF, Fajer M, Sinko W, McCammon JA. J. Chem. Theory Comput. 2013;9:18–23. doi: 10.1021/ct300896h. [DOI] [PMC free article] [PubMed] [Google Scholar]
- 4.(a) Wallace JA, Shen JK. J. Chem. Theory Comput. 2011;7:2617–2629. doi: 10.1021/ct200146j. [DOI] [PMC free article] [PubMed] [Google Scholar]; (b) Itoh SG, Damjanović A, Brooks BR. Proteins. 2011;79:3420–3436. doi: 10.1002/prot.23176. [DOI] [PMC free article] [PubMed] [Google Scholar]; (c) Dashti D, Roitberg A. J. Phys. Chem. B. 2012;116:8805–8811. doi: 10.1021/jp303385x. [DOI] [PMC free article] [PubMed] [Google Scholar]
- 5.(a) Sugita Y, Kitao A, Okamoto Y. J. Chem. Phys. 2000;113:6042–6051. [Google Scholar]; (b) Jiang W, Roux B. J. Chem. Theory Comput. 2010;6:2559–2565. doi: 10.1021/ct1001768. [DOI] [PMC free article] [PubMed] [Google Scholar]; (c) Jiang W, Luo Y, Maragliano L, Roux B. J. Chem. Theory Comput. 2012;8:4672–4680. doi: 10.1021/ct300468g. [DOI] [PubMed] [Google Scholar]; (d) Bergonzo C, Henriksen NM, Roe DR, Swails JM, Roitberg AE, Cheatham TE., III J. Chem. Theory Comput. 2014;10:492–499. doi: 10.1021/ct400862k. [DOI] [PMC free article] [PubMed] [Google Scholar]; (e) Lee J, Miller BT, Damjanović A, Brooks BR. J. Chem. Theory Comput. 2014;10:2738–2750. doi: 10.1021/ct500175m. [DOI] [PMC free article] [PubMed] [Google Scholar]
- 6.Case DA, et al. AMBER 14. University of California, San Francisco; San Francisco, CA: 2014. [Google Scholar]
- 7.Nam K, Cui Q, Gao J, York DM. J. Chem. Theory Comput. 2007;3:486–504. doi: 10.1021/ct6002466. [DOI] [PubMed] [Google Scholar]
- 8.Huang M, Giese TJ, Lee T-S, York DM. J. Chem. Theory Comput. 2014;10:1538–1545. doi: 10.1021/ct401013s. [DOI] [PMC free article] [PubMed] [Google Scholar]
- 9.Horn HW, Swope WC, Pitera JW, Madura JD, Dick TJ, Hura GL, Head-Gordon T. J. Chem. Phys. 2004;120:9665–9678. doi: 10.1063/1.1683075. [DOI] [PubMed] [Google Scholar]
- 10.(a) Darden T, York D, Pedersen L. J. Chem. Phys. 1993;98:10089–10092. [Google Scholar]; (b) Essmann U, Perera L, Berkowitz ML, Darden T, Hsing L, Pedersen LG. J. Chem. Phys. 1995;103:8577–8593. [Google Scholar]; (c) Nam K, Gao J, York DM. J. Chem. Theory Comput. 2005;1:2–13. doi: 10.1021/ct049941i. [DOI] [PubMed] [Google Scholar]; (d) Walker RC, Crowley MF, Case DA. J. Comput. Chem. 2008;29:1019–1031. doi: 10.1002/jcc.20857. [DOI] [PubMed] [Google Scholar]
- 11.Cornell WD, Cieplak P, Bayly CI, Gould IR, Merz KM, Jr., Ferguson DM, Spellmeyer DC, Fox T, Caldwell JW, Kollman PA. J. Am. Chem. Soc. 1995;117:5179–5197. [Google Scholar]
- 12.Radak BK, Romanus M, Gallicchio E, Lee T-S, Weidner O, Deng N-J, He P, Dai W, York DM, Levy RM, Jha S. Proceedings of the Conference on Extreme Science and Engineering Discovery Environment: Gateway to Discovery. 2013;26:1–26. XSEDE ’13. 8. [Google Scholar]
- 13.Chodera JD, Shirts MR. J. Chem. Phys. 2011;135:194110. doi: 10.1063/1.3660669. [DOI] [PubMed] [Google Scholar]
- 14.Itoh SG, Okumura H. J. Chem. Theory Comput. 2013;9:570–581. doi: 10.1021/ct3007919. [DOI] [PubMed] [Google Scholar]
- 15.Thota A, Luckow A, Jha S. Phil. Trans. R. Soc. A. 2011;369:3318–3335. doi: 10.1098/rsta.2011.0151. [DOI] [PubMed] [Google Scholar]
- 16.RepEx [Online] http://radical-cybertools.github.io/RepEx (accessed August 2014)
- 17.(a) Shirts MR, Chodera JD. J. Chem. Phys. 2008;129:124105. doi: 10.1063/1.2978177. [DOI] [PMC free article] [PubMed] [Google Scholar]; (b) Chodera JD, Shirts MR, Beauchamp KA. pymbar [Online], version 2.1.0. https://github.com/choderalab/pymbar (accessed July 2014)
- 18.Radak BK, Harris ME, York DM. J. Phys. Chem. B. 2013;117:94–103. doi: 10.1021/jp3084277. [DOI] [PMC free article] [PubMed] [Google Scholar]
- 19.Chodera JD, Swope WC, Pitera JW, Seok C, Dill KA. J. Chem. Theory Comput. 2007;3:26–41. doi: 10.1021/ct0502864. [DOI] [PubMed] [Google Scholar]
- 20. The analysis of replica exchange data by techniques such as MBAR generally assumes that each replica is statistically independent (see Ref. 19 for further discussion)


