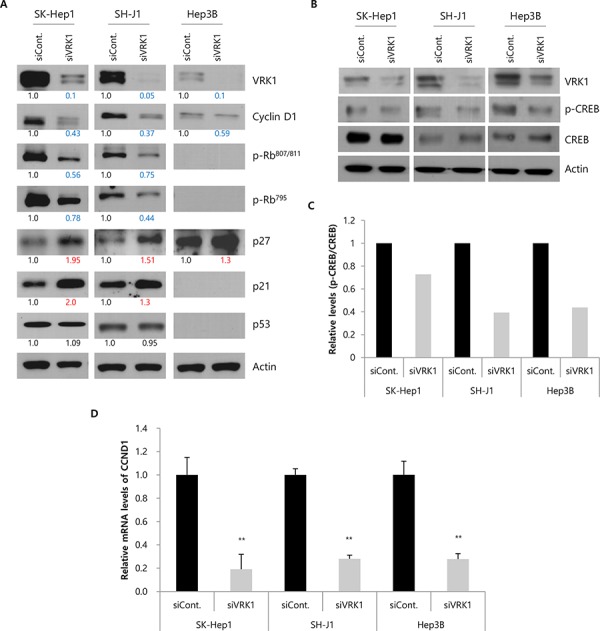
Figure 4. Levels of cell cycle regulators in VRK1-depleted HCC cells.

A. Levels of cell cycle-related proteins and VRK1 were analyzed by Western blotting. Band intensities were quantified by densitometry using Image J and normalized to those of actin serving as the loading control. The intensities were calculated relative to those of the control, which were set to 1.0. Blue and red numbers indicate values lower than 0.8 and higher than 1.2, respectively. B. Levels of p-CREB and CREB proteins were confirmed by Western blotting. C. Relative levels (p-CREB/CREB) are shown in the histogram. Band intensities were measured by densitometry using Image J, and the intensities of the CREB and p-CREB band were normalized to that of the actin band. D. Levels of cyclin D1 mRNA in HCC cells transfected with siRNAs are indicated in the histogram. Cells for Western blotting and RT-PCR were harvested 24 h after transfection. Data shown are representative blots from three independent experiments. (**p < 0.01)
